11email: sparon@iafe.uba.ar 22institutetext: FADU - Universidad de Buenos Aires
The HII region G35.673-00.847: another case of triggered star formation?
Abstract
Aims. As part of a systematic study that we are performing with the aim to increase the observational evidence of triggered star formation in the surroundings of HII regions, we analyze the ISM around the HII region G35.673-00.847, a poorly studied source.
Methods. Using data from large-scale surveys: Two Micron All Sky Survey, Galactic Legacy Infrared Mid-Plane Survey Extraordinaire (GLIMPSE), MIPSGAL, Galactic Ring Survey (GRS), VLA Galactic Plane Survey (VGPS), and NRAO VLA Sky Survey (NVSS) we performed a multiwavelength study of G35.673-00.847 and its surroundings.
Results. The mid IR emission, shows that G35.673-00.847 has an almost semi-ring like shape with a cut towards the galactic west. The radius of this semi-ring is about 15 ( pc, at the distance of kpc). The distance was estimated from an HI absorption study and from the analysis of the molecular gas. Indeed, we find a molecular shell composed by several clumps distributed around the HII region, suggesting that its expansion is collecting the surrounding material. We find several YSO candidates over the molecular shell. Finally, comparing the HII region dynamical age and the fragmentation time of the molecular shell, we discard the collect and collapse as the mechanism responsible for the YSOs formation, suggesting other processes such as radiative driven implosion and/or small-scale Jeans gravitational instabilities.
Key Words.:
ISM: HII regions – ISM: clouds – stars: formation1 Introduction
During the last years, the Galactic Legacy Infrared Mid-Plane Survey Extraordinaire (GLIMPSE) performed with data obtained from the Spitzer Space Telescope, was a very useful tool to study the Galactic IR emission with unprecedented quality and resolution, and still remains so. Using these mid-IR data, for instance, it is possible to clearly identify the photodissociation regions (PDRs) surrounding HII regions. Thus, from a multiwavelength analysis can be studied the interaction between the HII region and the surrounding interstellar medium (ISM), and eventually discover triggered star formation. One of the triggered processes recently largely studied in the HII region borders is the “collect and collapse”, which was early proposed by Elmegreen & Lada (1977). In such process, during the supersonic expansion of an HII region, a dense layer of material can be collected between the ionization and the shock fronts. This layer can be fragmented in massive condensations that then can collapse to lead the formation of new massive stars and/or clusters. Recent observational studies support that this mechanism is taking place in several HII regions (see e.g. Petriella et al. 2010; Pomarès et al. 2009; Zavagno et al. 2007, and references therein).
G35.673-00.847 (hereafter G35.6) is an HII region poorly studied. The source was cataloged in the HII region catalogue of Lockman (1989), who obtained a recombination line at v km s-1. According to the IRAS catalogue of Point Sources, G35.6 coincides with the source IRAS 18569+0159. In the NRAO VLA Sky Survey (NVSS), Condon et al. (1998) identified two radio sources: NVSS 185929+020334 and 185938+020012 towards this region.
This work is part of a systematic study that we are performing with the aim to increase the observational evidence of triggered star formation in the surroundings of HII regions. We present a molecular and near- and mid-IR study of the environment that surrounds the HII region G35.6 with the purpose of exploring the ISM around it, and looking for signatures of star formation.
2 Data
We analyzed data extracted from four large-scale surveys: Two Micron All Sky Survey (2MASS)1112MASS is a joint project of the University of Massachusetts and the Infrared Processing and Analysis Center/California Institute of Technology, funded by the National Aeronautics and Space Administration and the National Science Foundation., Galactic Legacy Infrared Mid-Plane Survey Extraordinaire (GLIMPSE), MIPSGAL and GRS222Galactic Ring Survey (Jackson et al., 2006).
GLIMPSE is a mid infrared survey of the inner Galaxy performed using the Spitzer Space Telescope. We used the mosaicked images from GLIMPSE and the GLIMPSE Point-Source Catalog (GPSC) in the Spitzer-IRAC (3.6, 4.5, 5.8 and 8 m). IRAC has an angular resolution between 15 and 19 (see Fazio et al. 2004 and Werner et al. 2004). MIPSGAL is a survey of the same region as GLIMPSE, using MIPS instrument (24 and 70 m) on Spitzer. The MIPSGAL resolution at 24 m is 6′′.
The GRS was performed by the Boston University and the Five College Radio Astronomy Observatory (FCRAO). The survey maps the Galactic Ring in the 13CO J=1–0 line with an angular and spectral resolution of 46′′ and 0.2 km s-1, respectively (see Jackson et al. 2006). The observations were performed in both position-switching and On-The-Fly mapping modes, achieving an angular sampling of 22′′.
3 Presentation of G35.673-00.847 (G35.6)
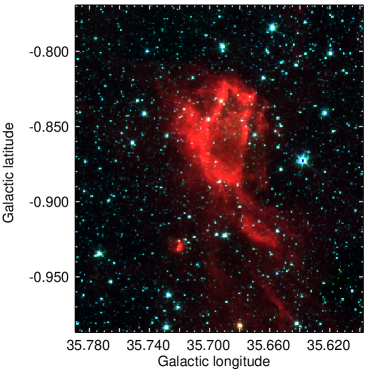
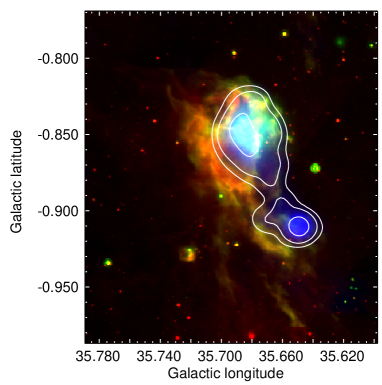
Figure 1 shows two composite three color images of G35.6. The left image displays three Spitzer-IRAC bands: 3.6 m (in blue), 4.5 m (in green) and 8 m (in red). The right image shows the Spitzer-IRAC emission at 8 m (in red), the Spitzer-MIPSGAL emission at 24 m (in green) and the NVSS radio continuum emission at 20 cm (in blue and emphasized with white contours). Both figures clearly show the PDR visible in the 8 m emission, which is mainly originated in the polycyclic aromatic hydrocarbons (PAHs). The PAHs emission delineates the HII region boundaries because these large molecules are destroyed inside the ionized region, but are excited in the PDR by the radiation leaking from the HII region (Pomarès et al., 2009). The 24 m emission reveals the presence of hot dust, and the radio continuum emission shows two sources, one related to G35.6, probably due to its ionized gas, and other lying towards the south. Both sources are: NVSS 185929+020334 and 185938+020012, respectively (Condon et al., 1998). The PAH emission shows that G35.6 has an almost semi-ring like shape with a cut towards the galactic west. The radius of this semi-ring is about 15. Extending towards the south is visible another PDR, which can be related to the radio continuum source NVSS 185938+020012. On the other hand, a little bubble is present in the field, at 722, 928. The emission at 8 m and 24 m, showing the presence of PAH and hot dust towards this bubble, suggest that it could be a young HII region.
4 Distance
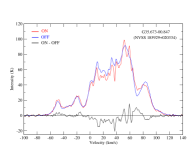
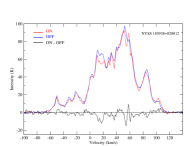
G35.6 presents a radio recombination line at v km s-1 (Lockman, 1989), which, by applying the flat galactic rotation curve of Fich et al. (1989), that assumes circular rotation around the galactic center, gives the possible kinematic distances of or kpc. This ambiguity arises because we are studying a region in the first galactic quadrant, where a given velocity may be associated with two possible distances. Using HI data we performed an absorption study towards the radio sources G35.6 (NVSS 185929+020334) and NVSS 185938+020012. Figure 2 shows the HI spectra towards both sources. The HI emission obtained over the source (the On position: a beam over the radio maximum of the source) is presented in red, in blue is presented the average HI emission taken from four positions separated by approximately a beam from the source in direction of the four galactic cardinal points (the Off position), and the subtraction between them is presented in black, which has a 3 uncertainty of 10 K. The figure shows that both sources have similar HI absorption features, suggesting that they are located at the same distance. The last absorption feature appears at v 61 km s-1, in coincidence with the G35.6 recombination line (Lockman, 1989). Taking into account that the tangent point (at v 89.7 km s-1) does not present any absorption, following Kolpak et al. (2003), we favour the near kinematic distance.
5 Molecular analysis
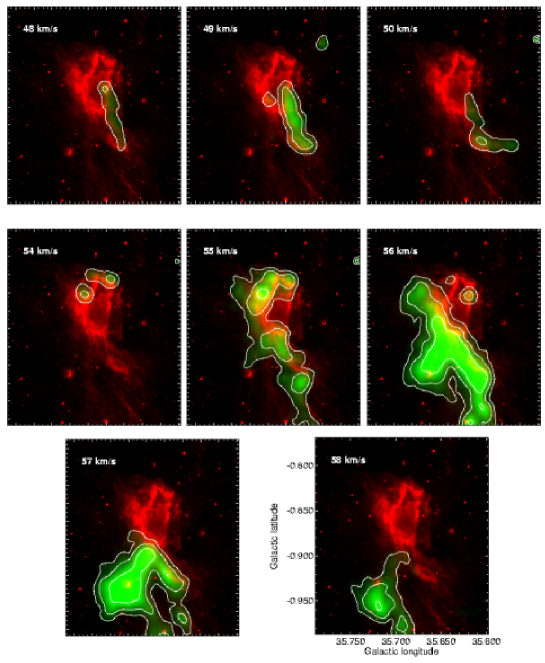
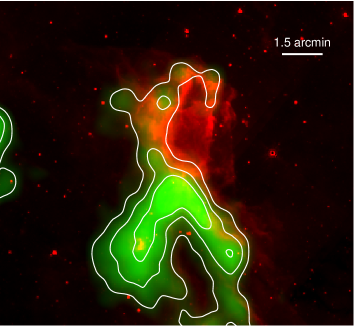
We analyze the whole 13CO J=1–0 data cube and we find some interesting molecular structures between 47 and 60 km s-1. Figure 3 displays the integrated velocity channel maps of the 13CO J=1–0 emission every 1 km s-1, showing the kinematical and morphological structure of a molecular cloud probably related to the HII region G35.6. Between and 51 km s-1 appears a molecular structure delineating the PDR that extends to the south. No molecular gas is observed between 51 and 54 km s-1 (this velocity interval is not shown in Fig. 3). Finally, between 54 and 59 km s-1 appear several molecular clumps distributed over the borders of G35.6 and the southern PDR, which may indicate that the collect and collapse process could be taking place in this region. As Deharveng et al. (2005) point out, the presence of a dense molecular shell surrounding the ionized gas of an HII region, or the presence of massive fragments regularly spaced along the ionization front, can prove that we are dealing with the collect and collapse mechanism. Figure 4 shows the 13CO J=1–0 emission integrated between 53 and 61 km s-1 (in green) over the 8 m emission (in red). The very good correspondence between the eastern HII region border, traced by the IR emission, and the molecular gas, strongly suggests that the observed molecular shell has been swept and shaped by the expansion of G35.6. The central velocity of the molecular gas is km s-1, which gives the possible kinematic distances of 3.7 or 10.1 kpc. According to the study presented in Sec. 4, we favour the nearest one. Taking into account that the ionized gas may be moving away from the molecular material, we use the central velocity of the molecular gas to adopt 3.7 kpc as the distance of the whole complex.
In order to have an estimate of the mass and density of the described molecular shell, we assume LTE, an excitation temperature of 20 K, a distance of 3.7 kpc, and that the 13CO emission is optically thin. From the standard LTE equations, we obtain a N(13CO) cm-2, and using the relation N(H2)/N(13CO) (e.g. Simon et al. 2001), we obtain a molecular mass and a density of M⊙ and cm-3, respectively. The integration was performed over all the observed positions within the 4.5 K km s-1 contour level shown in Fig. 4, following the shell geometry shown at the 55 km s-1 channel map in Fig. 3, i.e., the molecular condensation extending towards the southeast was not considered. To calculate the volume of the molecular shell, we assume a length along the line of sight of 1′ ( 1.1 pc at the distance of 3.7 kpc), which is approximately the average of the shell width seen in the plane of the sky (see the 55 km s-1 channel map in Fig. 3). On the other hand, it is important to note that the little bubble described in Sec. 3, probably a young HII region, is likely embedded in this molecular condensation, suggesting to be active in star formation.
6 Exciting stars
No exciting star of the HII region G35.6 was found in the literature. In this work, we give some indirect evidence suggesting the possible location and properties of the exciting star(s) of the region.
The first piece of information is given by the radio continuum emission of G35.6, which allow us to derive the expected spectral type of the exciting star. The number of UV ionizing photons needed to keep an HII region ionized is given by (Chaisson, 1976), where is the electron temperature in units of K, the distance in kpc, the frequency in GHz, and the measured total flux density in Jy. Assuming an electron temperature of T K, a distance of 3.7 kpc, and using a total flux density of 0.86 Jy at 2.7 GHz for G35.6 (Reich et al., 1984) and a total flux density of 0.053 Jy at 1.4 GHz for NVSS 185938+020012 (Condon et al., 1998), the total amount of ionizing photons needed to keep these sources ionized turns out to be about ph s-1 and ph s-1, respectively. It is well established that part of the UV radiation can be dissipated in heating the dust. In fact, Inoue (2001) and Inoue et al. (2001) demonstrated that typically only half of the Lyman continuum photons from the central source in a Galactic HII region ionizes neutral hydrogen, and the rest are absorbed by dust grains within the ionized region. Taking this into account, considering errors of about ten percent in the distance and in the radio continuum flux at 2.7 GHz, and based on the ionizing fluxes for massive stars given by Martins et al. (2005), the estimated spectral type of the ionizing star of G35.6 ranges between O7.5V and O9V.
| # | 2MASS Designation | MJ | MH | MK | O-type star | ||||
|---|---|---|---|---|---|---|---|---|---|
| R1 | |||||||||
| 1 | J18593297+0202530 | 11.92 | 11.52 | 11.40 | 4.18 | -2.10 | -2.05 | -1.91 | - |
| 2 | J18593204+0204495 | 16.67 | 13.34 | 11.69 | 30.26 | -4.70 | -4.80 | -4.54 | yes |
| 3 | J18592664+0204362 | 13.90 | 10.54 | 8.86 | 30.61 | -7.58 | -7.66 | -7.41 | - |
| 4 | J18593563+0203404 | 15.05 | 12.25 | 10.88 | 25.44 | -4.97 | -5.05 | -4.81 | yes |
| 5 | J18593189+0203454 | 14.66 | 12.11 | 11.01 | 22.12 | -4.42 | -4.60 | -4.31 | yes |
| 6 | J18592786+0203057 | 14.14 | 11.88 | 10.92 | 19.58 | -4.23 | -4.39 | -4.11 | yes |
| 7 | J18593076+0205225 | 11.11 | 10.60 | 10.52 | 4.31 | -2.95 | -2.99 | -2.80 | - |
| 8 | J18592979+0202149 | 13.35 | 11.05 | 10.05 | 20.17 | -5.18 | -5.32 | -5.05 | - |
| 9 | J18593057+0202486 | 13.28 | 10.70 | 9.53 | 22.81 | -6.00 | -6.13 | -5.87 | - |
| 10 | J18592697+0202073 | 12.66 | 10.11 | 8.89 | 23.09 | -6.69 | -6.77 | -6.53 | - |
| 11 | J18593472+0204518 | 16.34 | 13.32 | 11.88 | 27.07 | -4.13 | -4.26 | -3.99 | yes |
| 12 | J18592785+0203304 | 11.69 | 10.30 | 9.56 | 13.83 | -5.05 | -4.96 | -4.83 | yes |
| 13 | J18593016+0204431 | 13.84 | 10.65 | 8.90 | 30.39 | -7.57 | -7.51 | -7.35 | - |
| 14 | J18593041+0202363 | 14.38 | 12.47 | 11.64 | 16.95 | -3.24 | -3.34 | -3.10 | yes |
| 15 | J18592897+0202470 | 11.54 | 9.09 | 7.87 | 22.60 | -7.67 | -7.71 | -7.50 | - |
| R2 | |||||||||
| 16 | J18593584+0200579 | 14.35 | 12.37 | 11.51 | 17.50 | -3.43 | -3.53 | -3.29 | yes |
| 17 | J18593743+0200411 | 14.07 | 11.69 | 10.58 | 21.40 | -4.81 | -4.90 | -4.66 | yes |
| 18 | J18593556+0200488 | 13.81 | 11.97 | 11.25 | 15.70 | -3.46 | -3.62 | -3.35 | yes |
| 19 | J18594015+0200255 | 15.76 | 12.94 | 11.67 | 24.73 | -4.06 | -4.23 | -3.94 | yes |
| 20 | J18593887+0200288 | 15.20 | 12.82 | 11.71 | 21.40 | -3.68 | -3.77 | -3.53 | yes |
| 21 | J18593725+0201066 | 15.22 | 13.21 | 12.25 | 18.47 | -2.83 | -2.86 | -2.66 | - |
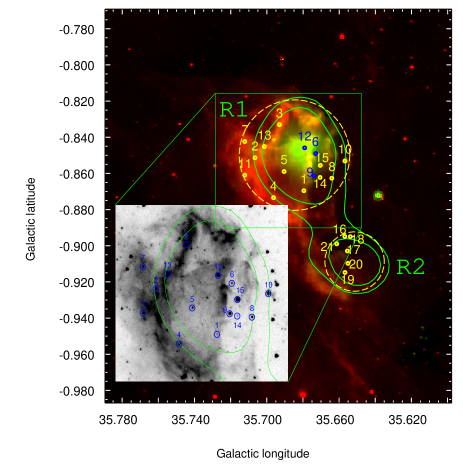
Additionally we perform a photometric study of the infrared point sources in the region based on the GLIMPSE I Spring’07 and the 2MASS All-Sky Point Source Catalogs. Only sources with detections in the four Spitzer-IRAC bands and in the three 2MASS bands were considered. We find 30 and 8 sources towards the HII region G35.6 (R1 in Fig. 5) and towards the source NVSS 185938+020012 (R2 in Fig. 5), respectively. To examine the evolutionary stage of the infrared point sources, we analyze their location onto a color-color IRAC diagram. Following Allen et al. (2004) color criteria, we found 15 and 6 sources in R1 and R2, respectively, that can be classified as main sequence stars (Class III). Table 1 presents these sources with its 2MASS designation (Col. 2), apparent JHK magnitudes (Cols. 3-5), estimated extinctions (Col. 6), calculated absolute JHK magnitudes (Cols. 7-9) and when its derived spectral type coincides with an O-type star is remarked in Col. 10. The errors in the estimated extinctions and in the calculated absolute JHK magnitudes are below 20% and 30%, respetively. The sources are labeled according to Fig. 5, which displays their location into a two color image, where the 8 m and 24 m emissions are displayed in red and green, respectively. The green contours delineate the radio continuum emission at 20 cm. To look for O-type stars (likely responsibles of ionizing the surrounding gas), we use the , , and apparent magnitudes obtained from the 2MASS Point Source Catalog to derive the absolute JHK magnitudes. To perform that, we assume a distance of about 3.7 kpc and we obtain the extinction for each source from the (J-H) and (H-K) colors. We assume the interstellar reddening law of Rieke & Lebofsky (1985) (=0.282; =0.175 and =0.112) and the intrinsic colors and obtained from Martins & Plez (2006). By comparing the derived absolute magnitudes with those tabulated by Martins & Plez (2006), we find that seven sources in Region 1, #2, #4, #5, #6, #11, #12, #14, and five sources in Region 2, #16, #17, #18, #19 and #20, have absolute JHK magnitudes that are in agreement with an O-type star (see Table 1).
Finally, taking into account that the exciting star candidates are expected to be in a PAHs hole, we discard sources #2, #4 and #11 as the responsible of generate G35.6. The rest of the exciting star candidates, sources #5, #6, #12 and #14 are located in projection inside the radio continuum and 24 m emissions; among them, sources #6 and #12 are located close to the maximum of the 24 m emission as could be expectable for an exciting star. On the other hand, as can be seen in Figure 5, source #6, is located into a hole of the 5.8 m emission (see zoom of the region in the figure). It is well known that the exciting star(s) of an HII region generate a cavity of dust and gas through the action of the radiation pressure on the dust grains (Gail & Sedlmayr, 1979), which suggests that source #6 is the more likely candidate to be the exciting star of G35.6. On the other hand, using the same assumptions that in R1, we found that based on the radio continuum flux at 1.4 GHz in R2, the exciting stars of NVSS 185938+020012 would be later than an O9.5V star. The later spectral type stars found in R2 could be sources #16 and #18.
It would be very useful to have UBV fluxes to perform a better photometry in order to identify without doubt the exciting stars, however it is very difficult to obtain these fluxes because of the interstellar absorption towards this region in the Galaxy.
7 Star Formation
In Sec. 5 we show that the HII region G35.6 is evolving and affecting a molecular cloud, presenting an excellent scenario to probe triggered star formation. In this section we look for young stellar objects (YSOs) around G35.6. YSOs are generally classified according to their evolutionary stage: class I are the youngest sources, embedded in dense envelopes of gas and dust, and class II are sources whose emission is originated mainly in the accretion disk around the central protostar. In both cases, a YSO will show an infrared excess that cannot be attributed to the scattering and absorption of the ISM along the line of sight. On the contrary, this infrared excess is mainly due to the presence of the envelope and/or the disk of dust around the central protostar. In other words, YSOs are intrinsically red sources.
. Source GLIMPSE Desig. 2MASS Qual. 3.6 m 4.5 m 5.8 m 8.0 m 24 m (mag) (mag) (mag) (mag) (mag) (mag) (mag) (Jy) YSO 1 G035.7031-00.8232 BAA 16.513 14.154 12.967 12.086 11.603 11.258 10.285 YSO 2 G035.6814-00.8290 AAA 15.830 13.625 12.495 11.284 10.692 10.049 9.182 YSO 3 G035.7086-00.8337 BAA 16.641 13.712 12.405 11.423 11.343 10.609 10.009 YSO 4 G035.6882-00.8346 UUA 18.264 15.119 14.434 12.445 11.992 11.545 10.877 YSO 5 G035.6850-00.8358 UAA 17.304 15.046 13.740 12.101 11.557 11.057 10.513 YSO 6 G035.6836-00.8409 UAE 18.038 15.025 13.485 11.546 11.054 10.487 9.958 YSO 7 G035.6838-00.8496 UAA 17.579 15.185 14.077 12.942 12.344 12.307 11.169 YSO 8 G035.6961-00.8415 N/A 13.176 11.297 9.674 8.558 0.14 YSO 9 G035.6716-00.8708 AAA 15.493 13.459 12.624 11.955 11.845 11.431 10.973 YSO 10 G035.6947-00.8282 N/A 13.616 13.762 9.994 YSO 11 G035.7025-00.8342 N/A 14.065 13.908 9.828 YSO 12 G035.6826-00.8533 N/A 14.114 13.431 10.776 YSO 13 G035.6790-00.8687 N/A 13.970 13.690 10.811 YSO 14 G035.7094-00.9176 N/A 13.583 13.145 11.983 11.299 YSO 15 G035.7166-00.9252 AAA 15.776 13.607 12.112 10.110 9.568 8.992 8.213 0.05 YSO 16 G035.7127-00.9414 AAA 15.713 14.113 13.148 11.797 11.196 10.718 10.142 YSO 17 G035.7032-00.9430 N/A 13.242 12.489 11.977 11.313 YSO 18 G035.7201-00.9180 N/A 14.267 15.532 12.876 11.596 YSO 19 G035.7209-00.9260 UAA 18.218 14.992 13.379 10.983 9.856 9.109 8.363 0.16 YSO 20 G035.7135-00.9309 UUA 18.257 16.988 13.519 11.184 10.301 9.740 9.235 0.05 YSO 21 G035.7099-00.9193 N/A 13.787 12.354 11.781 0.03 YSO 22 G035.7103-00.9428 UAA 16.441 14.637 13.419 12.754 12.716 11.904 11.944 YSO 23 G035.6509-00.9252 AAA 15.825 13.779 12.688 12.018 11.926 11.673 10.935 YSO 24 G035.6613-00.9189 UAA 17.288 14.442 13.061 12.238 11.995 11.687 11.049 YSO 25 G035.6585-00.9103 UAA 18.328 15.205 13.736 12.791 12.505 12.328 11.523 YSO 26 G035.6663-00.9055 UAA 17.509 13.978 12.464 11.240 11.208 10.885 10.344 YSO 27 G035.7002-00.8907 UUA 14.254 12.706 13.451 10.951 9.755 8.856 8.321 0.14 YSO 28 G035.6799-00.8936 UAA 17.204 15.356 14.118 13.152 12.933 10.466 YSO 29 G035.6717-00.9298 N/A 13.379 12.823 11.280 YSO 30 G035.6655-00.9338 N/A 14.952 13.166 11.493 11.337 0.04 YSO 31 G035.6551-00.9593 AAA 16.315 14.103 13.002 12.365 12.317 12.050 11.254 YSO 32 G035.6791-00.9821 UAA 15.364 14.161 12.039 10.210 9.916 9.250 8.524 YSO 33 G035.6883-00.9891 BAA 16.607 14.877 14.225 13.284 13.150 11.873 YSO 34 G035.6820-00.9873 UAA 17.289 14.683 13.584 11.714 11.025 10.649 10.107 YSO 35 G035.6790-00.9851 UUB 18.284 15.686 14.581 11.914 10.942 10.260 9.520 YSO 36 G035.6804-00.9823 UAA 14.186 11.459 9.535 7.425 6.711 5.985 4.827 3332MASS Qual.: A and B are the best photometric qualities, with a SNR and , respectively. E means that the source magnitude is questionable. And U means that the magnitude value is an upper limit.
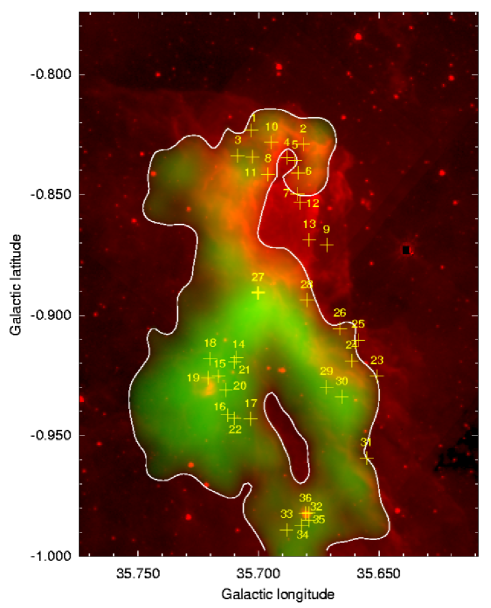
Robitaille et al. (2008) defined a color criterion to identify intrinsically red sources using data from the Spitzer-IRAC bands. Intrinsically red sources satisfy the condition , where and are the magnitudes in the 4.5 and 8.0 m bands, respectively. On the other hand, an externally reddened source is a source not intrinsically red (such as main sequence stars) which appears red because of the interstellar effects. They satisfy the condition and their spectral energy distributions (SEDs) are well fitted by stellar photosphere models with interstellar extinction. In order to consider the errors in the magnitudes, we use the following color criterion to select intrinsically red sources: , where and and are the errors of the 4.5 and 8.0 m bands, respectively. On Fig. 6 we show the distribution of the sources extracted from the GLIMPSE catalog around G35.6 that satisfy the previous criterion (we only considered sources with detections in both 4.5 and 8.0 m bands). The intrinsically red sources are distributed into four groups. The first group (Group 1) is found towards the north and includes sources 1 to 13. A second group (Group 2) of sources is located over the southeastern molecular structure. This portion of the molecular cloud is far from G35.6 and probably is not being perturbed by the HII region. Sources 23, 24, 25, 26, 29 and 30 form Group 3 which appears in the molecular gas likely associated with the border of the radio continuum source NVSS 185938+020012. Then, we identify a fourth group (Group 4) towards the southern portion of the molecular cloud, far from the HII regions. And finally, sources 27, 28 and 31 that are not part of any group. Sources 27 and 28, taking into account their position, could be related to G35.6 southern border. On Table 2 we report the fluxes of the intrinsically red sources in the 2MASS and Spitzer-IRAC bands, specifying the GLIMPSE designation (Col. 2) and the 2MASS photometric quality (Col. 3). In the case of sources 8, 15, 19, 20, 21, 27, and 30, we obtained their fluxes at 24 m from the MIPS image and are presented in Col. 11 of the table.
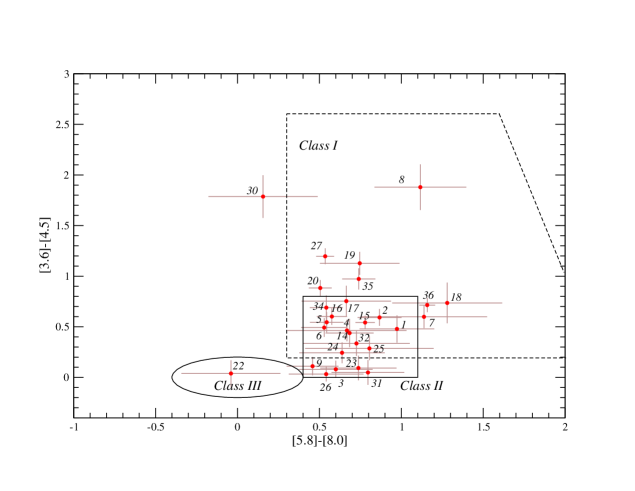
So far we have identified the intrinsically red sources located right upon the molecular gas around the HII region G35.6. However, according to Robitaille et al. (2008) intrinsically red sources may include YSOs, planetary nebulae (PNe), galaxies, AGNs, and AGB stars. We must apply an additional constraint to these sources in order to discern their real nature. Regarding extragalactic sources, Robitaille et al. (2008) pointed out that at most 0.4% of the intrinsically red sources selected by the color criterion are galaxies and AGNs. So, there is a little probability to find an extragalactic source in our short sample of red sources. Concerning to AGB stars, we look in catalogues for these stars. In the region analyzed in this work there are not any AGB star catalogued. To look for YSOs and PNe candidates we constructed a color-color (CC) diagram [5.8]-[8.0] versus [3.6]-[4.5] with the sources from Table 2 that have flux detections in the four Spitzer-IRAC bands. We used the photometric criteria of Allen et al. (2004) to identify class I and II YSOs (Fig. 7). From its positions in this color-color diagram we find that only source 22 cannot be classified as a class I or II YSO. Source 30 falls outside the class I region but if we take into account the errors in the fluxes we should consider it as a YSO candidate. On the other hand, sources 7 and 18 are found in the CC diagram close to the location of PNe, which typically have [5.8]-[8.0] (Cohen et al., 2007). However, we will consider them as YSO candidates too.
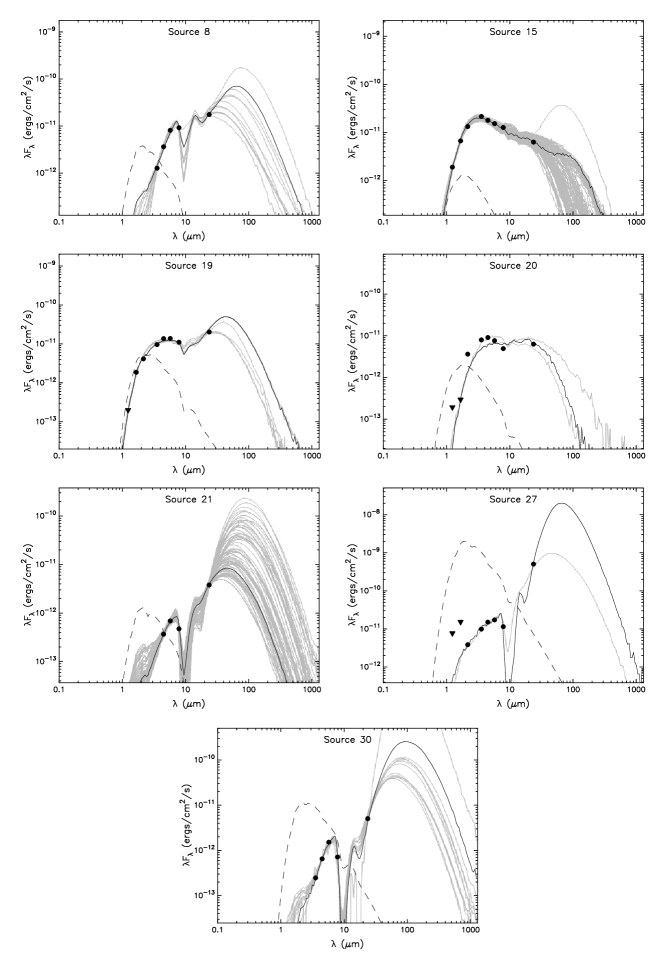
Finally, we fitted the spectral energy distribution (SED) of the sources from which we obtained fluxes at 24 m from the MIPS image using the tool developed by Robitaille et al. (2007) and available online444http://caravan.astro.wisc.edu/protostars/. We assume an interstellar absorption between 12 and 22 mag. These values where obtained from the 2MASS J-H versus H-Ks color-color diagram (not presented here) constructed with the sources with the best photometric quality (AAA) within a circle of 8′ in radius centered at G35.6. The lower value is compatible with the expected extinction towards star forming regions which, according to Neckel & Klare (1980), is generally greater than 10 magnitudes. The upper value is in agreement with the visual absorption of mag obtained from (Bohlin et al., 1978), where N(H) N(HI)2N(H2) is the line-of-sight hydrogen column density towards this region, which is about 4 cm-2. This value was obtained from the HI column density derived from the VGPS HI data and from the H2 column density derived from the 13CO J=1–0 data.
The SED good fitting models are selected according to the following condition: , where is the of the YSO best-fit model, and N is the number of input data fluxes (fluxes specified as upper limit do not contribute to N). Hereafter, we refer to models satisfying the above equation as “selected models”. The fitting tool also fits the data to a stellar photosphere and defines the parameter to evaluate the goodness of the fitting. By making a comparison between and we can confirm which sources are in fact YSOs and which sources may be stars externally reddened by the ISM. The SED fitting allows us to establish the evolutionary stage of the YSO candidates by considering the physical parameters of the sources: the central source mass , the disk mass , the envelope mass , and the envelope accretion rate . According to Robitaille et al. (2006), stage I YSOs are those that have , i.e., protostars with large accretion envelopes; stage II are those with and , i.e., young objects with prominent disks; and stage III are those with and , i.e., evolved sources where the flux is dominated by the central source.
| Source | n | M⋆ | Mdisk | Menv | Stage | |||
|---|---|---|---|---|---|---|---|---|
| (M⊙) | (M⊙) | (M⊙) | (M) | |||||
| YSO 8 | 1 | 520 | 12 | I | ||||
| YSO 15 | 0.4 | 50 | 109 | II | ||||
| YSO 19 | 1 | 7 | I, II | |||||
| YSO 20 | 28 | 1 | 5 | 0 | II | |||
| YSO 21 | 0.1 | 505 | 72 | I | ||||
| YSO 30 | 1.5 | 580 | 12 | I | ||||
| YSO 27 | 1.3 | 9999 | 2 | I |
In Table 3, we report the main results of the fitting output for the YSO candidates from which we obtained fluxes at 24 m from the MIPS image. In Col. 2 and 3 we report the per data point of the YSO and stellar photosphere best-fit model, respectively, and in Col. 4 the number of models satisfying the equation. The remaining columns report the physical parameters of the source, specifying the range of values of the selected models: central source mass, disk mass, envelope mass, and envelope accretion rate, respectively. Following the criteria of Robitaille et al. (2006), the last column indicates the evolutionary stage inferred from the inspection of the selected models. Figure 8 shows the SED of these sources. From this analysis can be appreciated that for source 15 the flux at the longer wavelengths comes mainly from the disk, indicating that it is a class II YSO, in coincidence with its position in the Spitzer-IRAC CC diagram. The SED for source 20 also shows the characteristics of a class II YSO. In the case of source 19 the selected models indicate that this source could be stage I and II. For sources 8, 21, 27, and 30 the selected models are stage I and the SED shows that the flux at the longer wavelengths is dominated by the envelope flux. These sources, together with source 19, are located in the region of class I YSO in the CC diagram (except for source 21 that lacks flux at 3.6 m), confirming their youth.
From Fig. 7 and the SED analysis we can confirm the presence of YSOs around G35.6. Thus, we conclude that the region is indeed active in star formation and we suggest that the birth of some of the YSOs, mainly those belonging to Group 1 and sources 27 and 28 could have been triggered by the expansion of the HII region G35.6. Most of the remaining intrinsically red sources belonging to Group 2, 3, and 4 may also be YSOs but their position far from the HII region does not allow us to confirm that their formation was triggered by G35.6.
8 Collect and collapse scenario
In order to determine if the collect and collapse mechanism is the responsible for the star formation that is taking place in the periphery of the HII region G35.6, we estimate and compare the age of the HII region and the fragmentation time predicted by the theoretical models of Whitworth et al. (1994a, b).
Using a simple model described by Dyson & Williams (1980) we calculate the age of the HII region at a given radius as:
where is the sound velocity in the ionized gas (=10 km s-1) and is the radius of the Strömgren sphere, given by , where =2.6 cm3 s-1 is the hydrogen recombination coefficient to all levels above the ground level. is the total number of ionizing photons per unit of time emitted by the star(s), and is the original ambient density.
Taking into account the results of Sec. 6, we consider a Lyman continuum photon flux of 1.0 ph s-1. Adopting a radius of 1.5 for the HII region, a distance of 3.7 kpc, and an original ambient density of cm-3, we derive a dynamical age between 0.18 and 0.35 Myr for G35.6. To coarsely estimate the original ambient density (assuming an error of 50%) we distributed the above calculated mass of the molecular shell, 104 M⊙, over an ellipsoid of revolution with semiaxes of 3 and 7 pc that encloses the molecular and ionized gas.
As analyzed in Sec. 5, the morphology of the molecular gas that encircles the HII region suggests that the expansion of G35.6 is collecting the gas at its periphery. Finally, we ask if the fragmentation of the collected layer of material can be taking place in the region. To answer it, we estimate when the fragmentation of the collected layer should occur according to the Whitworth’s models Assuming a turbulent velocity in the collected layer as ranging between 0.2 and 0.6 km s-1 (Whitworth et al., 1994b), a Lyman continuum photon flux of 1.0 ph s-1 , and the previously estimated original ambient density of cm-3, we find that the fragmentation process in the periphery of G35.6 should occur between 1.6 and 5.3 Myr after its formation, a time larger than the G35.6 dynamical age derived above. The range for the fragmentation time arises from considering the error in the original ambient density and the range in the turbulent velocity. Thus, we conclude that the formation of the YSOs lying at the border of the HII region most probably results from other processes, such as the radiative driven implosion (RDI) mechanism, which consists in interactions of the ionization front with pre-existing condensations (Lefloch & Lazareff, 1994), or small-scale Jeans gravitational instabilities in the collected layer.
9 Summary
Using multiwavelength surveys and archival data, we studied the ISM towards the HII region G35.673-00.847 (G35.6). This work is part of a systematic study that we are performing with the aim to increase the observational evidence of triggered star formation in the surroundings of HII regions. The main results can be summarized as follows:
(a) The PAH emission around G35.6 seen at 8 m shows that the HII region has an almost semi-ring like shape with a cut towards the galactic west. The radius of this semi-ring is about 15. The 24 m emission reveals the presence of hot dust in the interior of the HII region.
(b) The radio continuum emission shows that towards the south of G35.6, also identified as NVSS 185929020334, lies the radio source NVSS 185938020012, probably another HII region. From the HI absorption analysis we conclude that both sources are located at the same distance, and from the central velocity of the related molecular gas, we estimate that the whole complex is at the kinematic distance of kpc.
(c) Using the 13CO J 1–0 transition we analyze the molecular gas around G35.6. We find a molecular shell composed by clumps distributed around the HII region, suggesting that its expansion is collecting the material. The molecular shell has a density of about 104 cm-3.
(d) From a photometric study and a SED analysis we find several sources (YSO candidates) very likely embedded in the molecular shell.
(e) We give some indirect evidence suggesting the possible location and properties of the exciting star(s) of G35.6 and NVSS 185938020012. In the case of G35.6, from the radio continuum flux, the near-IR photometry and the physical location of the analyzed sources, we find four candidates, likely O-type stars, to be the ionizing agent of the HII region. Among them, two are located close to the maximum of the 24 m emission, and one of them (our source #6) appears into a hole of 5.8 m emission, suggesting to be the most likely candidate. In the case of NVSS 185938020012, we suggest that the exciting star(s) would be later than an O9.5V star.
(f) Analyzing the HII region G35.6 dynamical age and the fragmentation time of the molecular shell surrounding the HII region, we discard the collect and collapse as the mechanism responsible for the YSOs formation. We propose other possible processes of formation, such as radiative driven implosion and/or small-scale Jeans gravitational instabilities in the collected layer.
Acknowledgments
We wish to thank the anonymous referee whose comments and suggestions have helped to considerably improve the paper. S.P. is member of the Carrera del investigador científico of CONICET, Argentina. A.P. and M.O. are doctoral and postdoctoral fellows of CONICET, Argentina, respectively. This work was partially supported by Argentina grants awarded by UBA, CONICET and ANPCYT.
References
- Allen et al. (2004) Allen, L. E., Calvet, N., D’Alessio, P., & et al. 2004, ApJS, 154, 363
- Bohlin et al. (1978) Bohlin, R. C., Savage, B. D., & Drake, J. F. 1978, ApJ, 224, 132
- Chaisson (1976) Chaisson, E. J. 1976, in Frontiers of Astrophysics, 259–351
- Cohen et al. (2007) Cohen, M., Parker, Q. A., Green, A. J., et al. 2007, ApJ, 669, 343
- Condon et al. (1998) Condon, J. J., Cotton, W. D., Greisen, E. W., et al. 1998, AJ, 115, 1693
- Deharveng et al. (2005) Deharveng, L., Zavagno, A., & Caplan, J. 2005, A&A, 433, 565
- Dyson & Williams (1980) Dyson, J. E. & Williams, D. A. 1980, Physics of the interstellar medium (New York, Halsted Press, p. 204)
- Elmegreen & Lada (1977) Elmegreen, B. G. & Lada, C. J. 1977, ApJ, 214, 725
- Fazio et al. (2004) Fazio, G. G., Hora, J. L., Allen, L. E., et al. 2004, ApJS, 154, 10
- Fich et al. (1989) Fich, M., Blitz, L., & Stark, A. A. 1989, ApJ, 342, 272
- Gail & Sedlmayr (1979) Gail, H. & Sedlmayr, E. 1979, A&A, 76, 158
- Inoue (2001) Inoue, A. K. 2001, AJ, 122, 1788
- Inoue et al. (2001) Inoue, A. K., Hirashita, H., & Kamaya, H. 2001, ApJ, 555, 613
- Jackson et al. (2006) Jackson, J. M., Rathborne, J. M., Shah, R. Y., et al. 2006, ApJS, 163, 145
- Kolpak et al. (2003) Kolpak, M. A., Jackson, J. M., Bania, T. M., Clemens, D. P., & Dickey, J. M. 2003, ApJ, 582, 756
- Lefloch & Lazareff (1994) Lefloch, B. & Lazareff, B. 1994, A&A, 289, 559
- Lockman (1989) Lockman, F. J. 1989, ApJS, 71, 469
- Martins & Plez (2006) Martins, F. & Plez, B. 2006, A&A, 457, 637
- Martins et al. (2005) Martins, F., Schaerer, D., & Hillier, D. J. 2005, A&A, 436, 1049
- Neckel & Klare (1980) Neckel, T. & Klare, G. 1980, A&AS, 42, 251
- Petriella et al. (2010) Petriella, A., Paron, S., & Giacani, E. 2010, A&A, 513, A44+
- Pomarès et al. (2009) Pomarès, M., Zavagno, A., Deharveng, L., et al. 2009, A&A, 494, 987
- Reich et al. (1984) Reich, W., Fuerst, E., Haslam, C. G. T., Steffen, P., & Reif, K. 1984, A&AS, 58, 197
- Rieke & Lebofsky (1985) Rieke, G. H. & Lebofsky, M. J. 1985, ApJ, 288, 618
- Robitaille et al. (2008) Robitaille, T. P., Meade, M. R., Babler, B. L., et al. 2008, AJ, 136, 2413
- Robitaille et al. (2007) Robitaille, T. P., Whitney, B. A., Indebetouw, R., & Wood, K. 2007, ApJS, 169, 328
- Robitaille et al. (2006) Robitaille, T. P., Whitney, B. A., Indebetouw, R., Wood, K., & Denzmore, P. 2006, ApJS, 167, 256
- Simon et al. (2001) Simon, R., Jackson, J. M., Clemens, D. P., Bania, T. M., & Heyer, M. H. 2001, ApJ, 551, 747
- Stil et al. (2006) Stil, J. M., Taylor, A. R., Dickey, J. M., et al. 2006, AJ, 132, 1158
- van der Tak et al. (2007) van der Tak, F. F. S., Black, J. H., Schöier, F. L., Jansen, D. J., & van Dishoeck, E. F. 2007, A&A, 468, 627
- Werner et al. (2004) Werner, M. W., Roellig, T. L., Low, F. J., et al. 2004, ApJS, 154, 1
- Whitworth et al. (1994a) Whitworth, A. P., Bhattal, A. S., Chapman, S. J., Disney, M. J., & Turner, J. A. 1994a, A&A, 290, 421
- Whitworth et al. (1994b) Whitworth, A. P., Bhattal, A. S., Chapman, S. J., Disney, M. J., & Turner, J. A. 1994b, MNRAS, 268, 291
- Zavagno et al. (2007) Zavagno, A., Pomarès, M., Deharveng, L., et al. 2007, A&A, 472, 835