Orientation effects in quasar spectra: The broad- and narrow-line regions
Abstract
We use the Sloan Digital Sky Survey, along with the NRAO VLA Sky Survey and the Westerbork Northern Sky Survey to define a sample of 746 radio-loud quasars and measure their 330 MHz to 1.4 GHz spectral indexes. Following previous authors we take the radio spectral index as an indicator of the orientation towards the quasars such that more pole-on sources tend to have flatter spectral indexes. We use this proxy for the orientation of quasars to investigate the effect orientation may have on optical spectra.
Quasars with flatter spectral indices tend to be brighter. However, we find no indication of reddening in steep-spectrum QSOs to indicate obscuration of the accretion disk by a torus as a possible explanation. Nor do we find increased redddening in the flat-spectrum sources which could imply a contribution from jet-related synchrotron emission.
We reproduce a previously-described anti-correlation between the width of the Mg ii line and radio spectral index that indicates a disk-like geometry for the Mg ii BLR. However, in contrast to previous authors we find no such correlation for the C iv line suggesting a more isotropic high-ionisation BLR.
Both the [O ii] and [O iii] narrow lines have more flux in steep spectrum sources while the [O iii]/[O ii] flux ratio is lower in these sources. To describe both of these effects we propose a simple geometric model in which the NLR exists primarily on the surface of optically thick clouds facing the active nucleus and the NLR is stratified such that higher-ionisation lines are found preferentially closer to the nucleus.
Quantitatively we find that orientation may effect the observed strength of narrow lines, as well as ratios between lines, by a factor of 2. These findings have implications for the use of [O iii] and [O ii] emission lines to estimate bolometric luminosities, as well as comparisons between narrow line luminosity functions for type 1 and type 2 objects and the potential of emission-line diagnostic diagrams as an accurate tool with which to distinguish types of active galactic nuclei.
Finally we find no evidence that BAL QSOs have a different spectral index distribution to non-BALS although we only have 25 obvious BALs in our sample.
keywords:
galaxies: quasars: emission lines1 Introduction
Orientation plays a key role in the unification model for active galactic nuclei (AGN; Antonucci 1993) as one of the most important parameters that define the optical characteristics of an AGN. While we have become familiar with appealing to orientation in order to explain the different classes of observed AGN, the effects of orientation within a single class of objects are less well understood. This paper aims to study the effect of orientation on spectra of quasi-stellar objects (QSOs) by using the radio spectral index as a proxy for orientation. Our findings can broadly be categorised into those pertaining to the broad-line region (BLR) and those pertaining to the narrow-line region (NLR). We will discuss these separately throughout much of the paper. We also touch on the effect of orientation on the optical continuum shape and proportion of broad-absorption line (BAL) systems in QSO spectra later in the paper.
1.1 Orientation and the BLR
The BLR is too small to be spatially resolved with current telescopes, hence the geometry of the BLR, and the physics that governs its dynamics, is not well constrained. There are some indications that the dynamics of the BLR may be dominated by the local gravitational potential (e.g. Peterson & Wandel 1999). Virial supermassive black-hole (SMBH) mass estimators make use of this assumption to estimate the masses of SMBHs in QSOs.
Integral to SMBH mass estimators for QSOs is an assumption about the geometry of the BLR. This is commonly expressed as a single factor, , which translates the measured FWHM of a spectral line into the velocity of the BLR, ,
| (1) |
Hence, given the radius of the BLR (), and assuming that the local gravitational field governs the dynamics, the SMBH mass () can be estimated as
| (2) |
The value of is unknown. Model values give for a spherically symmetric BLR (Peterson & Wandel, 1999), or for a disk BLR inclined at an angle to the observer (McLure & Dunlop, 2002), hence orientation can affect the value of and can bias SMBH mass estimates (Jarvis & McLure, 2002).
Given the interest in BLR dynamics, and their importance to SMBH mass estimation, there have been many studies of the structure of the BLR. Techniques employed include defining a proxy for orientation and using it to look at the effect on broad lines (Brotherton, 1996; Jarvis & McLure, 2006), working out SMBH masses through a method independent of the virial technique and then working backwards through the virial equation to give (McLure & Dunlop, 2002; Onken et al., 2004; Labita et al., 2006), looking at the broad line distribution as a whole and gleaning results from that (Osterbrock, 1977; Fine, et al., 2008), velocity-resolved reverberation mapping (Kollatschny & Dietrich, 1996; Denney, et al., 2010; Bentz, et al., 2010) and recently through X-ray absorption (Risaliti et al., 2010).
In radio-loud QSOs the ratio () between core and lobe emission has been employed as an orientation indicator under the assumption that core emission is Doppler-boosted when observed down the axis of the object (Orr & Browne, 1982; Wills & Browne, 1986; Vestergaard et al., 2000). Core emission from radio-loud QSOs tends to have a flatter spectral index (; ) than lobe emission due to a superposition of many Doppler-boosted synchrotron self-absorbed spectra. Hence observing a radio loud QSO down the jet axis, not only enhances the observed core emission, but also flattens the radio spectrum (Wills & Browne, 1986; Jarvis & McLure, 2002, 2006).

The relation between and observing angle is by no means exact and must include significant scatter due to intrinsic differences between radio sources. A guide for connecting to the observing angle for a radio-loud QSO can be found in the simulations of Wilman, et al. (2008) based on the dual-population models of Jackson & Wall (1999). In their semi-empirical simulation of the radio source population Wilman, et al. (2008) included a relativistic beaming model for sources with a random distribution of viewing angles on the sky. Full details can be found in Wilman, et al. (2008), and in Fig. 1 we plot the 330 MHz to 1.4 GHz radio spectral index against the viewing angle to the source for all FR I and FR II objects in the simulation. Note that in these models the extended emission is assumed to have and the resulting distribution of spectral indexes is limited by the same value. The solid line in Fig. 1 is a linear fit to the data in – space. We only plot the figure for as objects observed from a larger angle would likely be obscured. Steeper-spectrum objects do exist and help illustrate the difficulties in modelling the radio source population. However, the radio spectral index has been shown to work as an orientation indicator (Wills & Browne, 1986; Brotherton, 1996), though we must be mindful that there is a large scatter in the relation.
By taking or as proxies for orientation, and comparing these with broad line profiles from optical spectra, several authors have found strong evidence that broad emission lines are narrower in radio-loud QSOs viewed down the jet axis (Wills & Browne, 1986; Brotherton, 1996; Vestergaard et al., 2000; Jarvis & McLure, 2006). The simple interpretation of these results in that the BLR is confined to a disk, hence reducing the line-of-sight velocity when viewed down the pole. It is also worth pointing out that if the BLR was in any way coupled to the jet, i.e. the material was entrained by the jet, then we would expect a large offset and broadening of the emission lines which we do not observe.
For radio-quiet QSOs, a common technique for studying the effect of orientation on the BLR is by making orientation-independent empirical estimates for the mass of QSO SMBHs. By comparing these with virial SMBH mass estimates, which would be effected by a non-spherical BLR, can be calculated and used to deduce the emitting structure.
McLure & Dunlop (2002) compared SMBH mass estimates from the relation and the H virial relation in a small sample of radio-quiet QSOs. Based on a fit to their line width distribution, where they assume a pure-disk model for the BLR (i.e. ), McLure & Dunlop (2002) calculated the average correction factor for virial SMBH mass estimates as a function of observed line width. They then showed that correcting virial masses by this factor improved the agreement with SMBH mass estimates based on the relation. Hence they argue that their disk model for the H BLR is valid.
Since, Labita et al. (2006) and Decarli et al. (2008) have produced similar analyses indicating that the C iv BLR may also be disk-like.
Studies of the broad line distribution on its own have also shed light on the geometry of the BLR. Osterbrock (1977) argued that the lack of narrow-line Seyfert 1s in a sample of 36 objects was evidence that rotation could not be invoked to explain the width of broad lines. Later Fine, et al. (2008) and Fine et al. (2010) investigated the Mg ii and C iv line width distribution in a large dataset of () QSO spectra. These analyses showed that the variation in line width between QSOs is so slight that the BLR cannot be strongly geometrically constrained.
Richards, et al. (2002) showed that C iv emission-line shifts with respect to other spectral features are due to/accompanied by a drop off in flux in the red wing of the line. They proposed an orientation-based model to describe their observations in which the C iv BLR is associated with an outflow, the far side of which can be obscured depending on the angle to the source.
A somewhat stable empirical picture of the BLR is emerging from these observational studies. Each of the most often studied broad lines (H, Mg ii and C iv) shows indications that the basic geometry may be disk-like. However, the Mg ii and C iv emission lines at least (and likely H) cannot be confined completely to a disk and must have some other component to their velocity field.
1.2 Orientation and the NLR
The NLR can be observed in type 2 AGN, and many studies into the effect of orientation on NLR properties exploit this by comparing type 1 and type 2 objects. The implication being that type 1 AGN are all viewed roughly pole-on, and type 2 AGN are viewed roughly edge-on. Therefore any differences between the NLR properties in suitably matched samples of type 1s and type 2s can be attributed to orientation. We note here that this paper is concerned primarily with high luminosity QSOs and the role of luminosity on the torus in AGN and the critical angle between type 1 and type 2 is not fully known (although see Willott et al. 2000; Simpson 2005). Hence results on low-luminosity Seyferts may not directly translate to quasars.
Studies comparing the flux ratio between high and low-excitation lines indicate that type 1 AGN have a higher-ionisation NLR than type 2s (Shuder & Osterbrock, 1981; Cohen, 1983; Schmitt, 1998; Murayama & Taniguchi, 1998b). A number of interpretations for this result have been suggested. The most popular calls for a stratified NLR in which higher-excitation lines are located in a smaller region and can be hidden by the obscuring torus when viewed edge on (Murayama & Taniguchi, 1998b, a). Schmitt (1998) also argued for a second interpretation in which type 1 AGN have smaller NLRs, and hence are ionised by a stronger continuum.
Subsequent studies, either comparing the differences between type 1 and 2 spectra (Nagao et al., 2001; Zhang et al., 2008), or spatially resolving the NLR (Bennert et al., 2006b, a; Kraemer et al., 2009) tend to support a stratified NLR in which higher-excitation lines are obscured when viewed edge on. However, little work has been done in assessing the impact of orientation in large samples of type 1 quasars.


1.3 This paper
In this paper we follow on from work presented in Jarvis & McLure (2006) and use the radio spectral index as a proxy for orientation to investigate the effects of orientation on both the broad- and narrow-line region in radio-loud quasars. In Section 2 we present the sample used in this analysis, Section 3 describes the emission line analysis that is new to this work and in Section 4 we present our results and discuss them in terms of models for the broad and narrow-line regions. Throughout, this paper we assume a flat , cosmology.
2 The Sample
Both the photometric and spectroscopic optical data for this paper come from the SDSS (York, et al., 2000) data release 5 (DR5; Adelman-McCarthy, et al. 2007) quasar catalogue compiled by Schneider, et al. (2007). Details of the SDSS telescope and spectrograph are given in Gunn, et al. (2006) and Stoughton, et al. (2002).
In creating the SDSS QSO sample used in this paper, Schneider, et al. (2007) visually inspect all of the candidate spectra to determine their classification. Hence the final sample includes all broad-line SDSS spectra, combining radio and optically selected objects in amongst other broad-line objects selected under different criteria. To ensure we are not biased, we include in our sample only objects which were colour-selected as low or high-redshift QSO candidates (Richards, et al., 2002) as the BEST target. And to ensure accurate radio identification we take only those objects which lie in the Faint Images of the Radio Sky (FIRST; Becker et al. 1995) region, and have a FIRST detection (6255 objects).
This core sample was then cross matched with the WENSS catalogue (Rengelink et al., 1997) to produce 746 matches. These were then matched to the NVSS (Condon et al., 1998) for which we found all sources had a unique match.
The result is a sample of broad-line galaxies from the SDSS with WENSS and NVSS fluxes for each. Note that, while all of the WENSS detections have an NVSS detection there are many NVSS sources in the cross-matching area with no WENSS detection, due to the relative depths of the surveys. Furthermore the requirement of a broad line in the spectrum means that contamination from BL Lac objects, that may be strongly beamed in the optical, is low. In fact taking the classic broad-line equivalent width cut of 5 Å (e.g. Urry & Padovani 1995) to define BL Lacs there are none in our sample.
Fig. 2(a) shows the 330 MHz to 1.4 GHz radio spectral index distribution of our sample. In this paper we are taking radio spectral index as an orientation indicator. The objects with flatter spectral indices are considered to be viewed more pole-on than the sources with steeper radio spectra. Fig. 2(b) shows how the -band (Fukugita et al., 1996) absolute magnitude of our sample depends on radio spectral index. The correlation (a Spearman rank test gives with %) evident between and may indicate a degree of obscuration of the accretion disk in QSOs viewed from an angle away from the pole (however see Fig. 10 and discussion later in paper). Furthermore the correlation in Fig. 2(b) may be indicative of a selection bias in our sample. Since we find brighter objects have steeper spectral indexes the optical selection of the SDSS sample may bias us towards these (potentially more pole-on) sources. In the analysis that follows we will try to correct for potential luminosity bias.
3 Emission line analysis
In this paper we will compare a series of emission line parameters with radio spectral index to infer conclusions about the emitting regions. Fine, et al. (2008) and Fine et al. (2010) have already performed an analysis of all of the Mg ii and C iv line in our sample and we will use the parameters for these lines derived in those papers. In addition we will be measuring parameters of the narrow [O ii] and [O iii] lines.

[O ii] is not blended with any other emission lines and is therefore relatively straightforward to analyse. We fit a quadratic continuum between windows either side of the line and subtract it from the spectrum. The resolution of the spectra does not require us to fit the [O ii] doublet as two individual emission lines, therefore a single Gaussian is fitted to the line to define its extent. We then sum the flux in the continuum-subtracted spectrum within the FWHM of the fitted Gaussian.
[O iii] is a doublet, and can be blended with the wing of the broad H line. We fit a continuum between the extremities of the H line and subtract it from the spectrum. We then fit a double-Gaussian model to H and single Gaussians to the [O iii] and doublet fixing their relative amplitude to 1:3. The three Gaussians not pertaining to [O iii] are subtracted from the data and the flux was summed between the FWHM of the Gaussian fit to the line.
Note that this method for fitting the [O iii] lines does not always give accurate fits to the whole H region of the spectrum. Differing H profiles, continuum shapes and varying iron emission in the region all have an effect. However, out fitting method does accurately correct for contaminants to the [O iii] line. However, to make sure the results were acceptable, all fits were inspected manually and in some cases the continuum fit had to be adjusted to obtain adequate fits. An example fit is shown in Fig. 3.
4 Results
Here we compare various emission line parameters with the radio properties of our sample in order to derive conclusions about the line emitting regions in QSOs. Since the BLR and NLR differ in size by many orders of magnitude we will consider them separately.


4.1 The BLR
We are interested in how broad lines in quasar spectra are effected by orientation. In particular, previous studies have shown evidence that emission lines are broader in objects observed edge on, indicating a disk-like BLR. We are using the radio (330 MHz to 1.4 GHz) spectral index as a proxy for orientation in our sample, and in Fig. 4 we show Mg ii (a) and C iv (b) emission line widths plotted against the radio spectral index.
In each panel of Fig. 4 there is a significant amount of scatter. However, it is apparent that there is an anticorrelation between Mg ii line width and in Fig. 4(a), most evident for . A Spearman rank test on the data in Fig. 4(a) gives ( % given a random distribution). On the other hand Fig. 4(b) shows no evidence for a correlation (; ). There are fewer objects with a C iv line width measurement and we test whether this is reducing the significance of any correlation with respect to Mg ii. We resample the Mg ii line width distribution randomly to have the same number of objects as have C iv measurements and perform Spearman rank tests in each of the subsamples. In all cases we found and in 80 % of the subsamples.


To highlight how the profile of the lines depends on , Fig. 5 shows median-value (variance-weighted composites show the same results) composite spectra of the Mg ii (a) and C iv (b) line regions for objects that have (solid) and (dashed). In each figure the spectra have had a continuum subtracted between the red and blue ends of the plot, and have had their flux densities normalised to their maximum values for comparison.
The correlation in Fig. 4(a) reproduces the results of (Jarvis & McLure, 2006) and is in agreement with other studies indicating a flattened BLR for the Mg ii line. The lack of any correlation in Fig. 4(b) may be of more consequence. The indication is that the C iv BLR is, to a large extent, isotropic and unaffected by orientation effects. This is in contrast to previous studies (e.g. Vestergaard et al. 2000; Decarli et al. 2008).
4.1.1 Discussion
Our results for the Mg ii line are in line with previous results. The implication is that the Mg ii emission region has a significant velocity component in the plane of the disk, potentially orbital motions. However, while the difference between the composite spectra in Fig. 5 is highly significant, the magnitude of the difference is not huge. This indicates that a thin-disk model for the BLR is not sufficient and some other, non-planar, component to the motion is required.
We find no evidence for orientation effects in the C iv line. Previous authors have reported an effect (e.g. Vestergaard et al. 2000; Decarli et al. 2008) and we discuss the potential reasons for the discrepancy here.
Vestergaard et al. (2000) compared the radio core-to-lobe flux ratio with C iv line widths for 37 radio-loud QSOs. They found no correlation between the FWHM of the C iv line and . However, they found that line width measurements that were more weighted towards the wings of the line (the full width at 20 % maximum, and inter-percentile velocity, IPV, widths) did show a significant anti-correlation with . Given the small sample size in Vestergaard et al. (2000), and the difficulties they had in finding a correlation, it may be that their result is not robust.
Decarli et al. (2008) follow a method laid out by McLure & Dunlop (2002) in which virial SMBH mass estimates are compared to empirical mass estimates from the Magorrian relation (Magorrian, et al., 1998). The argument follows that residuals between the two mass estimates can be ascribed to orientation effects. Assuming a disk model for the BLR McLure & Dunlop (2002) derive the average correction factor for virial mass estimates ( from equation 2; note that McLure & Dunlop 2002 define as the square root of as we define it in equation 2) as a function of observed FWHM. Put simply, in their model an emission line that is observed to be narrow is more likely to be observed pole-on, and hence effected strongly by orientation, than an emission line that is observed to be broad. Hence narrower lines will, in general, have a higher value of ( in their model).
Both McLure & Dunlop (2002) and Decarli et al. (2008) find that this disk model for the BLR give good fits to the observed residuals between virial SMBH mass estimates and those from galaxy scaling relations. Furthermore, the disk model gives an improved fit compared to an isotropic model in which . However, we argue here that this is not necessarily evidence for a purely disk-like BLR.

In recent years some concern has grown up over the accuracy of virial SMBH mass estimators. In particular Fine et al. (2010) argued that there is not enough dynamic range in either Mg ii or C iv line widths for them to be useful in virial estimators given the typical uncertainty of the mass estimates. If we assume that emission line width does not help in mass estimation, and is essentially random, then narrower lines will bias mass estimates low, and broad lines will bias mass estimates high. The result, in terms of derived values for as a function of observed FWHM, is extremely similar to the disk model of McLure & Dunlop (2002). In Fig. 6 we show the best fit model from McLure & Dunlop (2002) which assumes km/s, km/s and as the solid line. We have then taken a model in which observed line widths are unrelated to the virial mass. That is, we have taken the same as McLure & Dunlop (2002) and assumed that the FWHM is independent of the virial velocity of the BLR, hence, . This relation is plotted in Fig. 6 as the dashed line. Note that our line is not a fit to data, we simply take parameters from the McLure & Dunlop (2002) fit which assumes a different model. However, the two lines show the same trend. Hence, we argue that the residuals Decarli et al. (2008) find between their SMBH mass estimates may be due more to a failing in the virial mass estimators than a disk-like BLR.
There may be some concern that the Mg ii and C iv lines occur in spectra of QSOs in differing redshift ranges, and hence different luminosity ranges. However, studies of the widths of these emission lines in large samples of QSOs have shown little-to-no dependence on luminosity or redshift (Corbett, et al., 2003; Fine, et al., 2008; Fine et al., 2010). As a further test we restrict our analysis to only those (88) objects in our sample that have both Mg ii and C iv in their spectra. Correlating the line widths of these with their radio spectral index we still find a significant correlation (; ) for Mg ii and none for (; ) C iv.
4.2 The NLR
The ratio between the flux of the [O iii] 5007 and [O ii] 3727 lines gives a measure of the ionisation level of the NLR. One of the primary drivers of this is the intrinsic luminosity of the source and in Fig. 7 we show how the ratio depends on the -band luminosity of the QSO.

Previous studies of the NLR have found that high excitation lines are emitted from a smaller region when compared to low excitation lines. Furthermore, when viewed edge-on high-excitation lines are less luminous, potentially due to absorption close to the nucleus. To test the effect of orientation on the NLR in our sample of QSOs we plot the [O iii] to [O ii] flux ratio against radio spectral index in Fig. 8(a). To check that the results are not due to luminosity bias we correct for the correlation evident in Fig. 7 by dividing the measured flux ratio by the value of the best fit relation at that magnitude. These corrected results are shown in Fig. 8(b).


At face value the correlation apparent in Fig. 8 is exactly as we expect. For flat spectrum pole-on QSOs there is less absorption of the inner high-excitation NLR and the [O iii]/[O ii] ratio is increased. However, if we look at the fluxes of [O ii] and [O iii] individually we find that the picture is more complicated. Fig. 9 shows the (a)[O ii] and (b)[O iii] line luminosities plotted against the spectral index of the QSO.


In both Fig. 9 (a) and (b) the same behaviour is observed. There is an anticorrelation between the line flux and spectral index implying that, on average, more pole-on QSOs have fainter oxygen lines. Taking as the approximate mid-point of the spectral index distribution, those objects with steep-spectra () have 1.3 times the [O iii] flux and 1.4 times the [O ii] flux compared with the flat-spectrum () objects. This is not easy to square with our interpretation of Fig. 8 above: that the reduced oxygen flux ratio for steep spectrum sources is due to absorption.
One possibility is that the flat-spectrum QSOs are intrinsically fainter in the optical, and therefore produce fewer ionising photons. While Fig. 2 shows that the observed optical magnitudes are, in fact, brighter for the flat spectrum QSOs. It may be that in the steep-spectrum QSOs, that are observed from a larger angle, may suffer from more extinction in the optical. Extinction should also redden the optical spectrum of our sample, and in Fig 10 we show the colour of our sample as a function of radio spectral index.

We find no evidence for a correlation in Fig. 10 (a Spearman rank test gives with ). Since the optical bands sample different rest wavelengths at different redshift we check that differing redshift distributions for low and high were not responsible for the lack of correlation by also measuring the optical spectral index off the SDSS spectra. This is an inherent part of our line fitting procedure and we find that, regardless of which line we measure the optical spectral index under, we find no correlation with radio spectral index. It is also worth noting that we also find no evidence for increased reddening in the flat-spectrum population, which could arise due to synchrotron emission associated with the jet.
The implication is that the QSOs in our sample that are viewed from an angle are not heavily reddened compared to those viewed pole-on. Hence we find it difficult to explain Figs. 8 and 9 through dust extinction.
Another potential explanation for Figs. 8 and 9 is with a model in which the narrow-line emitting clouds of the NLR are themselves optically thick. In this model only the surface of the clouds facing the central ionising source would be ionised and, when observed from behind, the ionised region would not be visible through the cloud. Fig. 11 shows a schematic of this model.
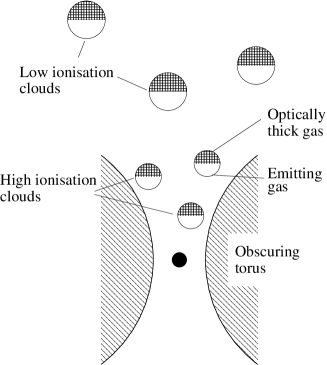
In the model presented in Fig. 11 the NLR exists on the face of optically thick clouds ionised by the central source. In the inner NLR, the radiation field is stronger, and higher ionisation lines are brighter compared to the outer NLR. When observed from an angle a large portion of the ionised surface of each cloud is visible and the lines are bright, however, the inner high-excitation NLR is obscured by the torus. When observed from the pole the inner NLR is not hidden by the torus, but we are looking through the back of the NLR clouds and see less line emission in total. This model can simultaneously explain the relation between the [O iii]/[O ii] ratio and radio spectral index, and the trend between narrow-line flux and .
4.2.1 Discussion
In the previous section we have shown that the optical narrow-line strengths of QSOs correlate with their radio spectral index that we employ as an orientation indicator. Narrow line strengths are commonly employed to estimate bolometric luminosities of AGN (Heckman et al., 2004; Simpson, 2005), as well as being extensively used in diagnostic analyses such as BPT diagrams (Baldwin et al., 1981). Here we discuss the implications of our findings with respect to these analyses.
To quantify the potential effects of orientation we split our sample by the rough midpoint of the radio spectral index distribution (). We find that the differences in average line luminosity between the low and high bins are dex and dex for [O ii] and [O iii] respectively. These values give the approximate lower bound for the effect of orientation on observed line strengths.
In fact, the effect of orientation is likely to be considerably more than quoted above since the considerable scatter in the relationship between and QSO orientation (e.g. Fig. 1) has the effect of smoothing the observed relationship. Quantifying the bias introduced through taking as a proxy for orientation is difficult due to the many unknowns. However, we can estimate the magnitude of the effect through a simple simulation.
We start by producing a rectangular radio spectral index distribution with equal probability for . We use the subscript ns to indicate that for this original distribution we are assuming there is no scatter in the –orientation relationship. We then produce an observed radio spectral index () distribution by simply adding random Gaussian noise to these values at the level found in Fig. 1 (rms). We also produce narrow-line luminosities from the s with a linear relation, including Gaussian scatter, in which the gradient, zero-point and level of scatter are varied so that the resulting –line luminosity correlation resembles those observed in Fig.9.
Splitting our simulated sample by and and comparing the average line luminosity in the low and high bins for each split we can obtain an estimate for the level of bias in the results quoted above. In the case of [O ii], where we found a 0.17 dex offset between the bins separated by , we estimate the unbiased offset to be dex. In the case of [O iii], where we found a 0.12 dex offset between the bins separated by , we estimate the unbiased offset to be dex. That is, [O ii] lines are roughly twice as strong (and [O iii] lines 1.6 times as strong) in QSOs observed from an angle, when compared with those observed pole on.
[O iii] line luminosity has been employed to estimate the bolometric luminosity of AGN, most often in type-2 objects in which the core is obscured (Heckman et al., 2004; Lamastra et al., 2009). However, the bolometric corrections must be calibrated against unobscured type-1 objects. Extrapolating our results from QSOs to type-2s, it may be that orientation effects result in the [O iii] luminosities of type-2 objects being times the value of objects observed pole-on. The result would be that bolometric luminosities estimated for these objects would be similarly overestimated, as well as Eddington ratios in the examples of Heckman et al. (2004) and Lamastra et al. (2009).
Our results also impact comparisons between [O iii] luminosity functions between type-1 and type-2 AGN (e.g. Simpson 2005; Reyes, et al. 2008), and the conclusions drawn from these comparisons. Simpson (2005) find the type-1 [O iii] luminosity function is consistently lower than the type-2 luminosity function in their sample of SDSS AGN. However, if we shift their type-1 luminosity function to higher luminosities by a factor of 1.6 we find that, for [O iii] luminosities W the type-1 luminosity function is higher than the type-2. This then impacts their estimation of the type-1/type-2 AGN fraction, increasing it significantly.
Since we find that the ratio between [O ii] and [O iii] line luminosities is also affected by orientation, it may be that the accuracy of BPT diagrams is limited by orientation effects. We find the [O ii]/[O iii] flux ratio rises by at least a factor of two with increasing . [O ii] has a comparable ionisation potential to H ii, and so we may expect similar variability in the [O iii]/H ratio: the y-axis on the standard BPT plot. Hence more pole-on sources would be biased low in standard BPT plots, making them appear more like star-forming galaxies.
4.3 BALs
The nature of broad absorption systems in QSOs is still under debate. A common model assumes that all QSOs have a BAL outflow, most likely accelerated equatorially, and only in those objects observed through the outflow do we see a BAL (e.g. Weymann et al. 1991). Spectropolametric analysis have provided evidence to back up this picture (Cohen et al., 1995; Goodrich & Miller, 1995). However, more recent studies using radio properties to gauge the viewing angle to the source have complicated the issue. Becker et al. (2000) showed that radio selected BAL quasars can display compact radio morphologies and possess both steep and flat radio spectra indicating no preferential orientation (see also Zhou et al. 2006; Doi, et al. 2009).
There are relatively few Mg ii BALs, while C iv exhibits BALs in % of objects (Trump, et al., 2006). We therefore look back at all the C iv lines in our sample and categorise them as BAL or non-BAL objects by eye. Of 240 QSOs with the C iv line in the spectrum we find 25 objects which display definite BALs and 171 which definitely do not. In the remaining 44 objects there is some indication of absorption but the S/N is such that we cannot be sure of a BAL.
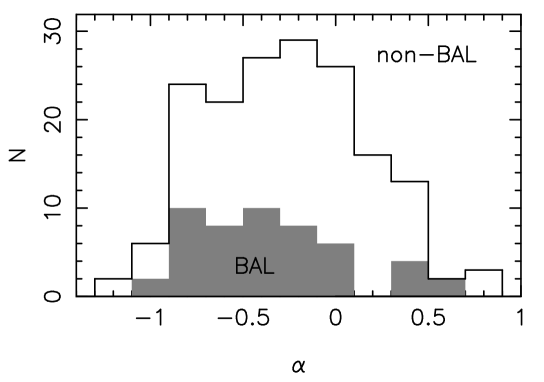
Fig. 12 shows the spectral index distributions of the definite BAL and non-BAL samples, to highlight the shape of the BAL distribution the height of the shaded histogram has been multiplied by two. We find that these distributions are not significantly different with respect to a KS test (; ), and our results are not altered if we include the objects which have indefinite BAL identifications. However, our numbers are small here and we cannot definitely say whether the orientation orientation distribution of BAL vs non-BAL objects is the same.
5 Conclusions
We use the SDSS, NVSS and WENSS to define a sample of radio-loud QSOs and measure their 330 MHz to 1.4 GHz spectral indexes. Using the radio spectral index as a proxy for orientation towards the QSOs in our sample we investigate the effect of orientation on their optical spectra.
In our sample the Mg ii line is significantly broader for objects with steep spectral indexes indicating disk-like velocities for the Mg ii BLR. However, we find no such correlation for the C iv line potentially indicating a more isotropic high-ionisation BLR.
Both the [O ii] and [O iii] narrow lines have more flux in steep spectrum sources while the [O iii]/[O ii] flux ratio is lower in these sources. To describe both of these effects we propose a simple geometric model in which the NLR exists primarily on the surface of optically thick clouds facing the active nucleus and the NLR is stratified such that higher-ionisation lines are found preferentially closer to the nucleus. We discuss the implications of our finding on analyses that employ narrow line fluxes (e.g. estimating bolometric luminosities/BPT diagrams) and show that orientation can skew results by as much as a factor of two.
We find that QSOs with flatter spectral indexes tend to be brighter. However, we find no indication of reddening in steep-spectrum QSOs to indicate dust obscuration of the accretion disk as a possible explanation, or in the flat-spectrum population which would imply contamination by synchrotron emission from the jet. Finally we find no evidence that BAL QSOs have a different spectral index distribution to non-BALS although we only have 25 obvious BALs in our sample.
6 Acknowledgements
SF would like to thank the University of Hertfordshire for support whilst this work was being undertaken. MJJ acknowledges the support of an RCUK fellowship.
Funding for the SDSS and SDSS-II has been provided by the Alfred P. Sloan Foundation, the Participating Institutions, the National Science Foundation, the U.S. Department of Energy, the National Aeronautics and Space Administration, the Japanese Monbukagakusho, the Max Planck Society, and the Higher Education Funding Council for England. The SDSS Web Site is http://www.sdss.org/.
The SDSS is managed by the Astrophysical Research Consortium for the Participating Institutions. The Participating Institutions are the American Museum of Natural History, Astrophysical Institute Potsdam, University of Basel, University of Cambridge, Case Western Reserve University, University of Chicago, Drexel University, Fermilab, the Institute for Advanced Study, the Japan Participation Group, Johns Hopkins University, the Joint Institute for Nuclear Astrophysics, the Kavli Institute for Particle Astrophysics and Cosmology, the Korean Scientist Group, the Chinese Academy of Sciences (LAMOST), Los Alamos National Laboratory, the Max-Planck-Institute for Astronomy (MPIA), the Max-Planck-Institute for Astrophysics (MPA), New Mexico State University, Ohio State University, University of Pittsburgh, University of Portsmouth, Princeton University, the United States Naval Observatory, and the University of Washington.
References
- Adelman-McCarthy, et al. (2007) Adelman-McCarthy J. K., et al., 2007, ApJS, 172, 634
- Antonucci (1993) Antonucci R., 1993, ARA&A, 31, 473
- Baldwin et al. (1981) Baldwin J. A., Phillips M. M., Terlevich R., 1981, PASP, 93, 5
- Becker et al. (2000) Becker R. H., White R. L., Gregg M. D., Brotherton M. S., Laurent-Muehleisen S. A., Arav N., 2000, ApJ, 538, 72
- Becker et al. (1995) Becker R. H., White R. L., Helfand D. J., 1995, ApJ, 450, 559
- Bennert et al. (2006a) Bennert N., Jungwiert B., Komossa S., Haas M., Chini R., 2006a, A&A, 459, 55
- Bennert et al. (2006b) Bennert N., Jungwiert B., Komossa S., Haas M., Chini R., 2006b, A&A, 456, 953
- Bentz, et al. (2010) Bentz M. C., et al., 2010, ApJ, 716, 993
- Brotherton (1996) Brotherton M. S., 1996, ApJS, 102, 1
- Cohen et al. (1995) Cohen M. H., Ogle P. M., Tran H. D., Vermeulen R. C., Miller J. S., Goodrich R. W., Martel A. R., 1995, ApJL, 448, L77+
- Cohen (1983) Cohen R. D., 1983, ApJ, 273, 489
- Condon et al. (1998) Condon J. J., Cotton W. D., Greisen E. W., Yin Q. F., Perley R. A., Taylor G. B., Broderick J. J., 1998, AJ, 115, 1693
- Corbett, et al. (2003) Corbett E. A., et al., 2003, MNRAS, 343, 705
- Decarli et al. (2008) Decarli R., Labita M., Treves A., Falomo R., 2008, MNRAS, 387, 1237
- Denney, et al. (2010) Denney K. D., et al., 2010, ArXiv e-prints
- Doi, et al. (2009) Doi A., et al., 2009, ArXiv e-prints
- Fine et al. (2010) Fine S., Croom S. M., Bland-Hawthorn J., Pimbblet K. A., Ross N. P., Schneider D. P., Shanks T., 2010, ArXiv e-prints
- Fine, et al. (2008) Fine S., et al., 2008, MNRAS, 390, 1413
- Fukugita et al. (1996) Fukugita M., Ichikawa T., Gunn J. E., Doi M., Shimasaku K., Schneider D. P., 1996, AJ, 111, 1748
- Goodrich & Miller (1995) Goodrich R. W., Miller J. S., 1995, ApJL, 448, L73+
- Gunn, et al. (2006) Gunn J. E., et al., 2006, AJ, 131, 2332
- Heckman et al. (2004) Heckman T. M., Kauffmann G., Brinchmann J., Charlot S., Tremonti C., White S. D. M., 2004, ApJ, 613, 109
- Jackson & Wall (1999) Jackson C. A., Wall J. V., 1999, MNRAS, 304, 160
- Jarvis & McLure (2002) Jarvis M. J., McLure R. J., 2002, MNRAS, 336, L38
- Jarvis & McLure (2006) Jarvis M. J., McLure R. J., 2006, MNRAS, 369, 182
- Kollatschny & Dietrich (1996) Kollatschny W., Dietrich M., 1996, A&A, 314, 43
- Kraemer et al. (2009) Kraemer S. B., Trippe M. L., Crenshaw D. M., Meléndez M., Schmitt H. R., Fischer T. C., 2009, ApJ, 698, 106
- Labita et al. (2006) Labita M., Treves A., Falomo R., Uslenghi M., 2006, MNRAS, 373, 551
- Lamastra et al. (2009) Lamastra A., Bianchi S., Matt G., Perola G. C., Barcons X., Carrera F. J., 2009, A&A, 504, 73
- Magorrian, et al. (1998) Magorrian J., et al., 1998, AJ, 115, 2285
- McLure & Dunlop (2002) McLure R. J., Dunlop J. S., 2002, MNRAS, 331, 795
- Murayama & Taniguchi (1998a) Murayama T., Taniguchi Y., 1998a, ApJL, 503, L115+
- Murayama & Taniguchi (1998b) Murayama T., Taniguchi Y., 1998b, ApJL, 497, L9+
- Nagao et al. (2001) Nagao T., Murayama T., Taniguchi Y., 2001, PASJ, 53, 629
- Onken et al. (2004) Onken C. A., Ferrarese L., Merritt D., Peterson B. M., Pogge R. W., Vestergaard M., Wandel A., 2004, ApJ, 615, 645
- Orr & Browne (1982) Orr M. J. L., Browne I. W. A., 1982, MNRAS, 200, 1067
- Osterbrock (1977) Osterbrock D. E., 1977, ApJ, 215, 733
- Peterson & Wandel (1999) Peterson B. M., Wandel A., 1999, ApJL, 521, L95
- Rengelink et al. (1997) Rengelink R. B., Tang Y., de Bruyn A. G., Miley G. K., Bremer M. N., Roettgering H. J. A., Bremer M. A. R., 1997, A&AS, 124, 259
- Reyes, et al. (2008) Reyes R., et al., 2008, AJ, 136, 2373
- Richards, et al. (2002) Richards G. T., et al., 2002, AJ, 123, 2945
- Richards, et al. (2002) Richards G. T., et al., 2002, AJ, 124, 1
- Risaliti et al. (2010) Risaliti G., Elvis M., Bianchi S., Matt G., 2010, MNRAS, 406, L20
- Schmitt (1998) Schmitt H. R., 1998, ApJ, 506, 647
- Schneider, et al. (2007) Schneider D. P., et al., 2007, AJ, 134, 102
- Shuder & Osterbrock (1981) Shuder J. M., Osterbrock D. E., 1981, ApJ, 250, 55
- Simpson (2005) Simpson C., 2005, MNRAS, 360, 565
- Stoughton, et al. (2002) Stoughton C., et al., 2002, AJ, 123, 485
- Trump, et al. (2006) Trump J. R., et al., 2006, ApJS, 165, 1
- Urry & Padovani (1995) Urry C. M., Padovani P., 1995, PASP, 107, 803
- Vestergaard et al. (2000) Vestergaard M., Wilkes B. J., Barthel P. D., 2000, ApJL, 538, L103
- Weymann et al. (1991) Weymann R. J., Morris S. L., Foltz C. B., Hewett P. C., 1991, ApJ, 373, 23
- Willott et al. (2000) Willott C. J., Rawlings S., Blundell K. M., Lacy M., 2000, MNRAS, 316, 449
- Wills & Browne (1986) Wills B. J., Browne I. W. A., 1986, ApJ, 302, 56
- Wilman, et al. (2008) Wilman R. J., et al., 2008, MNRAS, 388, 1335
- York, et al. (2000) York D. G., et al., 2000, AJ, 120, 1579
- Zhang et al. (2008) Zhang K., Wang T., Dong X., Lu H., 2008, ApJL, 685, L109
- Zhou et al. (2006) Zhou H., Wang T., Wang H., Wang J., Yuan W., Lu Y., 2006, ApJ, 639, 716