High-field electron spin resonance spectroscopy study of GdO1-xFxFeAs superconductors
Abstract
We report a detailed investigation of GdO1-xFxFeAs (, and ) samples by means of high-field/high-frequency electron spin resonance (HF-ESR) together with measurements of thermodynamic and transport properties. The parent GdOFeAs compound exhibits Fe long-range magnetic order below 128 K, whereas both doped samples do not show such order and are superconducting with K () and K (). The Gd3+ HF-ESR reveals an appreciable exchange coupling between Gd and Fe moments, through which the static magnetic order is clearly seen in the parent compound. Owing to this coupling, HF-ESR can probe sensitively the evolution of the magnetism in the FeAs planes upon F doping. It is found that in both superconducting samples, where the Fe long-range order is absent, there are short-range, static on the ESR time scale magnetic correlations between Fe spins. Their occurrence on a large doping scale may be indicative of the ground states’ coexistence.
I Introduction
Iron-pnictide superconductorsKamihara et al. (2008) with superconducting critical temperatures up to 55 KChen et al. (2008); Drew et al. (2009); Hess et al. (2009) have attracted a huge interest due to striking similarities to superconducting cuprates as well as due to their original properties. Indeed, most families of these layered materials feature an antiferromagnetically (AFM) ordered parent compound, and the evolution of superconductivity concomitantly with suppression of AFM order upon doping. However there are important differences which render the Fe-pnictides a separate new class of superconducting materials. Most striking of them are semi-metallicity and the spin density wave (SDW) character of the AFM order in the undoped pnictides contrasted with the Mott-insulating AFM state in the cuprates, as well as a multi-band versus single-band electronic structure in the Fe-pnictide and cuprate high-temperature superconductors, respectively.
Beyond study of the superconducting ground state, and of the magnetic and associated structural transitions seen in the parent compound, much attention has been devoted to the issue of the ground states’ coexistence. Discrepancies on this issue have been found between different familiesDrew et al. (2009); Luetkens et al. (2009); Zhao et al. (2008); Sanna et al. (2010); Julien et al. (2009); Laplace et al. (2009); Urbano et al. (2010); Carlo et al. (2009), with the variation of the boundary of the two ground states and different length scales of coexistence, especially in the so-called 1111 family. In this family, which has the composition OFe ( - rare earth, - pnictide), the superconductivity evolves with the substitution of fluorine for oxygen. Here, replacement of one rare earth element with another can cause a significant variation of properties. Whereas in La-based superconducting samples there is evidence against static magnetic order in the FeAs planesLuetkens et al. (2009), in the case of superconducting samples based on different magnetic rare earths ( Sm, Nd, Ce) evidence of remanent static magnetism is found Drew et al. (2009); Carlo et al. (2009). The situation appears complicated due to the fact that the magnetism then tends to be of a short-range order or disordered, possibly even dynamicBernhard et al. (2009), which calls for the use of local probe techniques. These two different pictures complicate the establishment of the unified phase diagram for 1111 pnictides, necessary for the full understanding of these materials. In addition, as was shown by NMRNakai et al. (2008); Prando et al. (2010) and SRMaeter et al. (2009) studies, there is a magnetic coupling between 4 (Ce, Pr and Sm) and 3 (Fe) moments. Such coupling of the rare earth to the FeAs plane might give an additional contribution to the difference in physical properties of different 1111-type superconductors.
In the present work we investigate the evolution of the magnetism upon fluorine doping in Gd-based 1111 compound by means of high field/high frequency electron spin resonance (HF-ESR) complemented with measurements of thermodynamic and transport properties. The ESR data reveal a significant exchange coupling of Gd- and Fe-moments in the parent GdOFeAs sample which enables the Gd3+ HF-ESR to probe sensitively the formation of the static SDW magnetic order in the FeAs planes. Interestingly, it is found that the signatures of such an order are still observed in the ESR spectra after doping. In particular, though long-range SDW order present at very low doping is suppressed at doping levels where superconductivity appears, our results imply static on the ESR time scale, likely short-range, magnetic correlations between Fe spins. This result suggests that GdO1-xFxFeAs compounds may feature coexistence of quasi-static magnetism and superconductivity on a large doping range.
II Experimental
II.1 Setups
The magnetization has been studied by means of a commercial SQUID magnetometer (MPMS-XL5, Quantum Design). For the thermal expansion measurements a capacitance dilatometer was utilized, which allows a very accurate study of crystal length changes. We measured the macroscopic length changes of polycrystalline samples. The linear thermal expansion coefficient was calculated as the first temperature derivative of , while the volume thermal expansion coefficient is given by for our polycrystalline samples. The specific heat was studied in a Quantum Design PPMS calorimeter by means of a relaxation technique. In the electrical transport experiments the samples were investigated by four-probe measurements using an alternating DC-current. The ESR measurements at a frequency of GHz were carried out in a standard Bruker EMX system. The HF-ESR experiments were performed with a home-made spectrometer Golze et al. (2006) at frequencies GHz and magnetic fields T. All ESR measurements were made in a temperature range of K.
II.2 Sample preparation
The polycrystalline samples GdO1-xFxFeAs ( nominal content) were prepared by two different routes. Route 1, which is similar to that described in Ref. [Kondrat et al., 2009], starts with FeAs, Gd, Gd2O3 and GdF3 in a stoichiometric ratio. All materials were homogenized by grinding in a mortar. Route 2 uses GdAs, Fe, Fe2O3 and FeF3 as starting materials in a stoichiometric ratio. Here, the starting materials were homogenized by grinding in a ball mill. In either case, the resulting powders were pressed into pellets under Ar atmosphere, and subsequently annealed in an evacuated quartz tube either in a two step synthesis at 940∘C for 12 h and at 1150∘C for 48 h (60 h) or in a one step synthesis at 940∘C for 168 h. In order to confirm the single phase character of the polycrystals, powder x-ray diffraction was performed on a Rigaku diffractometer (Cu -radiation, graphite monochromator). The samples were either phase pure or contained insignificantly small amounts of GdAs, GdOF, and Fe3O4. The microstructure and the composition were examined by scanning electron microscopy (SEM, XL30 Philipps, IN400) equipped with an electron microprobe analyzer for semi-quantitative elemental analysis using the wave length dispersive x-ray (WDX) mode. The analysis showed that the sample with (nominal content) in fact contains of F and contains of F. Further on, we will use the doping levels obtained by WDX in order to label the samples.
For the -axis alignment of the parent GdOFeAs sample, which was synthesized under high pressureZhigadlo et al. (2008), the powder was mixed with epoxy resin and hardened while rotating in a magnetic field of T. The x-ray diffraction data of the aligned powder samples were collected at room temperature using a PANalytical X’Pert PRO system (Philips) with Co -radiation (Fig. 1). The presence of highly intense [00l] reflections (Fig. 1, arrows) which dominate the pattern points to a sufficiently good quality of the alignment. Reflections with Miller indices different from [00l] (Fig. 1, asterisks) are visible in the background, too, but their intensity is strongly suppressed compared to the powder pattern.

III Thermodynamic and transport measurements
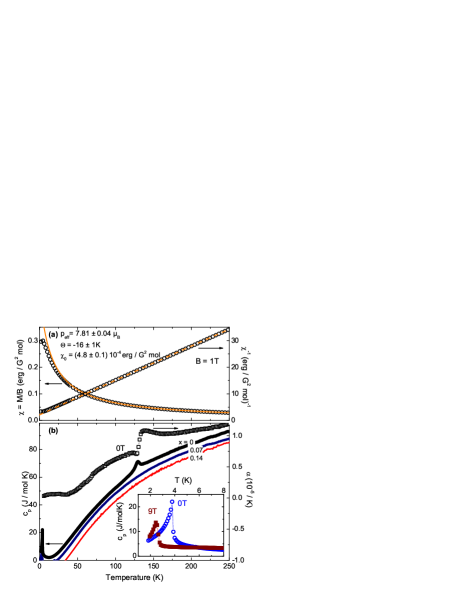
In Fig. 2(a), the temperature dependence of the static susceptibility of GdOFeAs is presented. As () is dominated by the response of the Gd moments, the results are very similar for the F-doped samples, which are not shown. In general, the data obey the Curie-Weiss law which is expected due to the presence of paramagnetic Gd3+ ions. Note that the response of the FeAs-layers which is e.g. visible in LaOFeAs is about 3 orders of magnitude smaller and hence masked by the magnetism of the rare earth ions. Klingeler et al. (2010) The linear temperature dependence of the inverse susceptibility demonstrates the Curie-Weiss-like behavior. Analyzing the data in terms of the Curie-Weiss-law yields the antiferromagnetic Weiss temperature K and the effective magnetic moments which is close to the magnetic moment of a free Gd3+ ion ( ). At a low temperature of about K there is a kink of the magnetization due to the AFM ordering of the Gd moments.
While the structural and Fe magnetic phase transitions are not visible in the magnetization data, there are pronounced anomalies in the specific heat and the thermal expansion coefficient (Fig. 2(b)) in the case of the parent GdOFeAs sample. There is one broad feature visible in the specific heat data. In contrast, the thermal expansion coefficient exhibits two huge anomalies with opposite sign which can be attributed to the structural and SDW transitions of the compound at K and K. In addition, the specific heat data reveal a sharp anomaly at = 3.8 K which is associated with the onset of long range antiferromagnetic order of the Gd moments, in accord with the magnetization data. Note that the anomaly is not present in our thermal expansion data due to the restricted temperature range K. Upon application of external magnetic fields, Gd order is strongly suppressed as shown in Fig. 2 (inset in the lower panel). is shifted to 2.5 K in an external magnetic field of T. While anomalies associated with Gd-ordering are still observed in the specific heat data of the F-doped samples with and , there are no visible anomalies at higher temperatures (Fig. 2(b)). This evidences the absence of long-range SDW order in the doped, superconducting samples.
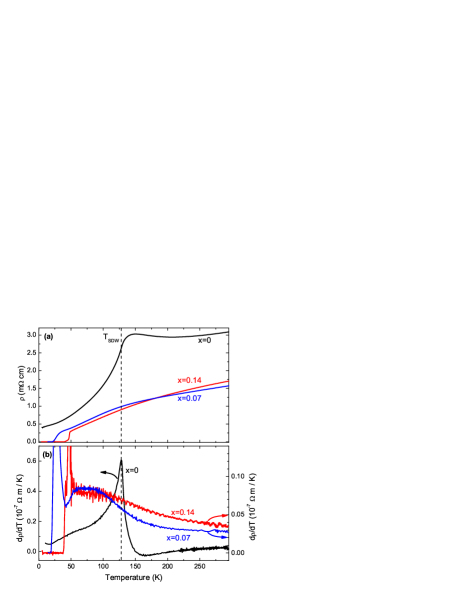
Fig. 3(a) shows the temperature dependence of the electrical resistivity of the GdO1-xFxFeAs samples for all three doping levels: , 0.07 and 0.14. To get a better insight into the data we present the temperature derivatives in the bottom panel (Fig. 3(b)). The resistivity of the undoped material exhibits features closely connected to the structural and magnetic phase transitions: a maximum close to TST and an inflection point at T K, which are characteristic for all the 1111 parent compoundsHess et al. (2009); Klauss et al. (2008); Kondrat et al. (2009). With doping, the electrical resistivity drastically changes its behavior, superconductivity emerges at low temperature and the intermediate temperature maximum disappears. The SC temperatures Tc for and samples amount to K and K, respectively. No pronounced features of the SDW phase are present in these compounds in the whole investigated temperature range. However, the normal state behavior of for is very unusual. At high temperatures the resistivity is linear down to approx K, then it develops a curvature and drops below the linear approximation of the high temperature part. With decreasing temperature further, becomes linear again and develops a slight opposite curvature at K, prior to the onset of superconductivity. Upon increasing the F doping level in the samples, namely to , this anomaly becomes weaker. A similar drop of at K as found here has previously been observed for other 1111-type pnictide superconductors Hess et al. (2009); Kondrat et al. (2009); Zhigadlo et al. (2010) as well as for Ba1-xKxFe2As2 Rotter et al. (2008); Koitzsch et al. (2009). The qualitative resemblance to the sharp drop at which is observed in the respective parent compounds suggests that the resistivity drop in the superconducting samples is indicative of remnants of the SDW phase. In fact, a recent study of the Nernst effect on LaO1-xFxFeAs provides strong evidence that precursors of the SDW phase develop in the vicinity of the resistivity anomaly despite the absence of static magnetism Kondrat et al. (2010).
IV Electron Spin Resonance, results and discussion
IV.1 GdOFeAs, 9.6 GHz X-band measurements
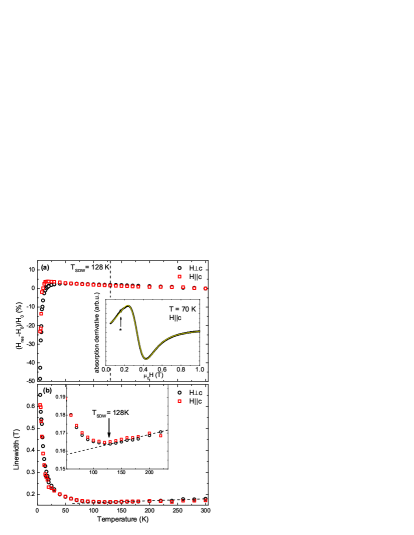
The ESR measurements performed at a frequency of GHz on the -axis aligned GdOFeAs sample in the whole temperature range of study and for both sample orientations ( or ) reveal one broad line with the -factor (Fig. 4(a), inset). Such ESR response is typical for the systems where Gd3+ ions occupy regular positions in the crystal lattice with short distances between neighboring ionsBarnes (1981). The Gd3+ is an S-state ion with a half-filled shell which yields an isotropic -factor equal to 2 and a spin value of 7/2. The rather big spin value leads to strong magnetic dipole-dipole interactions which together with the unresolved fine structure broaden the ESR line. This broadening mechanism should lead to a gaussian line shape which is however not observed in the spectra. Instead, the lorentzian111Note here that a dysonian ESR line shape, which is typical for metallic samples in a cavity, is not observed here due to the fine grinding of the sample and further mixing with epoxy. This procedure reduces the microwave dispersion which is the origin of the dysonian line shape. function had to be used to fit the spectra (thin line in the inset in Fig. 4(a)) in order to obtain accurate values of the resonance field () and the linewidth. The lorentzian shape suggests that homogeneous narrowing of the line does take place, which can be caused by isotropic exchange interaction between Gd spinsAbragam and Bleaney (1970); Barnes (1981). The temperature dependencies of and the linewidth are shown on Fig. 4(a),(b). With lowering the temperature no drastic changes are seen in down to K where there is a strong shift of the line due to the ordering of Gd moments (Fig. 4(a)). The linewidth, in contrast to the resonance field, shows clear change in the behavior at K for both sample orientations (Fig. 4(b)). At temperatures above TSDW there is a gradual decrease of the width of the ESR line upon cooling. This can be attributed to a Korringa-like behavior, with the linewidth having a linear in contribution due to the relaxation of the Gd spins through interaction with the conduction electrons, similar to EuFe2As2Dengler et al. (2010). The slope value amounts to T/K which is one order of magnitude smaller than that in EuFe2As2. A strong broadening of the line below TSDW can be attributed to the formation of the SDW state in the FeAs layers. Similar effects in the Gd3+ ESR linewidth were observed before in the case of Gd2BaCuO5 samples where exchange coupling of Gd- and Cu-moments enabled to probe by means of Gd3+ ESR the magnetic ordering of the Cu layersGoya et al. (1996) (see the discussion below).
IV.2 GdOFeAs, high-frequency/field measurements
In the measurements performed at 9.6 GHz, the linewidth of the Gd3+ ESR signal is comparable to its resonance field. This leads to complications in the spectra analysis and to a lack of resolution. In order to improve the spectral resolution we performed high-frequency/field measurements on GdOFeAs samples. The high-temperature ESR spectra of the non-oriented GdOFeAs powder sample measured at a frequency of 328 GHz (Fig. 5(a)) consist of a single broad lorentzian-shaped line with a -factor of and a linewidth of T, similar to the low-frequency measurements. However, the very small Korringa contribution detected in the low frequency measurements is not visible in the HF-ESR spectra (Fig. 9a). The low-temperature HF-ESR spectra exhibit an inhomogeneously broadened shape which is in contrast to X-band data. As a measure of this broadening the full width at the half maximum (FWHM) of the signal has been taken (see Fig. 9(a)). As can be seen, with decreasing the temperature there is only a weak broadening of the signal down to a characteristic temperature K ( denotes an internal field at the Gd ion, see the discussion below) where substantial inhomogeneous broadening begins to develop continuously down to the lowest measured temperature of K.
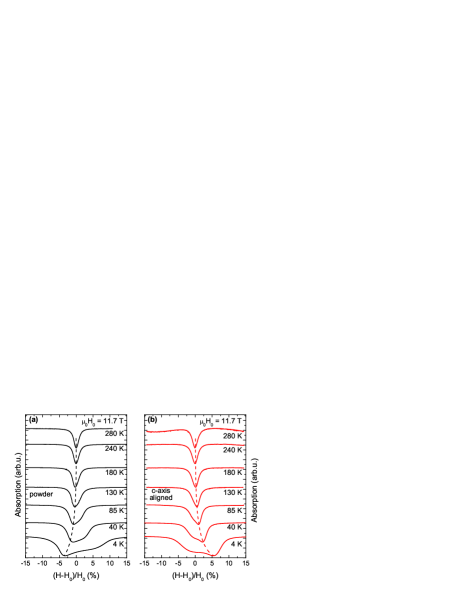
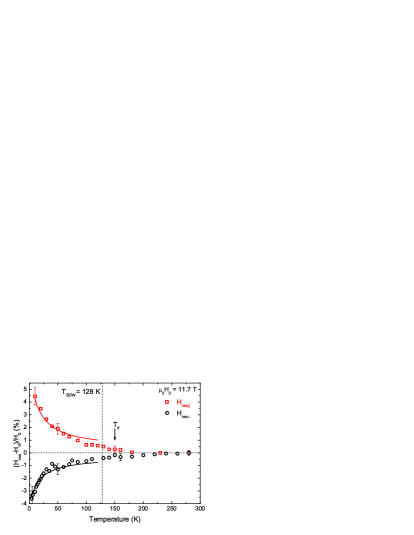
Concomitantly with the inhomogeneous broadening there is a noticeable shift of the minimum of the absorption to lower fields, as shown on Fig. 6 (open circles) on a reduced field scale . Here T is the resonance field of the signal at high temperature. The spectral shape at low temperature (Fig. 5(a)) appears to be very similar to the shape of the ESR signal from a powder sample with an anisotropic -factor. However, since the Gd3+ ion is a pure S-state ion, it should have an isotropic -factor very close to 2. Hence one can conjecture that the shape of the ESR signal from the GdOFeAs sample is caused by the anisotropy of the internal field at the Gd site arising from the AFM-ordered Fe moments. In such an anisotropic powder situation most of the spectral weight is coming from the grains whose -axes are oriented perpendicular to the direction of the external field . One should note here that in the case of in-plane anisotropy there will be an additional averaging effect due to the distribution of resonance fields of grains whose ()-planes are parallel to . Therefore we assume here that the low-field minimum of the absorption corresponds to the mean value of the resonance field of the Gd3+ ESR response () in the case of the external field applied perpendicular to the -axis. Correspondingly, the high-field shoulder of the spectra arises from grains whose -axes make small angles with respect to .
In order to probe the Gd3+ response for the geometry we have performed ESR measurements on the -axis oriented GdOFeAs powder sample. Though, according to the x-ray diffraction analysis, the alignment of the powder particles was not perfect, a substantial -axis texturing of the sample has been achieved (Fig. 1). Similarly to the non-oriented powder sample, the -axis oriented sample at temperatures above K exhibits only a small broadening of the ESR spectrum with decreasing temperature (Fig. 5(b)). Below this temperature the signal experiences strong inhomogeneous broadening where most of the spectral weight is shifted to higher fields, which is opposite to the finding in the non-oriented powder sample. In the oriented sample most of the spectral weight and, consequently, the minimum of the absorption should correspond to the resonance field of the Gd3+ ESR response () in the geometry whereas a non-ideal powder alignment yields the low-field shoulder of the ESR signal.
From our measurements on non-oriented and -axis oriented powder samples one can, therefore, extract the temperature dependencies of in two configurations, i.e., for fields aligned along the -axis () and in the ()-plane (), as summarized in Fig. 6. As can be seen, the changes of both resonance fields and start upon cooling at K and the shifts have opposite directions.
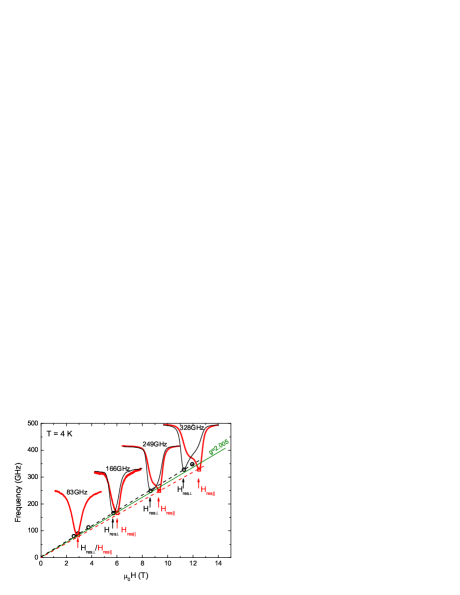
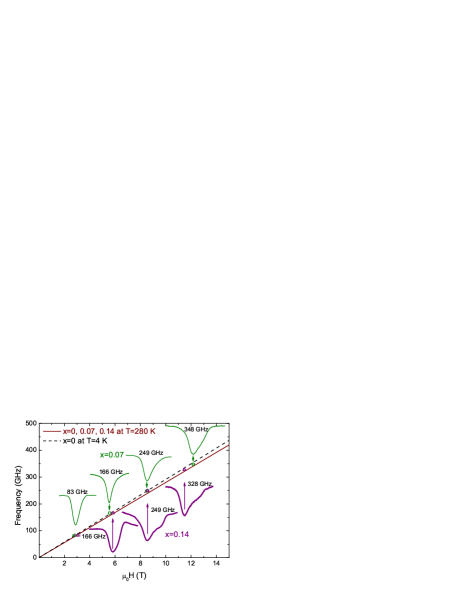
The qualitative difference in the high-field/frequency and low-field/frequency measurements leads to the conclusion that the shift of the resonance field and the inhomogeneous broadening of the spectra measured at a frequency of 328 GHz is a field-induced effect. To investigate it, we have measured the frequency versus magnetic field dependence of the GdOFeAs powder and the -axis aligned samples, respectively, both at K and K (Fig. 7). At K the spectrum at all studied frequencies and fields consists of a single lorentzian line with the same linewidth value. A linear dependence has been revealed yielding a -factor equal to 2.005 (straight solid line on Fig. 7). The spectra at K for the non-oriented powder (thin line) and -axis oriented powder (thick line) samples at different frequencies together with the frequency dependence of the resonance fields and are shown on Fig. 7 as well. This measurement reveals that the difference between and increases linearly with increasing the frequency and the field strength.
IV.3 GdOFeAs, discussion
Since the inhomogeneous broadening and the shift of the Gd ESR signal set in close to the SDW ordering temperature, one can associate them with the interaction of the Fe ordered moments with the Gd spins. The shifts of and from a common high-temperature paramagnetic value can hence be related to the occurrence of an internal magnetic field ( and ) at the Gd site due to the formation of the static SDW in the FeAs layer. Based on the dependence shown on Fig. 7 we can conclude that the strength of these internal fields depends on the strength of the applied magnetic field.
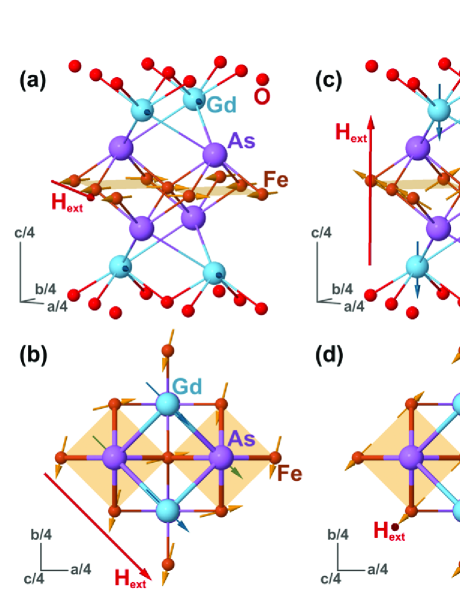
When the FeAs planes are in the paramagnetic state, at temperatures above K, the exchange/dipolar field at the Gd position is negligible as the applied magnetic field cannot effectively polarize small paramagnetic moments at elevated temperatures. At temperatures below K the Fe moments order statically in the ()-plane. The AFM structure of the magnetic order, which is similar for all -based 1111-type pnictides can be found in Ref. Maeter et al., 2009. Due to symmetry reasons, without an applied magnetic field the internal field at the Gd site can be only of dipolar nature and in this case according to an estimate it should not exceed T. We suggest that application of an external magnetic field induces tilting of the Fe spins and hence creates an uncompensated magnetic moment () in the direction of the external field222For simplicity which does not affect the conclusions of the following qualitative discussion, we assume hereafter that the uncompensated magnetic moments and thereby created internal fields are collinear with the applied magnetic field.. This moment can interact with the Gd3+ spins which would effectively lead to the occurrence of an additional internal field. If , then the Fe spins tilt in the plane as it is schematically shown on Fig. 8(a,b) for the configuration where makes an angle of with the AFM ordered Fe spins. The shift of the ESR line , measured at 328 GHz, yields an estimate of the internal field () of about T parallel both to and to the uncompensated moment in the FeAs plane. If , then the Fe moments tilt out of the plane (Fig. 8(c,d)). In this case the shift of the ESR line, measured at 328 GHz, yields an estimate of the internal field () of about T antiparallel both to the and to the uncompensated moment . One should note here that an estimate of the dipolar field produced by the FeAs layers at the Gd site yields a value which does not exceed T even for full out-of-plane canting. This field is one order of magnitude smaller than the experimentally observed value which clearly implies the presence of an appreciable exchange interaction between Gd and canted Fe moments. The dependence of the sign of the internal field on the direction of the applied magnetic field suggests that the sign of the exchange interaction with Gd spins is different for different directions of the uncompensated Fe moments, i.e., ferromagnetic for the in-plane and antiferromagnetic for the out-of-plane directions. This surprisingly strong anisotropy of the exchange might be related with the multiband electronic structure of iron pnictides which might give rise to different pathways for interactions between the Gd 4 orbitals and the in-plane and out-of-plane and Fe 3 bands. Note that, in zero magnetic field and hence without Fe spin canting (), the exchange interaction between Fe and Gd moments of an arbitrary sign is geometrically frustrated (see Fig. 8). The application of a field which tilts the Fe moments thus removes this frustration.
Considering the exchange interaction, one might suppose that the temperature dependence of the internal field at the Gd site should follow the behavior of the SDW order parameter in 1111 compoundsMaeter et al. (2009); Luetkens et al. (2009); de la Cruz et al. (2008), which increases fast within K starting at TSDW and then stays almost constant with further decreasing the temperature. Here, the internal field acting on the Gd3+ moments arises at a temperature K which is K higher than K and keeps increasing upon cooling till the lowest measured temperature (see Fig. 6). When approaching the temperature of the SDW transition from high temperatures, the appearance of the internal field well above TSDW can be explained by growing quasi-static correlations between the Fe moments seen in the time window of the high-frequency ESR. The development of the internal field below TSDW is found to be similar to that of some other systems where paramagnetic ions are coupled to magnetically-ordered moments of another type Fainstein et al. (1994); Oseroff et al. (1990). To explain this evolution of the internal field we use a simple model based on a mean-field approximationKittel (2005); Barnes (1981) (for details see Appendix). According to this model the internal field depends on the applied magnetic field and on temperature as following (see Eq. 5):
Here is a parameter determined by the Gd-Fe exchange coupling energy , by the susceptibility of the ordered Fe moments to the applied field and by the Gd Curie constant . As can be seen, this dependence qualitatively obeys a Curie-Weiss law at a given applied field which agrees well with the measured data. The model enables to fit the experimental data points reasonably well (see Appendix and Fig. 6). Firstly, the fit yields an estimate of the energy of the exchange coupling between Gd and Fe spins which is in the range of K. Secondly, it shows that the magnitude of the uncompensated Fe moment depends on the Gd magnetization which suggests that the Gd subsystem additionally tilts or polarizes the SDW.
To summarize this part, the ESR results on GdOFeAs samples show that the Gd subsystem is exchange-coupled to the magnetic FeAs planes. On approaching the AFM SDW transition from above, the growing correlations between the Fe moments yield a shift of the Gd ESR line. At lower temperature, depending on the angle between and the -axis of the sample, the signal shifts to higher or to lower fields due to the uncompensated exchange field which is transferred to the Gd site from the Fe moments canted in an external magnetic field. Since the full width at the half maximum is proportional to the difference between resonance fields , then the width of the ESR signal of the non-oriented powder sample can be taken as a measure of this exchange field (Fig. 9a).
IV.4 GdO1-xFxFeAs (, )
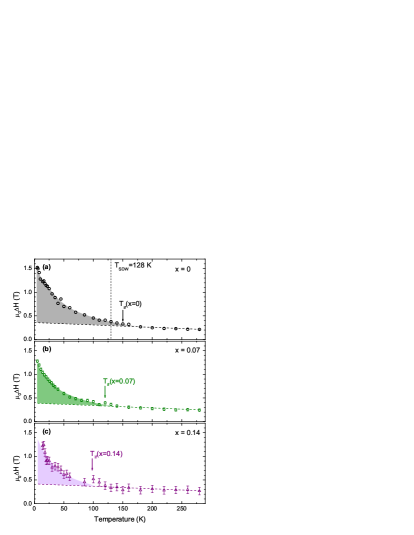
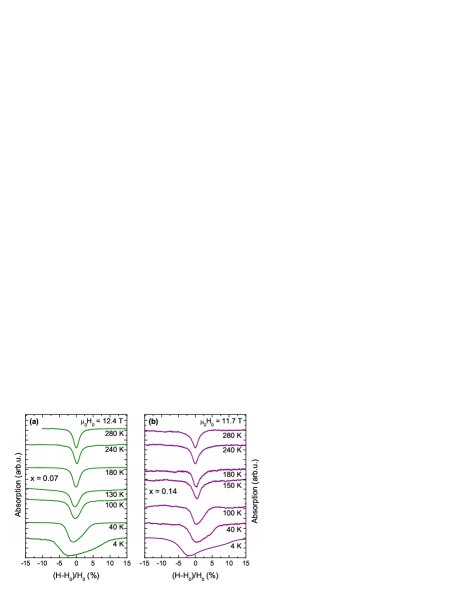
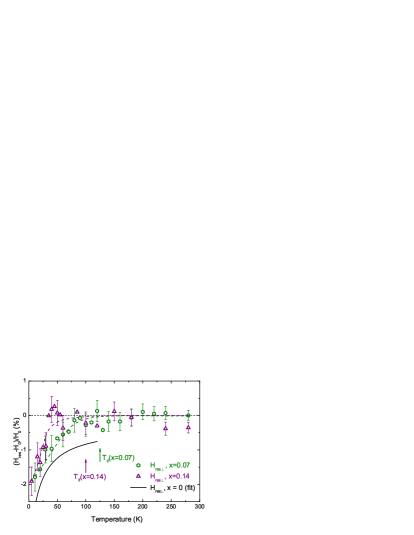
The influence of the fluorine doping on the Gd ESR has been studied on two powder samples of GdO1-xFxFeAs with 7% and 14% of fluorine. On Fig. 10(a),(b) the evolution of the respective Gd3+ ESR spectra is shown on a reduced field scale. Similarly to the undoped sample, at high temperature the ESR spectrum for both doped samples consists of a single lorentzian-shaped line with . While lowering the temperature, the line remains almost unchanged until a characteristic temperature Tif is reached. This temperature corresponds to the onset of an additional inhomogeneous contribution to the width of the ESR signal . This inhomogeneous contribution is shown by the shaded area on Fig. 9(b,c). The temperature Tif clearly depends on the fluorine doping level. In the case of the 7% F-doped sample a noticeable broadening of the line starts at Tif K, whereas for the 14% doped sample it starts at a lower temperature Tif K. For both doped samples there is a shift of the minimum of the absorption () to lower magnetic fields below Tif (Fig. 11). Qualitatively this shift is similar to that of the undoped sample (solid line on Fig. 11), but it is less pronounced. In addition, the inhomogeneous broadening and the shift of to lower magnetic fields exhibit a magnetic field dependence similar to that of the undoped GdOFeAs sample (Fig. 12).
IV.5 Superconducting GdO1-xFxFeAs, discussion
The remarkable similarities of the Gd ESR behavior between the fluorine-doped samples and the undoped one strongly suggest that, even in the superconducting samples where the phase transition to the AFM SDW state is not observed in the thermodynamics and transport properties, quasi static (on the time scale of the ESR measurement) magnetic correlations in the FeAs planes are present below the characteristic temperature Tif. Such correlations may explain the peculiar features in the resistivity data shown in Sec. III.
The unified phase diagram for the iron pnictides, especially for the 1111 materials, is not fully established so far since the issue of coexistence of superconductivity and magnetism remains controversial. The nonmagnetic rare earth based LaO1-xFxFeAs material exhibits no evidence for the presence of a static magnetic order for any superconducting composition, but rather reveals SDW-like spin fluctuations seen in the transportKondrat et al. (2010) and inelastic neutron scattering experimentsShamoto et al. (2009); Wakimoto et al. (2010). On the other hand, the magnetic rare earth based systems (Sm, Nd, Ce) studied so far demonstrate coexistence of superconductivity and static magnetism at least in the underdoped regionDrew et al. (2009); Carlo et al. (2009). Our high-field ESR results show that there is yet another 1111 system comprising a strongly magnetic rare earth (Gd) subsystem where the coexistence of quasi-static magnetism and superconductivity is still visible in large doping range. Here, the increase of the fluorine content and correspondingly the rise of Tc leads to the suppression of magnetic correlations indicating a possible interplay between these two states. All this suggests that the coexistence and possible interplay of the static or quasi-static magnetism and superconductivity may be a generic property of 1111-type compounds. In this regard, a remaining question yet to be answered is the extent to which the -Fe magnetic interaction influences the magnetic correlations in the FeAs planes. Moreover, the issue of the coexistence of magnetism and superconductivity is frequently discussed in the literature for other pnictide families as well. Extending ESR experiments to compounds of these families would be of great interest.
V Conclusion
Our HF-ESR study of polycrystalline samples of the GdO1-xFxFeAs superconductor reveals a magnetic coupling between the Gd subsystem and the FeAs layers. This coupling, most probably of the anisotropic exchange type, is visible in the Gd ESR response in the undoped GdOFeAs in the SDW state, in form of a field-induced inhomogeneous broadening and shift of the ESR spectrum. This effect is caused by the interaction of the Gd spins with the uncompensated Fe moments due to the canting of the Fe moments in magnetic field. Furthermore, the data suggest that the Gd moments additionally tilt the ordered Fe moments. Surprisingly, the broadening and the shift of the spectrum are present also in the doped superconducting samples where there is no evidence of long range magnetic order. This points to the presence of short range, static on the ESR time scale, magnetic correlations. This may be relevant to the interplay of magnetism and superconductivity in these materials, where on doping with fluorine there is a simultaneous increase of the superconducting critical temperature and suppression of the magnetic correlations. The possible relevance of the exchange interaction between the magnetic rare-earth subsystem and the FeAs planes to the properties of this novel class of superconductors remains to be elucidated.
Acknowledgements.
We thank S. Müller-Litvanyi, R. Müller, J. Werner, and S. Pichl for assistance in the sample preparation. We thank U. Stockert and J. E. Hamann-Borrero for assistance in the sample characterization. The work at the IFW Dresden was supported by the Deutsche Forschungsgemeinschaft through Grants No. BE1749/12 and BE1749/13, the Research Unit FOR538 (Grant No. BU887/4) and the Priority Programme SPP1458 (Grant No. GR3330/2). Work at the ETH was supported by the Swiss National Science Foundation through the National Center of Competence in Research MaNEP (Materials with Novel Electronic Properties).*
Appendix A
Here we provide a calculation of the internal field on the Gd ion using a simple model based on the mean-field approximationKittel (2005); Barnes (1981). To simplify the calculations we assume that a magnetic field and magnetic moment vectors are collinear. In this model, the internal field at the Gd site is proportional to the magnitude of the uncompensated Fe moment with a coefficient :
| (1) |
Hereafter the sign depends on the type of interaction, being ”” for ferromagnetic and ”” for antiferromagnetic exchange. Neglecting the weak dipolar contribution, the magnetization normalized to the single ion of the Gd subsystem is proportional to the sum of the applied magnetic field and internal field :
| (2) |
where is the Gd magnetic susceptibility, is the Gd Curie constant, is the Gd Curie temperature. Due to the exchange interaction, the uncompensated magnetic moment is proportional not only to the applied field but also to the internal field created by the Gd moments:
| (3) |
Here is the susceptibility of the ordered Fe moments to the external magnetic field. Using Eq. 1, Eq. 2 and Eq. 3 one can obtain the equation for the internal field at the Gd site:
| (4) |
Eq. 4 enables to fit the measured temperature dependence of the internal field (see Fig. 6). The resonance field of the Gd is determined by the applied field and by the internal field . At high temperatures when there is no internal field at the Gd site at any strength of the applied magnetic field () one can measure the resonance field T (for measurement frequency GHz). Assuming that the resonance field of the Gd ions T stays constant at all measured temperatures one obtains the expression for the applied field ( T). The fit for two measurement configurations ( and ) is shown on Fig. 6 by solid lines. The parameters , and can be taken from different experiments. The Gd Curie constant and Curie temperature are known from the susceptibility data of GdOFeAs samples (see Sec. III). As it is shown in Ref. Klingeler et al., 2010 the bulk Fe susceptibility of LaOFeAs samples is determined by the spin susceptibility. Therefore the parameter can be estimated from this measurement yielding a value of Klingeler et al. (2010); McGuire et al. (2008); Nomura et al. (2008); Kohama et al. (2008). The value resulting from the fit is equal to for and for . According to the mean field theoryKittel (2005), these values yield an estimate of the exchange interaction energy for two configurations amounting to K for and K for . In addition, Eq. 1 enables to calculate the uncompensated moment . Its value grows with decreasing the temperature and increasing the Gd susceptibility until it reaches at the lowest measured temperature.
Since is very small compared to and , Eq. 4 can be simplified to the form:
| (5) |
References
- Kamihara et al. (2008) Y. Kamihara, T. Watanabe, M. Hirano, and H. Hosono, J. Am. Chem. Soc. 130, 3296–3297 (2008).
- Chen et al. (2008) X. H. Chen, T. Wu, G. Wu, R. H. Liu, H. Chen, and D. F. Fang, Nature 453, 761 (2008).
- Drew et al. (2009) A. J. Drew, C. Niedermayer, P. J. Baker, F. L. Pratt, S. J. Blundell, T. Lancaster, R. H. Liu, G. Wu, X. H. Chen, I. Watanabe, et al., Nat. Mater. 8, 310 (2009).
- Hess et al. (2009) C. Hess, A. Kondrat, A. Narduzzo, J. E. Hamann-Borrero, R. Klingeler, J. Werner, G. Behr, and B. Büchner, EPL (Europhysics Letters) 87, 17005 (2009).
- Zhao et al. (2008) J. Zhao, Q. Huang, C. de la Cruz, S. Li, J. W. Lynn, Y. Chen, M. A. Green, G. F. Chen, G. Li, Z. Li, et al., Nat. Mater. 7, 953 (2008).
- Luetkens et al. (2009) H. Luetkens, H.-H. Klauss, M. Kraken, F. J. Litterst, T. Dellmann, R. Klingeler, C. Hess, R. Khasanov, A. Amato, C. Baines, et al., Nat. Mater. 8, 305 (2009).
- Laplace et al. (2009) Y. Laplace, J. Bobroff, F. Rullier-Albenque, D. Colson, and A. Forget, Phys. Rev. B 80, 140501 (2009).
- Julien et al. (2009) M.-H. Julien, H. Mayaffre, M. Horvatic, C. Berthier, X. D. Zhang, W. Wu, G. F. Chen, N. L. Wang, and J. L. Luo, EPL (Europhysics Letters) 87, 37001 (5pp) (2009).
- Sanna et al. (2010) S. Sanna, R. De Renzi, T. Shiroka, G. Lamura, G. Prando, P. Carretta, M. Putti, A. Martinelli, M. R. Cimberle, M. Tropeano, et al., Phys. Rev. B 82, 060508(R) (2010).
- Urbano et al. (2010) R. R. Urbano, E. L. Green, W. G. Moulton, A. P. Reyes, P. L. Kuhns, E. M. Bittar, C. Adriano, T. M. Garitezi, L. Bufaical, and P. G. Pagliuso, Phys. Rev. Lett. 105, 107001 (2010).
- Carlo et al. (2009) J. P. Carlo, Y. J. Uemura, T. Goko, G. J. MacDougall, J. A. Rodriguez, W. Yu, G. M. Luke, P. Dai, N. Shannon, S. Miyasaka, et al., Phys. Rev. Lett. 102, 087001 (2009).
- Bernhard et al. (2009) C. Bernhard, A. J. Drew, L. Schulz, V. K. Malik, M. Roessle, C. Niedermayer, T. Wolf, G. D. Varma, G. Mu, H. H. Wen, et al., New Journal of Physics 11, 055050 (2009), eprint 0902.0859.
- Nakai et al. (2008) Y. Nakai, K. Ishida, Y. Kamihara, M. Hirano, and H. Hosono, J. Phys. Soc. Jpn. 77, 073701 (2008).
- Prando et al. (2010) G. Prando, P. Carretta, A. Rigamonti, S. Sanna, A. Palenzona, M. Putti, and M. Tropeano, Phys. Rev. B 81, 100508 (2010).
- Maeter et al. (2009) H. Maeter, H. Luetkens, Y. G. Pashkevich, A. Kwadrin, R. Khasanov, A. Amato, A. A. Gusev, K. V. Lamonova, D. A. Chervinskii, R. Klingeler, et al., Phys. Rev. B 80, 094524 (2009).
- Golze et al. (2006) C. Golze, A. Alfonsov, R. Klingeler, B. Büchner, V. Kataev, C. Mennerich, H.-H. Klauss, M. Goiran, J.-M. Broto, H. Rakoto, et al., Phys. Rev. B 73, 224403 (2006).
- Kondrat et al. (2009) A. Kondrat, J. E. Hamann-Borrero, N. Leps, M. Kosmala, O. Schumann, A. Köhler, J. Werner, G. Behr, M. Braden, R. Klingeler, et al., Eur. Phys. J. B 70 (4), 461-468 (2009).
- Zhigadlo et al. (2008) N. D. Zhigadlo, S. Katrych, Z. Bukowski, S. Weyeneth, R. Puzniak, and J. Karpinski, Journal of Physics: Condensed Matter 20, 342202 (2008).
- Klingeler et al. (2010) R. Klingeler, N. Leps, I. Hellmann, A. Popa, U. Stockert, C. Hess, V. Kataev, H. Grafe, F. Hammerath, G. Lang, et al., Phys. Rev. B 81, 024506 (2010).
- Klauss et al. (2008) H.-H. Klauss, H. Luetkens, R. Klingeler, C. Hess, F. J. Litterst, M. Kraken, M. M. Korshunov, I. Eremin, S.-L. Drechsler, R. Khasanov, et al., Phys. Rev. Lett. 101, 077005 (2008).
- Zhigadlo et al. (2010) N. D. Zhigadlo, S. Katrych, S. Weyeneth, R. Puzniak, P. J. W. Moll, Z. Bukowski, J. Karpinski, H. Keller, and B. Batlogg, Phys. Rev. B 82, 064517 (2010).
- Rotter et al. (2008) M. Rotter, M. Pangerl, M. Tegel, and D. Johrendt, Angew. Chem. 47, 7949 (2008), eprint 0807.4096.
- Koitzsch et al. (2009) A. Koitzsch, D. S. Inosov, D. V. Evtushinsky, V. B. Zabolotnyy, A. A. Kordyuk, A. Kondrat, C. Hess, M. Knupfer, B. Büchner, G. L. Sun, et al., Phys. Rev. Lett. 102, 167001 (2009).
- Kondrat et al. (2010) A. Kondrat, G. Behr, B. Büchner, and C. Hess (2010), eprint 1006.0715.
- Barnes (1981) S. E. Barnes, Adv. Phys. 30, 801 (1981).
- Abragam and Bleaney (1970) A. Abragam and B. Bleaney, Electron Paramagnetic Resonance of Transition Ions (1970).
- Dengler et al. (2010) E. Dengler, J. Deisenhofer, H.-A. Krug von Nidda, S. Khim, J. S. Kim, K. H. Kim, F. Casper, C. Felser, and A. Loidl, Phys. Rev. B 81, 024406 (2010).
- Goya et al. (1996) G. F. Goya, R. C. Mercader, L. B. Stere, R. D. Sánchez, M. T. Causa, and M. Tovar, J. Phys.: Condens. Matter 8, 4529 (1996).
- de la Cruz et al. (2008) C. de la Cruz, Q. Huang, J. W. Lynn, J. Li, W. Ratcliff II, J. L. Zarestky, H. A. Mook, G. F. Chen, J. L. Luo, N. L. Wang, et al., Nature 453, 899 (2008).
- Fainstein et al. (1994) A. Fainstein, A. Butera, and M. Tovar, Phys. Rev. B 50, 16708 (1994).
- Oseroff et al. (1990) S. B. Oseroff, D. Rao, F. Wright, D. C. Vier, S. Schultz, J. D. Thompson, Z. Fisk, S.-W. Cheong, M. F. Hundley, and M. Tovar, Phys. Rev. B 41, 1934 (1990).
- Kittel (2005) C. Kittel, Introduction to Solid State Physics (WILEY, 2005).
- Shamoto et al. (2009) S. Shamoto, M. Ishikado, S. Wakimoto, K. Kodama, R. Kajimoto, M. Arai, T. Fukuda, H. Nakamura, M. Machida, and H. Eisaki, Physica C: Superconductivity 470, S284 (2009).
- Wakimoto et al. (2010) S. Wakimoto, K. Kodama, M. Ishikado, M. Matsuda, R. Kajimoto, M. Arai, K. Kakurai, F. Esaka, A. Iyo, H. Kito, et al., J. Phys. Soc. Jpn. 79, 074715 (2010).
- McGuire et al. (2008) M. A. McGuire, A. D. Christianson, A. S. Sefat, B. C. Sales, M. D. Lumsden, R. Jin, E. A. Payzant, D. Mandrus, Y. Luan, V. Keppens, et al., Phys. Rev. B 78, 094517 (2008).
- Nomura et al. (2008) T. Nomura, S. W. Kim, Y. Kamihara, M. Hirano, P. V. Sushko, K. Kato, M. Takata, A. L. Shluger, and H. Hosono, Supercond. Sci. Technol. 21, 125028 (2008), eprint 0804.3569.
- Kohama et al. (2008) Y. Kohama, Y. Kamihara, M. Hirano, H. Kawaji, T. Atake, and H. Hosono, Phys. Rev. B 78, 020512 (2008).