Imaging Coulomb Islands in a Quantum Hall Interferometer
Abstract
In the Quantum Hall regime, near integer filling factors, electrons should only be transmitted through spatially-separated edge states. However, in mesoscopic systems, electronic transmission turns out to be more complex, giving rise to a large spectrum of magnetoresistance oscillations. To explain these observations, recent models put forward that, as edge states come close to each other, electrons can hop between counterpropagating edge channels, or tunnel through Coulomb islands. Here, we use scanning gate microscopy to demonstrate the presence of quantum Hall Coulomb islands, and reveal the spatial structure of transport inside a quantum Hall interferometer. Electron islands locations are found by modulating the tunneling between edge states and confined electron orbits. Tuning the magnetic field, we unveil a continuous evolution of active electron islands. This allows to decrypt the complexity of high magnetic field magnetoresistance oscillations, and opens the way to further local scale manipulations of quantum Hall localized states.
pacs:
73.21.La,73.23.Ad,03.65.Yz,85.35.DsThe quantum nature of electrons is two-sided: discreteness of charge and wave-like behaviour. Most of the time, experiments reveal either one or the other. Quantum rings (QR) are known to be archetype devices where the wave-like nature of electrons manifests itself through Aharonov-Bohm (AB) oscillations AB_physrev59 . They originate from the -dependence of the phase acquired by electrons along the QR’s arms, which modulates electron interferences within the QR. Therefore, in the coherent regime of transport and at low magnetic field , the resistance of a mesoscopic quantum ring exhibits oscillations as is varied, with a flux period corresponding to the flux quantum Webb_PRL85 .
On the other hand, charge quantization can dramatically affect transport through a nanoscopic island occupied by electrons. When the charging energy , where is the island capacitance, Coulomb blockade (CB) prohibits electron transport except for potential values such that and states are degenerate Kouwenhoven_review . CB manifests itself by periodic conductance peaks when the electrostatic potential is varied.
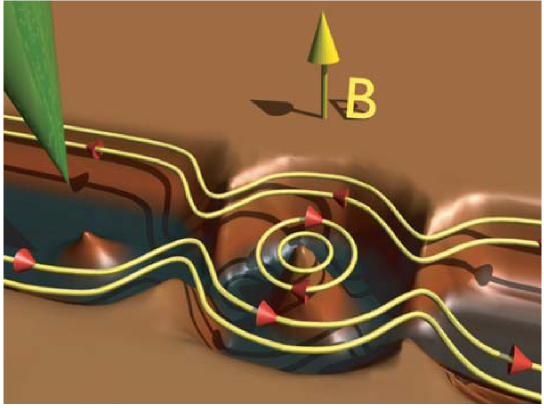
By contrast, in the quantum Hall regime, the situation should be simpler : the resistance vanishes at low temperature since transport occurs through edge states Halperin82 ; Buttiker88 ; chklovskiiPRB92 . Several local-probe experiments have confirmed this edge-state picture and imaged localized states in the bulk of macroscopic two-dimensional electron systems Tessmer98 ; Yacobi99 ; Woodside01 ; hashimoto08 . However, numerous experiments on mesoscopic devices in the quantum Hall regime revealed surprising observations, such as pseudo-Aharonov-Bohm ”subperiods” and ”superperiods” GoldmanScience95 ; vanwees_PRL89 ; Taylor_PRL92 ; kataokaPRL99 ; CaminoPRB05 ; ZhangPRB09 ; giesbers10 . Motivated by these unexpected results, recent theories brought to the fore the discrete nature of electrons to explain the broad range of periodicities. They invoke Coulomb interactions and tunneling between an electron island and edge states rosenowPRL07 (Fig. 1), which may be combined with a spatial oscillation of the outermost electron orbit in the island giesbers10 . Complementing these theories, simulations yielded a detailed microscopic description of the different possible processes taking place in this regime IhnatsenkaPRB08 ; IhnatsenkaPRB09 . To the theoretical debate adds the diversity of experimental observations, which hampers unambiguous determination of the precise mechanisms at play at the local scale.
Here, we present a spatially-resolved investigation of electron transport inside an interferometer formed by an InGaAs/InAlAs quantum ring (see method section), driven in the integer quantum Hall (QH) regime. We show that each pseudo-AB period can be associated with a specific Coulomb island formed by edge states loops enclosing a hill or a valley in the potential. Each active Coulomb island can be located precisely inside the QR by tuning the magnetic field and imaging the spatial shift of Coulomb resonances by means of scanning gate microscopy.
Results
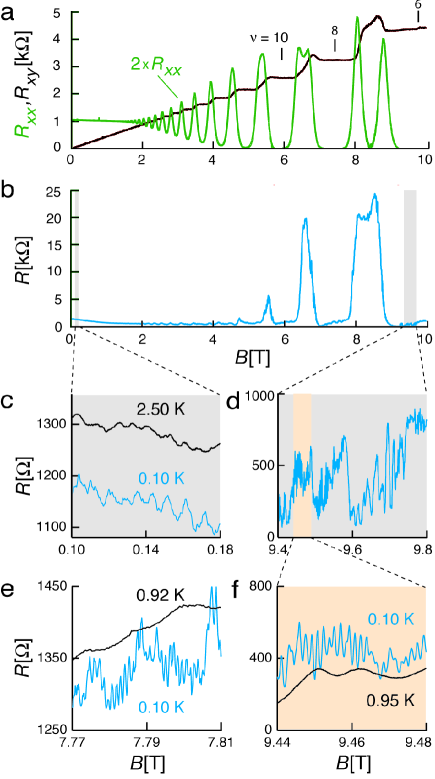
Magnetoresistance measurements. At low and , electron transport through the QR is in the coherent regime. This is attested by periodic Aharonov-Bohm oscillations in resistance vs . As expected, the AB period (Fig. 2c), corresponds to the average QR radius (380 nm). Note also that the QR is in the quasi-ballistic regime (the electron mean free path is nm at low ), and 25 transverse modes are transmitted through the QR’s openings (the Fermi wavelength is 22 nm, and the openings’ width is 250 nm). At high-, the two-dimensional electron system enters into the QH regime and its transverse magnetoresistance vs exhibits plateaus at values , where is the (integer) filling factor (Fig. 2a). Within the plateaus, the Hall bar longitudinal magnetoresistance vs drops to zero. In contrast, in the -range coinciding with the position of the plateaus, the magnetoresistance of the QR displays strong reproducible fluctuations with a wide range of characteristic -scales (Fig. 2b-f). On Fig. 2b, we also note the absence of finite resistance plateaus, which would indicate a difference in the number of filled Landau levels in the bulk and in the constrictions CaminoPRB05 . A closer look at vs in the region near reveals high-frequency periodic oscillations over some parts of the high -range (Fig. 2f), with a period much smaller than the AB oscillations. Fig. 2e shows that a similar pattern is also visible on the plateau near , but with an even shorter period . Finally, these high- oscillations rapidly decay with temperature (Fig. 2e-f) and vanish before reaching 1 K. This contrasts with AB oscillations that, like the phase coherence time, saturate below 1 K hackensPRL05 and are still visible at 2.5 K (Fig. 2c). An alternative mechanism, unrelated to electron interferences, must therefore be invoked to explain our observations.
To explain the presence of subperiod oscillations, a recent theory invokes Coulomb blockade of electrons tunneling between the conducting edge states transmitted along the borders of the QR and those forming a quantum Hall electron island located at the center of the device rosenowPRL07 (Fig. 1). Changing the magnetic field redistributes electrons within the Landau levels (LLs ): if the flux through the area enclosing the island increases by one flux quantum , one electron must be added to each filled LLs. This process introduces a new contribution to the island charging energy, with a magnetic field period , where is indeed the number of filled LLs. In turn, charging energy oscillations affect the QR resistance through the Coulomb blockade of electrons tunnelling between the quantum Hall island and the transmitted edge states. Note that the area encircled by edge states at high is not necessarily equal to the mean area of the QR, which determines . Simulations (not shown here) of the electron local density of states at T in a 2DEG with the same Fermi energy as in the experiment, indicate that the outermost populated edge state extends 55 nm away from the edge of the device. Taking this value and edge roughness into account, an edge state loop encircling the central QR antidot would therefore have a radius similar to the QR mean radius. This explains the remarkable consistency between the prediction of pseudo-AB subperiods and our observations mT and 1.1 mT at and , respectively (Fig. 2e-f).
From the analysis of the QR magnetoresistance oscillations, a quantum Hall Coulomb island should therefore be present in our quantum ring. While our sample geometry is a priori well suited to generate a quantum island around the central antidot, it could, as we will see later, locate elsewhere. Therefore local-scale information is needed to strenghten our understanding. In addition, the observation of subperiod oscillations only in narrow -windows remains to be explained.
Scanning gate microscopy. Combining electron transport measurements with local probe techniques has already proven powerful to investigate the local details of electron behaviour inside various mesoscopic systems such as quantum point contacts Topinka:2000uq ; Topinka:2001lr ; aoki:155327 , open and closed quantum dots Woodside:2002dq ; piodaPRL04 ; crook:246803 and quantum interferometers in the Aharonov-Bohm regime Hackens:2006qf ; Hackens_PRL07 ; PalaPRB08 ; PalaNano09 . The technique, namely the scanning gate microscopy (SGM), consists in scanning the electrically-biased tip of an atomic force microscope in a plane parallel to the 2DES and recording the changes in the QR resistance, , induced by the tip located at . In the context of the present experiments, the intrinsic sensitivity of Coulomb blockade to potential variations, makes SGM potentially well-suited to explore Coulomb islands.
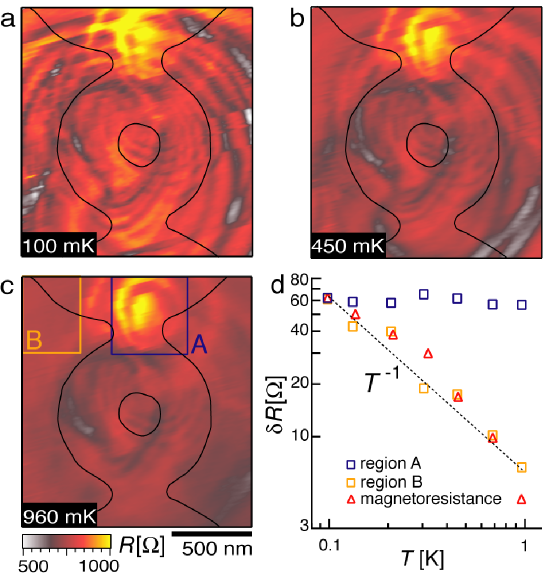
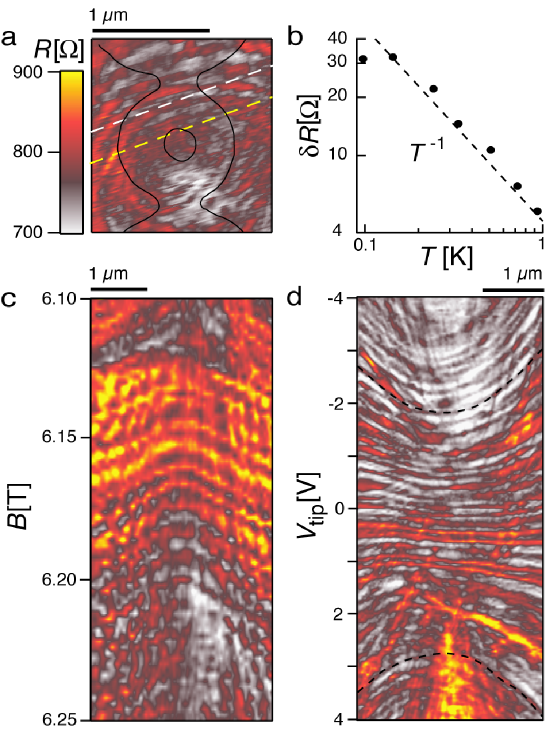
In the -range where subperiod oscillations were evidenced, the resistance map reveals a first set of concentric fringes (type-I) centered on the QR antidot (Fig. 3a). Qualitatively, this is exactly the behaviour expected for a gate scanning above an electron island experiencing Coulomb blockade, i.e. fringes correspond to isopotential lines located at constant distances from the island Woodside:2002dq ; piodaPRL04 . It is worth noting that it is indeed the flux through the edge state loop that controls the present CB effect. Hence, it can be tuned either by sweeping or by approaching a negatively-polarized tip which raises the potential and enlarges the loop surface. Each concentric type-I fringe in Fig. 3a can therefore also be viewed as an isoflux line, that marks one single CB state. Note that the observed succession of concentric fringes is reminiscent of patterns evidenced in previous SGM experiments on a QR at low- Hackens:2006qf , but the physical origin is totally different. As they vanish with increasing , type-I fringes leave more apparent a second set of fringes (type-II), which is found -independent below 1 K (Fig. 3b-c). The presence of two distinct phenomena is made even clearer on Fig. 3d, representing the -dependence of , the standard deviation of in the rectangular regions labeled A and B on Fig. 3c, which are mainly encompassing type-I and type-II fringes, respectively.
Discussion
Focusing on type-I fringes we note that they exhibit the same dependence as the subperiod oscillations in the magnetoresistance (Fig. 3d). More precisely, the dependence of is compatible with a Coulomb blockade (CB) origin for both observations. Indeed, in classical CB experiments at T, the conductance peak height was reported to scale as Folk_PRL96 ; Kouwenhoven_review , in the case of single-level transport through a lateral quantum dot. In our case, electrons transmitted through Coulomb islands contribute only to a part of the total conductance (). Therefore, and should effectively exhibit the same dependence.
Different frameworks can be invoked to explain the origin of type-II fringes. First, in the QH regime, potential variations are at the origin of ’hot spots’, i.e. regions of high sensitivity of the resistance to local potential changes, which have been evidenced by SGM in a Hall bar at 1.9 K baumgartner:085316 . This may explain type-II patterns observed within the area of the QR. But the concentric ring-like patterns at the QR opening (region A, Fig. 3c) cannot be explained within this model, as ’hot spots’ do not give rise to an oscillatory behaviour of the resistance when the tip approaches the spot. As an alternative, we suggest that the tip can modulate tunneling processes between counterpropagating edge states rosenowPRL07 at the openings. Affecting more than one edge state with the tip potential would induce the observed concentric pattern. Magnetoresistance measurements could confirm this scenario : indeed, vs should exhibit finite resistance plateaus in the case of a tip-induced difference in the number of filled Landau levels inside the QR and at the openings CaminoPRB05 .
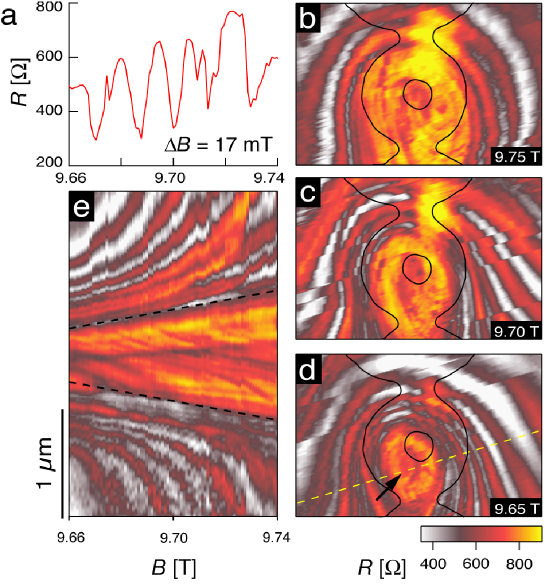
Up to now, we have only analyzed a small -range where subperiods dominate. A close look at Fig. 2d reveals that changing the magnetic field only by a few percents (e.g. from 9.5 to 9.7 T) dramatically modifies the magnetoresistance. This time, marked AB-like ’superperiod’ oscillations show up, with 17 mT (Fig. 4a), which share the same dependence (not shown) as the subperiods discussed above. According to the Rosenow-Halperin model rosenowPRL07 , the superperiod oscillations indicate much smaller edge state loops. With an enclosed area , the loop should have a mean radius of 65 nm, and hence be located somewhere into the 300 nm-wide QR’s arms. Our scanning gate should therefore be able to locate the loop.
The SGM localization is achieved in the sequence of Fig. 4b-d. From 9.75 to 9.65 T, fringes shrink and finally reveal the active Coulomb island, marked by the arrow on Fig. 4b. Note that the precise shape of the central SGM pattern is a convolution of the Coulomb island and tip potential shapes Gildemeister_PRB07 . A more detailed view of this process is shown in Fig. 4e, displaying the -dependence of the SGM profile taken along the dashed line in Fig. 4d, crossing the center of the fringes. Clearly, isoresistance lines shift towards lower as the negatively-charged tip approaches. Interestingly, the sign of the -shift can indeed discriminate between edge states surrounding a potential hill and those confined on the border of the potential well. Assuming that the incompressible island surrounds a potential hill, approaching a negative-biased tip will raise the potential and increase the loop surface. If the incompressible island were localized in a potential well, the tip would reduce the loop surface. Since isoresistance lines correspond to isoflux states through the incompressible loop, the low- shift in Fig. 4e unambiguously identifies that the loop surrounds a potential hill.
It is worth noting that both subperiods and superperiods are observed in limited -ranges. This means that a small potential perturbation by the tip could completely wipe out the CB oscillations, by either suppressing tunneling channels or suppressing CB islands. The region delimited by the dashed lines in Fig. 4e provides an example of such a state where AB-like superperiods are suppressed.
At first sight, the data taken near and shown in Fig. 5a resembles more SGM maps presented in another QR but at low B Hackens:2006qf . Strikingly, the -dependence of the profile taken along the yellow dashed line in Fig. 5a shows dominant oscillations with 7.8 mT (Fig. 5c), very close to what the orthodox AB effect would provide in our sample. But the temperature dependence, shown in Fig. 5b, is not that expected for the AB effect. Indeed, the observed resistance oscillations are only pseudo-AB ones as they exhibit the same -dependence as sub and superperiod oscillations, indicating that they share the same Coulomb blockade origin.
As already shown near , the CB resonances shift towards low- when the tip approaches the QR (Fig. 5c). However, the relative amplitude of this shift is smaller compared to Fig. 4e because the tip does not scan directly over the active Coulomb island, so the potential perturbation experienced by the Coulomb island is not as large as in Fig. 4e. In addition, the data reveal a much richer pattern of fringes indicating that multiple Coulomb islands are at work. This is confirmed in Fig. 5d that shows the dependence of SGM profiles taken along the white dashed line on Fig. 5a (note that changing the position of the SGM profile yields qualitatively similar results). The main features are parabolic-like iso-resistance lines, indicated by the dashed lines. Their curvature evolves from zero at V to positive or negative, according to the polarity of the tip, as expected for Coulomb interaction between the tip and a potential hill (see also ref. piodaPRL04 ). However, Fig. 5d, like Fig. 5c, also shows steeper resistance lines confirming the richness and complexity of mesoscopic transport in quantum Hall interferometers.
The wealth of behaviours exhibited in SGM data at different magnetic fields and tip voltages illustrates the capability of SGM to embrace the complexity of quantum Hall interferometers at the local scale, and, beyond that, of mesoscopic transport. The fine tuning of the local scale potential by the biased tip offers various opportunities to image and manipulate localized electron states. Such a detailed probing of electron transport in quantum Hall interferometers may also prove valuable in future explorations of non abelian quantum states dassarmaPRL05 ; Stern_PRL06 .
Methods
Device fabrication and sample parameters. The quantum ring was patterned using electron beam lithography and wet etching in an InGaAs/InAlAs heterostructure HackensPRB02 . A two-dimensional electron system is confined 25 nm below the surface and its low temperature electron density and mobility are and , respectively, calculated from longitudinal and transverse magnetoresistance ( and vs , Fig. 2a) measurements on a Hall bar patterned next to the QR. The quantum ring inner and outer lithographic radii are 215 nm and 520 nm, respectively, and the width of both openings is 300 nm (Fig. S2). Note that the depletion length at the edge of etched trenches is .
SGM technique. The experiments are carried out down to 100 mK with the sample thermally anchored to the mixing chamber of a dilution refrigerator, and a home-made Atomic Force Microscope (AFM) suspended underneath. The force sensor consists in a commercial AFM cantilever coated with 20 nm of Ti and 10 nm of Pt (model CSC17 from MikroMasch; nominal tip radius : 40 nm), glued on one prong of a quartz tuning fork using conductive silver epoxy (Fig. S1a). To measure the sample topography, the AFM is operated in the dynamic mode with a feedback loop on the tuning fork oscillation frequency shift.
Using this method, we obtained the topography image of the quantum ring shown in Fig. S2a, at a temperature mK. Clear edges are visible where the heterostructure was etched, which is an indication of a sharp tip. Further information on the quality of both the tip and the imaging technique can be inferred by comparing the topography image (Fig. S2a) with Fig. S2b, obtained by Scanning Electron Microscopy (SEM) before cooling down the sample. Small differences can be observed between Fig. S2a and b. In particular, the size of the etched trenches is nm smaller in the AFM topography. This discrepancy originates from the convolution of the tip shape with the surface topography in the AFM picture. Fig. S1b shows an image of the extremity of the tip used in the experiments presented in this work, obtained by SEM after the end of the SGM experiments. The size of the tip apex on this picture is nm, which explains the difference in dimensions between Fig. S2a and b.
After imaging the topography of the ring, the tip is lifted at a distance of 50 nm from the sample surface (i.e. 75 nm away from the 2D electron system), and a bias voltage is applied on the tip in order to induce a local electrostatic perturbation for electrons transmitted through the QR. The quantum ring resistance is measured using a low frequency (28 Hz) lock-in technique with a source-drain voltage across the QR always less than k/e. Figures 4b-d were measured over several hours. Before and after such a set of SGM experiment, the QR topography was imaged in order to check if the tip drifted with respect to the QR position during the experiment. We observed that the lateral drift was always smaller than 50 nm.
An additional shift between the topography and the map may originate from differences between the topographic tip and the ”electric tip”, i.e. the perturbation of electrostatic potential associated with the charged tip, experienced by electrons inside the quantum ring. Indeed, charged contamination on both the tip or the sample surface may contribute to alter this potential. This shift can be roughly estimated by noting that each set of concentric resistance fringes in the maps is centered on a Coulomb island, and must therefore have its center located within the limits of the quantum ring. By examining all the available maps, we could determine a higher bound of 150 nm on this shift (i.e. a shift larger than 150 nm would mean that some sets of resistance fringes are centered outside the QR area).
A crucial issue in the context of scanning gate microscopy is the ”gating behaviour” of the tip Gildemeister_PRB07 ; Gildemeister_APL07 . First, Fig. S1b shows that the metal layer covering the tip apex remained continuous during our experiment, and was not damaged by the numerous topographic scans realized at low temperature. In addition, there is no indication for a multiple tip, neither in Fig. S1b, nor in topography mode, nor in SGM images. Complementary, the electrical quality of the tip can be evaluated from the maps. In the map shown in Fig. S3, neighboring resistance fringes separated by less than nm can be distinguished, which gives an indication on the width of the perturbating potential. Note that this width increases with the tip-surface separation in SGM mode.
Furthermore, the electrical potential associated with the charged tip should ideally have a circular symmetry, in order to avoid unwanted distortion of the features visible in the map. This symmetry can be evaluated on SGM maps of quantum dots: when the tip potential shifts an energy level of the quantum dot in resonance with the source and drain energy levels, electrons can tunnel through the quantum dot, which induces a current rise. In an SGM map, these resonances are visible as sets of concentric rings. The set of rings is directly related to the electrical potential of the tip, as shown in ref. Gildemeister_PRB07 . In our experiment, the sets of resistance fringes in maps are also related to the Coulomb blockade phenomenon, and correspond to isopotential lines. Their precise shape depends both on the tip potential shape, and on the shape of the potential hill around which each electron loop is localized. In the case of an anisotropic tip potential, the sets of resistance fringes in maps would all exhibit the same shape distortion related to the potential anisotropy. This is contrary to our observations: we observe a large diversity in the shapes of resistance fringes, but no recurrent anisotropy. This indicates that the tip potential shape is not anisotropic.
References
- (1) Aharonov, Y. & Bohm, D. Significance of Electromagnetic Potentials in the Quantum Theory, Phys. Rev. 115, 485-491 (1959).
- (2) Webb, R. A., Washburn, S., Umbach, C. P. & Laibowitz, R. B. Observation of Aharonov-Bohm Oscillations in Normal-Metal Rings, Phys. Rev. Lett. 54, 2696-2699 (1985).
- (3) Kouwenhoven, L. P., Marcus, C. M., McEuen, P. L., Tarucha, S., Westervelt, R. M. & Wingreen, N. S. Electron transport in quantum dots, in Mesoscopic Electron Transport, edited by Sohn, L. L., Kouwenhoven, L. P. & Schon, G., Series E: Applied Sciences (Kluwer Academic, Dordrecht), 345, 105-214 (1997).
- (4) Halperin, B. I. Quantized Hall conductance, current-carrying edge states and the existence of extended states in a two-dimensional disordered potential, Phys. Rev. B 25, 2185-2190 (1982).
- (5) Buttiker, M. Absence of backscattering in the Quantum Hall effect in multiprobe conductors, Phys. Rev. B 38, 9375-9389 (1988).
- (6) Chklovskii, D. B., Shklovskii, B. I. & Glazman, L. I. Electrostatics of edge channels, Phys. Rev. B 46, 4026-4034 (1992).
- (7) Tessmer, S. H., Glicofridis, P. I., Ashoori, R. C., Levitov, L. S. & Melloch, M. R. Subsurface charge accumulation imaging of a quantum Hall liquid, Nature 392, 51-54 (1998).
- (8) Yacoby, Y., Hess, H. F., Fulton, T. A., Pfeiffer, L. N. & West, K. W. Electrical imaging of the quantum Hall state, Solid State Comm. 111, 1-13 (1999).
- (9) Woodside, M. T., Vale, C., McEuen, P. L., Kadow, C., Maranowski, K. D. & Gossard, A. C. Imaging interedge-state scattering centers in the quantum Hall regime, Phys. Rev. B 64, 041310(R) (2001).
- (10) Hashimoto, K., Sohrmann, C., Wiebe, J., Inaoka, T., Meier, F., Hirayama, Y., Rømer, R. A., Wiesendanger, R. & Morgenstern, M. Quantum Hall Transition in Real Space: From Localized to Extended States, Phys. Rev. Lett. 101, 256802 (2008).
- (11) Goldman, V. J. & Su, B. Resonant Tunneling in the quantum Hall regime : measurement of fractional charge, Science 267, 1010-1012 (1995).
- (12) van Wees, B. J. et al. Observation of zero-dimensional states in a one-dimensional electron interferometer, Phys. Rev. Lett. 62, 2523-2526 (1989).
- (13) Taylor, R. P., Sachrajda, A. S., Zawadzki, P., Coleridge, P. T. & Adams, J. A. Aharonov-Bohm oscillations in the Coulomb blockade regime, Phys. Rev. Lett. 69, 1989-1992 (1992).
- (14) Kataoka, M. et al. Detection of Coulomb Charging around an Antidot in the Quantum Hall Regime, Phys. Rev. Lett. 83, 160-163 (1999).
- (15) Camino, F. E., Zhou, W. & Goldman, V. J. Realization of a Laughlin quasiparticle interferometer: Observation of fractional statistics, Phys. Rev. B 72, 075342 (2005).
- (16) Zhang, Y. et al. Distinct signatures for Coulomb blockade and Aharonov-Bohm interference in electronic Fabry-Perot interferometers, Phys. Rev. B 79, 241304 (2009).
- (17) Giesbers, A. J. M. et al. Correlation-induced single-flux-quantum penetration in quantum rings, Nature Phys. 6, 173-177 (2010).
- (18) Rosenow, B. & Halperin, B. I. Influence of Interactions on Flux and Back-Gate Period of Quantum Hall Interferometers, Phys. Rev. Lett. 98, 106801 (2007).
- (19) Ihnatsenka, S. & Zozoulenko, I. V. Interacting electrons in the Aharonov-Bohm interferometer, Phys. Rev. B 77, 235304 (2008).
- (20) Ihnatsenka, S., Zozoulenko, I. V. & Kirczenow, G. Electron-electron interactions in antidot-based Aharonov-Bohm interferometers, Phys. Rev. B 80, 115303 (2009).
- (21) Hackens, B. et al. Dwell-Time-Limited Coherence in Open Quantum Dots, Phys. Rev. Lett. 94, 146802 (2005).
- (22) Topinka, M. A. et al., Imaging coherent electron flow from a quantum point contact, Science 289, 232-2326 (2000).
- (23) Topinka, M. A. et al. Coherent branched flow in a two-dimensional electron gas, Nature 410, 183-186 (2001).
- (24) Aoki, N., da Cunha, C. R., Akis, R., Ferry, D. K. & Ochiai, Y. Imaging of integer quantum Hall edge state in a quantum point contact via scanning gate microscopy, Phys. Rev. B 72, 155327 (2005).
- (25) Crook, R. et al. Imaging Fractal Conductance Fluctuations and Scarred Wave Functions in a Quantum Billiard, Phys. Rev. Lett. 91, 246803 (2003).
- (26) Woodside, M. T. & McEuen, P. L. Scanned probe imaging of single-electron charge states in nanotube quantum dots, Science 296, 1098-1101 (2002).
- (27) Pioda, A. et al. Spatially Resolved Manipulation of Single Electrons in Quantum Dots Using a Scanned Probe, Phys. Rev. Lett. 93, 216801 (2004).
- (28) Hackens, B. et al. Imaging and controlling electron transport inside a quantum ring, Nature Phys. 2, 826-830 (2006).
- (29) Martins, F. et al. Imaging Electron Wave Functions Inside Open Quantum Rings, Phys. Rev. Lett. 99, 136807 (2007).
- (30) Pala, M. G. et al. Local density of states in mesoscopic samples from scanning gate microscopy, Phys. Rev. B 77, 125310 (2008).
- (31) Pala, M. G. et al. Scanning gate microscopy of quantum rings: effects of an external magnetic field and of charged defects, Nanotechnology 20, 264021 (2009).
- (32) Folk, J. A. et al. Statistics and Parametric Correlations of Coulomb Blockade Peak Fluctuations in Quantum Dots, Phys. Rev. Lett. 76, 1699-1702 (1996).
- (33) Baumgartner, A. et al. Quantum Hall effect transition in scanning gate experiments, Phys. Rev. B 76, 085316 (2007).
- (34) Gildemeister, A. E. et al. Measurement of the tip-induced potential in scanning gate experiments, Phys. Rev. B 75, 195338 (2007).
- (35) Das Sarma, S., Freedman, M. & Nayak, C. Topologically Protected Qubits from a Possible Non-Abelian Fractional Quantum Hall State, Phys. Rev. Lett. 94, 166802 (2005).
- (36) Stern, A. & Halperin, B. I. Proposed Experiments to Probe the Non-Abelian Quantum Hall State, Phys. Rev. Lett. 96, 016802 (2006).
- (37) Hackens, B. et al. Long dephasing time and high-temperature conductance fluctuations in an open InGaAs quantum dot, Phys. Rev. B 66, 241305 (2002).
- (38) Gildemeister, A. E. et al. In situ treatment of a scanning gate microscopy tip, Appl. Phys. Lett. 90, 213113 (2007).
Acknowledgements
B. H. is postdoctoral researcher with the Belgian FRS-FNRS and F. M. is funded by FNRS and FCT (Portugal) postdoctoral grants. This work has been supported by FRFC grant no. 2.4.546.08.F, and FNRS grant no 1.5.044.07.F, by the Belgian Science Policy (Interuniversity Attraction Pole Program IAP-6/42), This work has also been supported by the PNANO 2007 program of the Agence Nationale de la Recherche (‘MICATEC’ project). VB acknowledges the award of a ‘Chaire d’excellence’ by the Nanoscience Foundation in Grenoble.
Author contributions
F. M. and B. H. performed the low-temperature SGM experiment; B. H., F. M. and V. B. analyzed the experimental data; L. D. and X. W. grew the InGaAs heterostructure; B. H. and C. A. D. processed the samples; B. H., S. F. and F. M. built the low temperature scanning gate microscope; B. H., F. M., S. F., H. S., S. H., M. P. and V. B. contributed to the conception of the experiment; B. H. and V. B. wrote the paper and B. H., F. M., H. S., S. H., M. P. and V. B. discussed the results and commented on the manuscript.
Competing financial interests
The authors declare no competing financial interests.