The quasar PG 0844+349 in an X-ray weak state
Abstract
In March 2009 the well-studied quasar, PG 0844+349, was discovered with Swift to be in an X-ray weak state. A follow-up XMM-Newton observation several weeks later generated a good quality spectrum of the source, showing substantial curvature and spectral hardening. In combination with archival data at two previous epochs when the source was in a bright state, we examine the long-term spectral and timing properties of PG 0844+349 spanning nearly ten years and a factor of ten in brightness. Partial covering and blurred reflection models are compared to the data at each flux state while attempting to maintain consistency between the various epochs. In terms of the blurred reflection model, PG 0844+349 is in a reflection dominated state during the 2009 X-ray weak observations, which can be understood in terms of light bending. Moreover, the light bending scenario can also account for the short-term (i.e. ) spectral variability in the source. Other models cannot be decisively ruled out, but we note distinguishing features of the models that can be explored for in higher signal-to-noise data from current and future observatories.
keywords:
galaxies: active – galaxies: nuclei – galaxies: individual: PG 0844+349 – X-ray: galaxies1 Introduction
The X-ray spectra of active galactic nuclei (AGNs) can exhibit such significant differences from one epoch to the next that it can become very difficult to extract meaningful constraints from single-epoch spectra. Multi-epoch data are particularly useful to constrain model components that fluctuate on vastly different time scales, thereby removing excessive freedom in some fit parameters (e.g. Gallo et al. 2010, 2007a,b; Grupe et al. 2008; Zoghbi et al. 2008) and allowing for more insightful discussion.
One attractive proposition is to catch AGN in a particularly low X-ray flux state (Gallo 2006). In principle, the low-flux state can provide the best perspective of the AGN environment, for example the nature of the accretion disc and associated relativistic features (e.g. Miller 2007) and/or the surrounding ionised plasmas (e.g. Longinotti et al. 2008) since the direct continuum (i.e. the power law component) is substantially suppressed (e.g. Schartel et al. 2010, Ballo et al. 2008, Grupe et al. 2008; Vignali et al. 2008; Miniutti et al. 2009). Moreover, examining the spectral changes from high- to low-flux states can potentially reveal the origin of the variability, whether it be: light-bending (e.g. Miniutti & Fabian 2004), absorption (e.g. Turner & Miller 2009), or beaming (e.g. Gallo et al. 2010, 2007b).
Efforts to identify objects in the low X-ray flux state by monitoring AGNs with Swift and triggering a pointed XMM-Newton observation when an object is discovered to be in a low-state are proving advantageous (e.g. Grupe et al. 2007, 2008). We have recently applied this strategy to catch the type-I quasar, PG 0844+349 () in an X-ray weak state.111An X-ray weak state implies that the AGN X-ray emission is significantly diminished with respect to the AGN’s UV flux. This is not necessarily the same as a X-ray low flux state, which makes no statement about the UV emission and typically refers to the brightness of the source relative to previous X-ray observations. The X-ray state can be quantified by as we describe in Sect. 3.1. In 2009, PG 0844+349 was in a X-ray weak and low-flux state.
PG 0844+349 is a particularly interesting radio-quiet AGN. Sufficiently bright in the optical to be termed a quasar, it possesses strong Fe ii emission and weak [O iii] like a narrow-line Seyfert 1 (NLS1), though its FWHM(H) (, Boroson & Green 1992) is slightly above the oft-quoted upper limit for a NLS1 of (Osterbrock & Pogge 1985). Its black hole mass estimated from reverberation mapping is (Peterson et al. 2004). Several values can be estimated for its Eddington ratio based on the literature (e.g. Grupe et al. 2010; Vasudevan & Fabian 2009), but the value is apparently always sub-Eddington.
Early in the XMM-Newton mission, an observation of PG 0844+349 garnered attention as it was found in a historically high-flux state compared to previous X-ray observations (Brinkmann et al. 2003). Pounds et al. (2003) reported absorption features in this same data set that they interpreted as high-mass, relativistic outflows. A subsequent reanalysis of the data along with a deeper observation by Brinkmann et al. (2006) could not confirm the absorption features reported by Pounds et al. and attributed them to calibration uncertainties (see also Vaughan & Uttley 2008).
In March 2009, PG 0844+349 was observed with Swift as part of an unrelated project (PI: Vanden Berk). A quick look at the X-ray data revealed the quasar had entered a low-flux state. A Swift Target of Opportunity observation (ToO) was initiated in April to determine if the AGN was still X-ray dim. As it was found to be so, an XMM-Newton ToO was triggered a few days later and it is these new data, in combination with the previous XMM-Newton observations, that we report on here.
The observations and data reduction are described in the following section. In Section 3, the general properties of the data at each epoch are explored. In Section 4 we fit the average spectrum at each epoch with various physical models to derive a self-consistent interpretation for the long-term (yearly scale) changes. We compare the model, consider the short-term (intra-observation) variability, and discuss our results in Section 5. We summarise our results in Section 6.
2 Observations and data reduction
Snap-shot observations of PG 0844+349 were conducted with Swift (Gehrels et al. 2004) on two occasions in 2009, the details of which can be found in Table LABEL:tab:obslog. The X-ray Telescope (XRT; Burrows et al. 2005) operated in photon counting mode (Hill et al. 2004) and the data were reduced with the task xrtpipeline v0.12.1. Source photons were extracted from a circular region of radius (corresponding to an encircled energy fraction of 90 per cent) using xselect. The background events were selected from a nearby source-free region with radius . Net source counts were low at both epochs (126 and 63) and a spectrum was only created for the higher count spectrum (2009 March). The UV-Optical Telescope (UVOT; Roming et al. 2005) observed PG 0844+349 through the various filters at both epochs. The UVOT data were reduced and analyzed as described in Poole et al. (2008). All magnitudes are corrected for Galactic reddening (; Schlegel et al. 1998) and are listed in Table LABEL:tab:uvlog.
PG 0844+349 was observed with XMM-Newton (Jansen et al. 2001) in 2000 and 2009. In 2001 the AGN was in the field-of-view during the observation of cluster of galaxies Vik 59. A summary of all X-ray observations is provided in Table LABEL:tab:obslog. During the 2000 and 2009 observations the EPIC pn (Strüder et al. 2001) was operated in full-frame and large-window mode, respectively. In 2001 the pn camera did not collect data. The MOS (MOS1 and MOS2; Turner et al. 2001) cameras were operated in small-window mode in 2000 and 2009, and full-frame mode in 2001. The medium filter was in place for the first observation and the thin filter for the other observations. The Reflection Grating Spectrometers (RGS1 and RGS2; den Herder et al. 2001) also collected data during these observations, but will not be discussed here. The data were of lower statistical quality when PG 0844+349 was in a low-flux state in 2009, and in 2001 the source was not detected as it was observed off-axis. The 2000 RGS data were reported by Pounds et al. (2003). The Optical Monitor (OM; Mason et al. 2001) operated in imaging mode and collected data in the filter in 2000 and various filters in 2009 (Table LABEL:tab:uvlog). No OM data were collected in 2001 as the AGN was outside the OM field-of-view.
| (1) | (2) | (3) | (4) | (5) | (6) |
|---|---|---|---|---|---|
| Epoch | Telescope and | Observation ID | Start Date | Exposure | Counts |
| Instrument | (year.mm.dd) | (s) | |||
| 2000 | XMM-Newton pn | 0103660201 | 2000.11.05 | 11940 | 23241 |
| XMM-Newton MOS | 37930 | 48777 | |||
| 2001 | XMM-Newton MOS | 0107860501 | 2001.10.08 | 127600 | 133484 |
| 2009a | Swift XRT | 2009.03.14 | 3618 | 126 | |
| 2009b | Swift XRT | 2009.04.26 | 1614 | 63 | |
| 2009 | XMM-Newton pn | 0554710101 | 2009.05.03 | 11700 | 3716 |
| XMM-Newton MOS | 28870 | 2608 |
| (1) | (2) | (3) | (4) | (5) | (6) | (7) | (8) |
|---|---|---|---|---|---|---|---|
| Epoch | Telescope | ||||||
| (5468/5235) | (4392/4050) | (3465/3275) | (2600/2675) | (2246/2205) | (1928/1984) | ||
| 2000 | XMM-Newton OM | ||||||
| 2009a | Swift UVOT | ||||||
| 2009b | Swift UVOT | ||||||
| 2009 | XMM-Newton OM |
The XMM-Newton Observation Data Files (ODFs) from all observations were processed to produce calibrated event lists using the XMM-Newton Science Analysis System (SAS v10.0.0). Unwanted hot, dead, or flickering pixels were removed as were events due to electronic noise. Event energies were corrected for charge-transfer inefficiencies. Light curves were extracted from these event lists to search for periods of high background flaring. Significant background flares were detected in 2000 and 2001, and those periods have been neglected. The total amount of good exposure is listed in Table LABEL:tab:obslog. Source photons were extracted from an annulus around the source to mitigate the effects of pile-up in the central region during 2000 and 2001. Pile-up was negligible in the 2009 observations and a circular extraction region that included all of the source was used. The background photons were extracted from an off-source region on the same CCD. Single and double events were selected for the pn detector, and single-quadruple events were selected for the MOS. EPIC response matrices were generated using the SAS tasks ARFGEN and RMFGEN. The MOS and pn data at each epoch were compared for consistency and determined to be in agreement within known uncertainties (Guainazzi et al. 2010). The MOS1 and MOS2 spectra were combined to produce a single MOS spectrum at each epoch.
The XMM-Newton X-ray spectra were grouped such that each bin had a signal-to-noise ratio of at least 7 in 2000 and 2001, and 5 in 2009. Spectral fitting was performed using XSPEC v12.5.0 (Arnaud 1996). All parameters are reported in the rest frame of the source unless specified otherwise. The quoted errors on the model parameters correspond to a 90% confidence level for one interesting parameter (i.e. a = 2.7 criterion). A value for the Galactic column density toward PG 0844+349 of (Elvis et al. 1989) is adopted in all of the spectral fits. K-corrected luminosities are calculated using a Hubble constant of = and a standard flat cosmology with = 0.3 and = 0.7.
3 A first-look at the data
3.1 The UV/X-ray spectral energy distribution
The 2000 observation of PG 0844+349 represents a relatively typical state for the AGN. The optical-to-X-ray spectral slope (i.e. ; Tananbaum et al. 1979) was approximately and was within expected values given its luminosity (Just et al. 2007), where we have estimated the values directly from the shape of the spectral energy distribution (SED) (Grupe et al. 2010). In 2001 PG 0844+349 was slight brighter in the X-rays, but no OM data are available. Assuming the same optical flux as in 2000, the 2001 slope would be
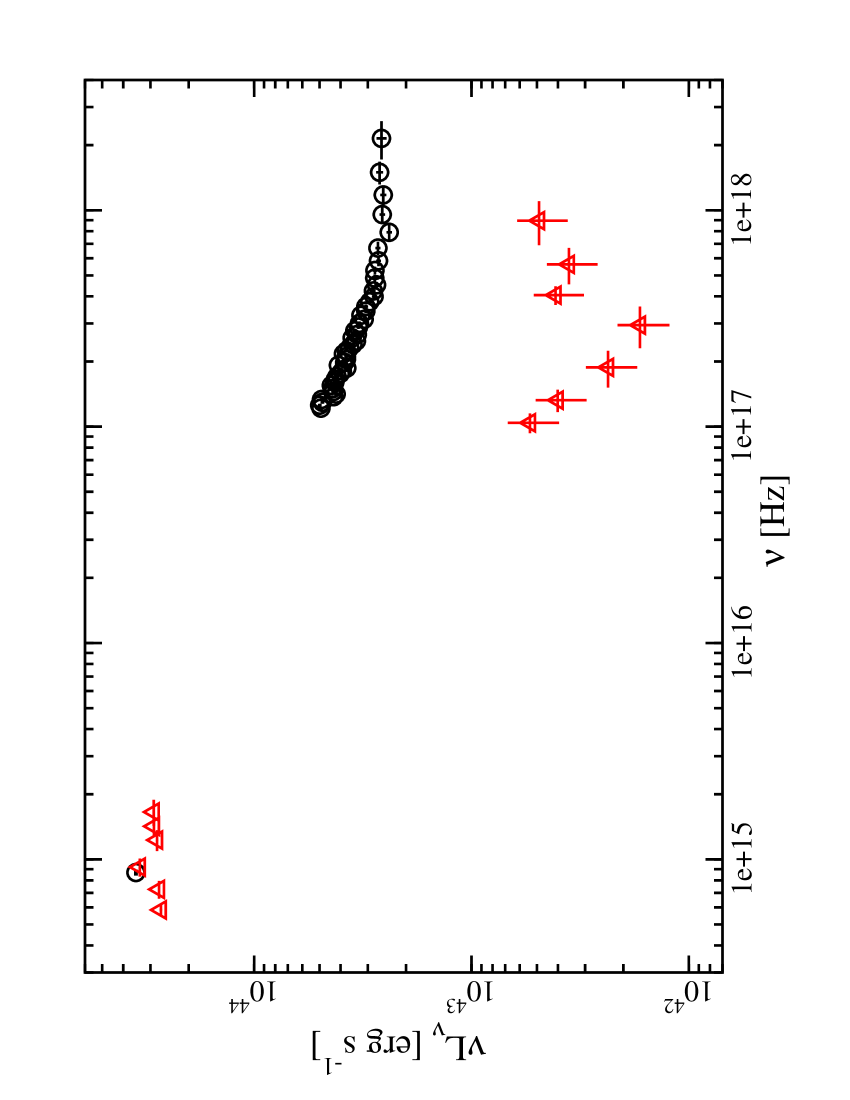
In March 2009, Swift detected a substantially lower X-ray flux, while no significant change was measured in the optical. Consequently the measured was steeper () and the object was in an X-ray weak state. In Figure 1 the UV/X-ray SED of PG 0844+349 in 2000 and March 2009 (i.e. 2009a) is shown. The follow-up Swift observation in April 2009 revealed similar fluxes indicating a continued X-ray low state so an XMM-Newton Target of Opportunity (ToO) was triggered. XMM-Newton also caught PG 0844+349 in an X-ray weak state. The measured UV-to-X-ray slope during this observations was and (where is the difference between the measured and expected ; Just et al. 2007). Following Grupe et al. (2010), the Eddington ratio is during both X-ray weak and normal states.
3.2 X-ray variability
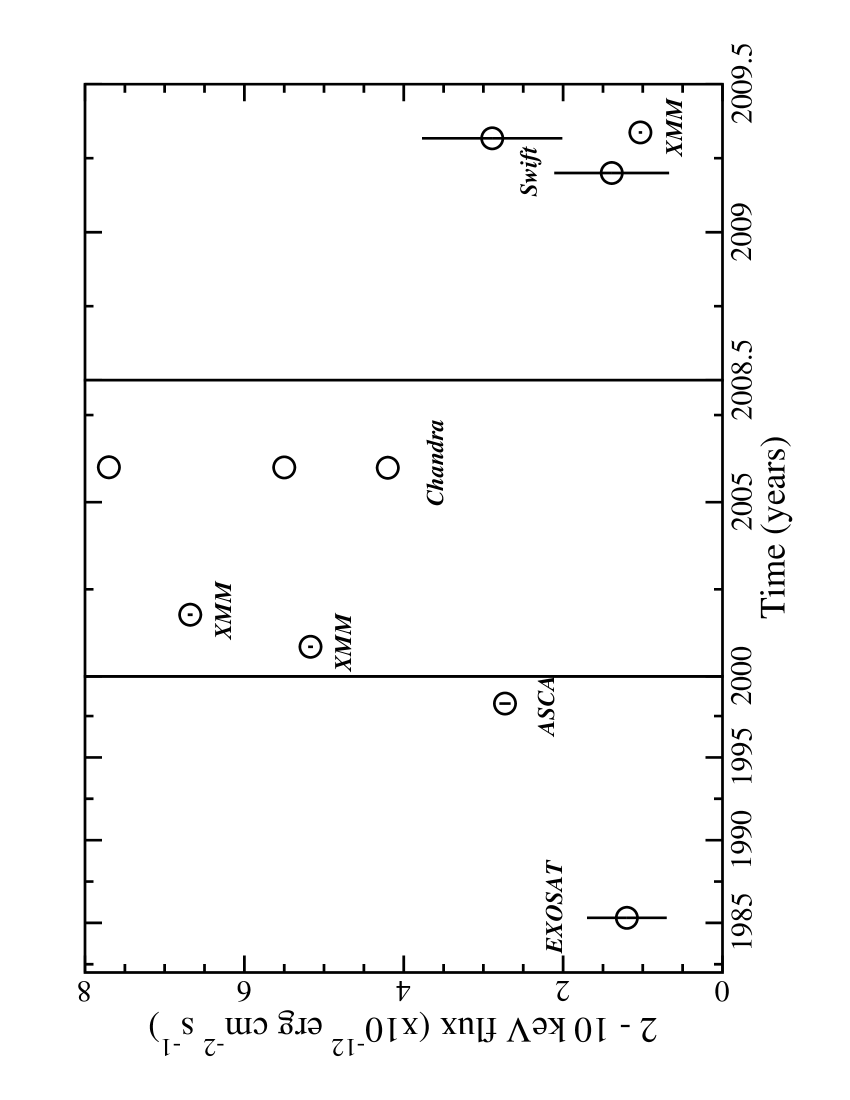
Presented in Figure 2 is the flux of PG 0844+349 from all observations over the last 25 years. The light curve shows substantial variability and demonstrates that departures into the X-ray low-flux state are common for PG 0844+349. Not included in the figure are the ROSAT data, which also show a factor of variability at low energies () in observations separated by about 6-months (Rachen et al. 1996; Wang et al. 2000). Similar fluctuations are seen in the XMM-Newton data at energies between .
The X-ray spectral variability from X-ray high- to weak- state are depicted in Figure 3.
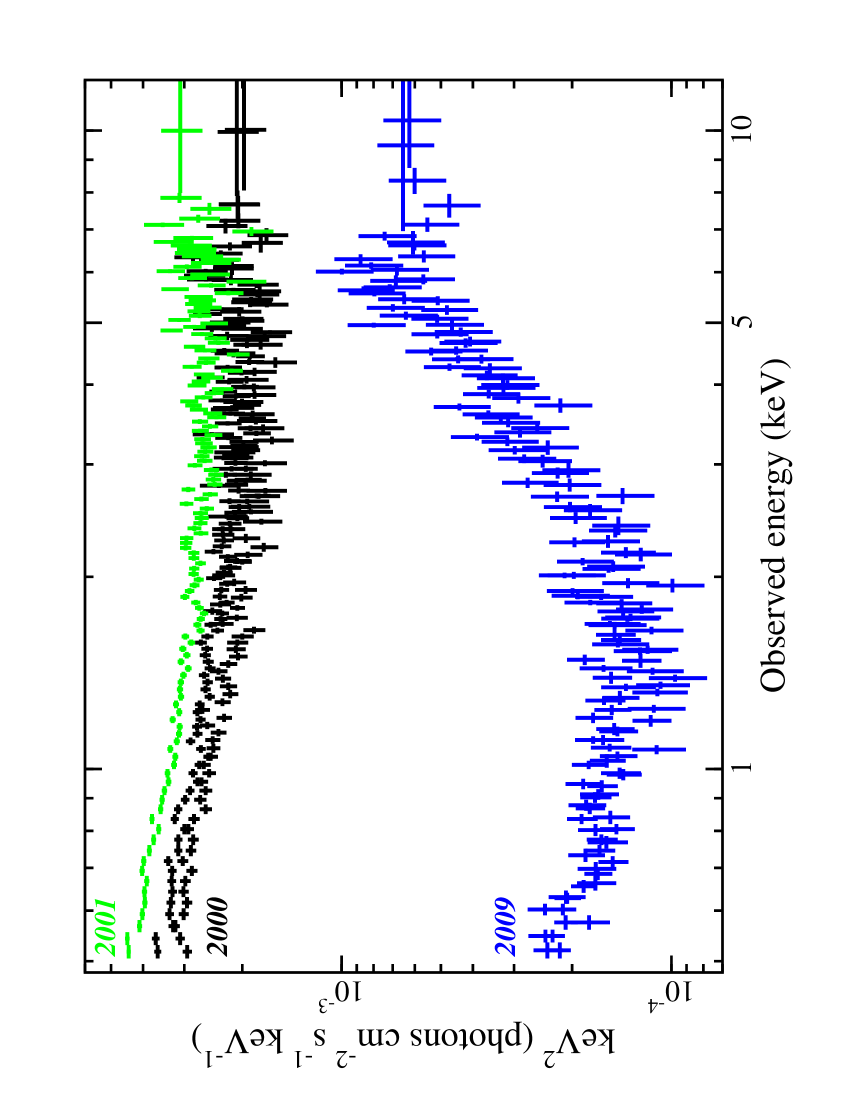
The high-flux states show a rather smooth spectrum across the entire energy band. In contrast the low-flux state exhibits substantial hardening and at lower energies PG 0844+349 is an order of magnitude dimmer than in the high-flux state. The difference spectrum between the high (2000) and low (2009) states is computed revealing the shape of the variable component. This spectrum is fit well with a power law () between , but deviates significantly when the fit is extrapolated to lower energies (Figure 4). The variable component cannot be fit by a single power law across the entire band, thus indicating there is at least another component contributing to the long-term variability.
In combination with the ROSAT analysis by Wang et al. (2000), the low-energy flux variations may be generally more significant in PG 0844+349 than at high energies.
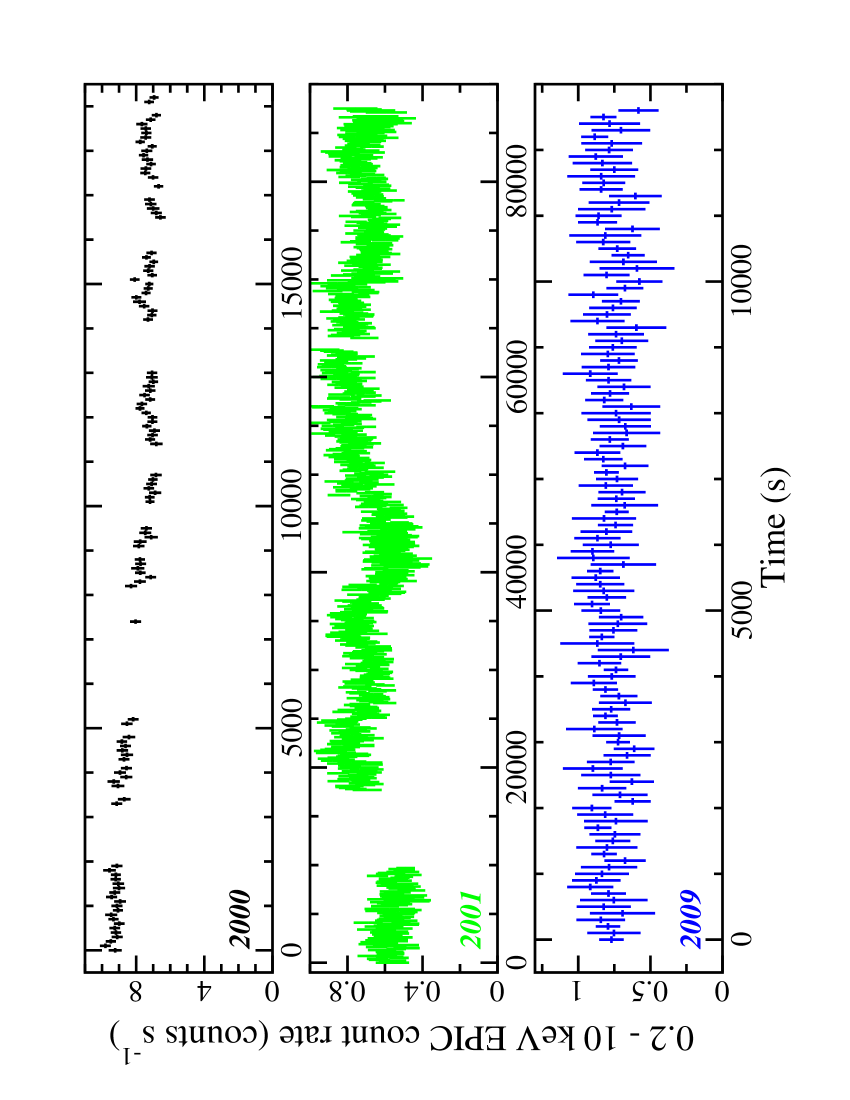
The combined EPIC light curve from each XMM-Newton observations is shown in Figure 5. Flux variations on rapid time scales (e.g. ) are present in the longer and higher signal-to-noise light curves composing the two high state observations. During the low-flux state the AGN is constant on the per cent level.
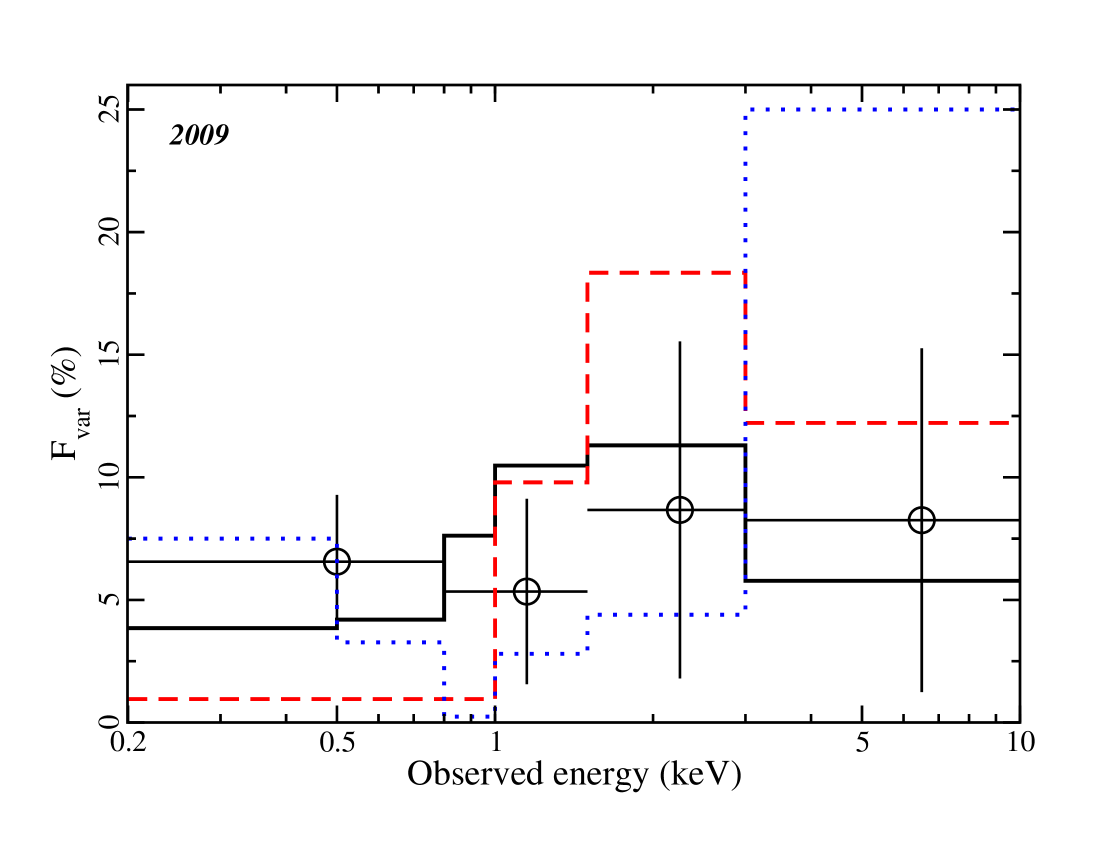
Spectral variability is examined for in the longest observation (2001) and in the low-flux state (2009) by calculating the fractional variability () at various energies (e.g. Ponti et al. 2004). In 2001 PG 0844+349 was in a high-flux state corresponding to the brightest smooth spectrum (green data) in Figure 3. The spectral variability is modest, but there is a trend of increasing amplitude with energy. The 2009 data are of lower quality as the variability is small and the observation is short. There is no detectable spectral variability within about per cent. The spectra are presented and discussed further in Section 5 and Figure 10.
Hardness ratio variability curves in various energy bands during the 2001 epoch show modest to low fluctuations with time. There also appears to be no significant correlation between hardness ratio fluctuations and count rate. Similar conclusions were reached by Brinkmann et al. (2006).
3.3 Phenomological X-ray spectral model
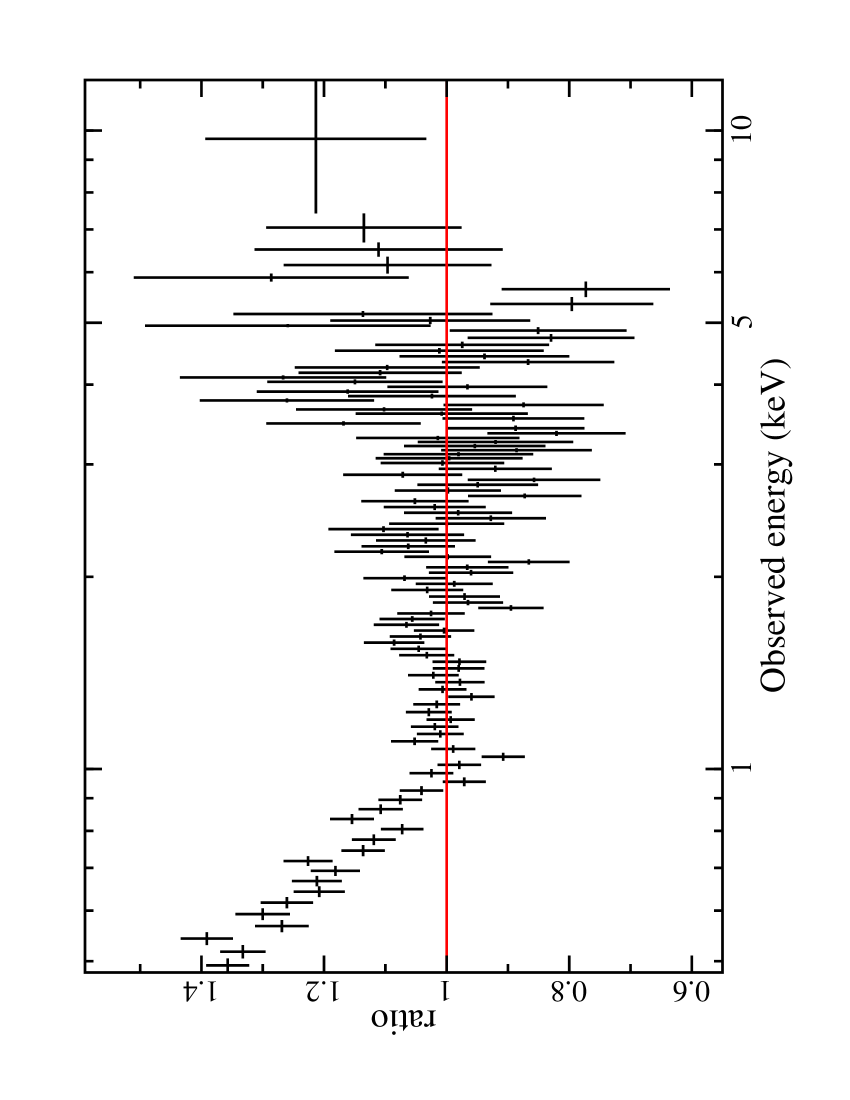
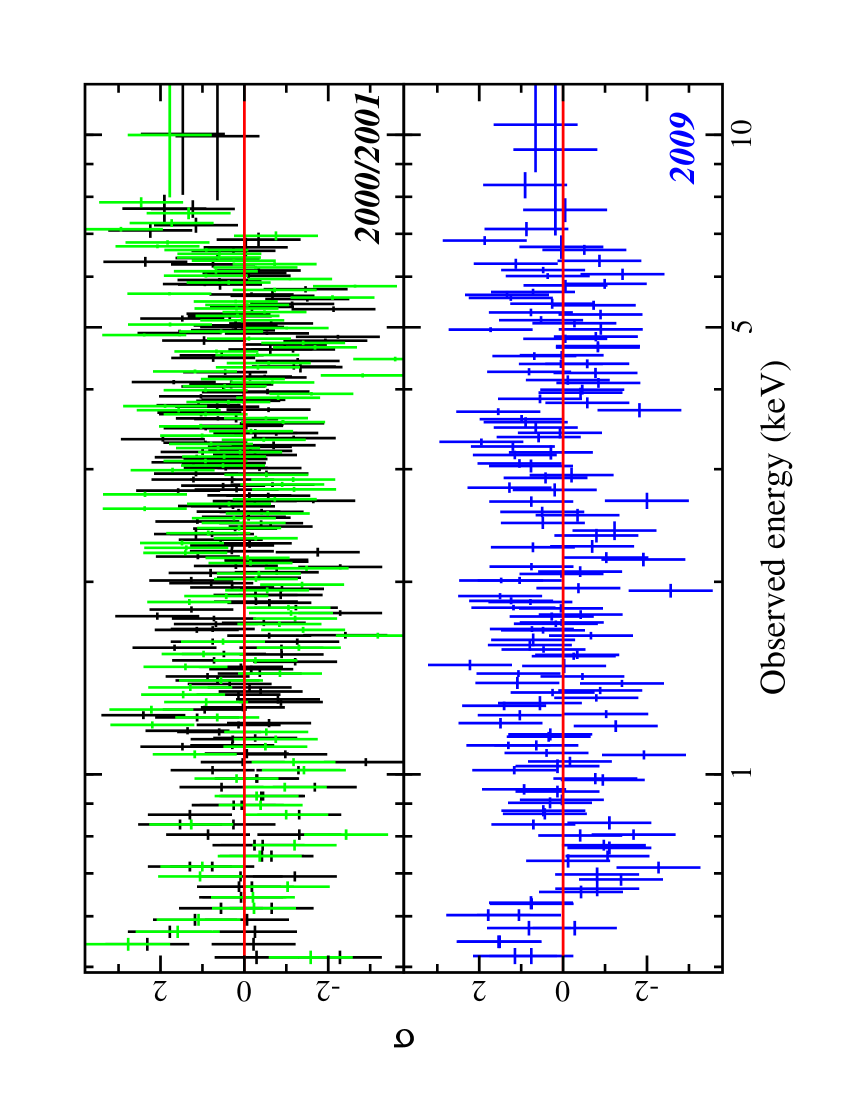
In this section we attempt to fit the spectra of PG 0844+349 with phenomological AGN models. Fitting a power law modified by Galactic absorption to the and band, and then extrapolating over the band generates the residuals seen in Figure 6. In the high-flux states the power law describes the data well above and positive residuals are seen above the power law below (i.e. the soft excess).
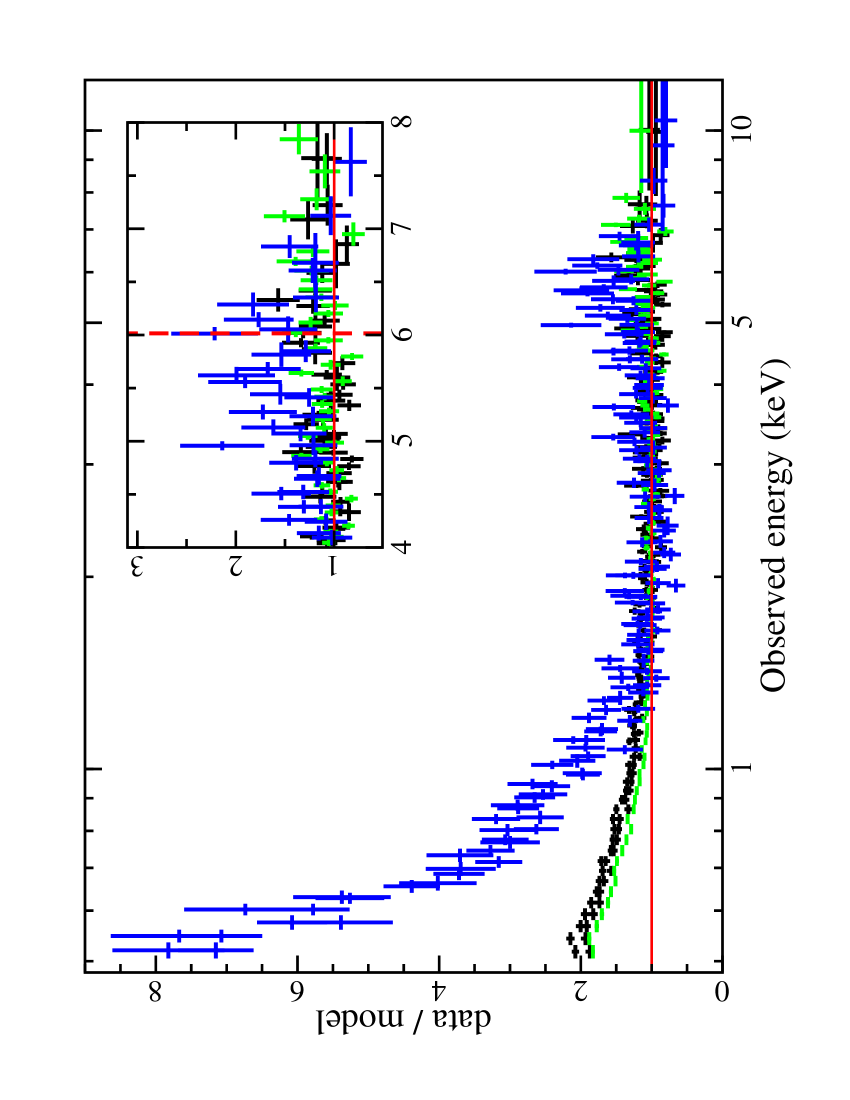
In 2009 the photon index of the power law fit is much flatter then in the high-flux state and the soft excess appears much stronger. There are also significant excess residuals between owing to the prominent spectral curvature in the low-flux state.
The soft excess is well fitted with a black body in addition to the underlying power law. The best-fit temperature is comparable in the high-flux states: in 2000 and in 2001; but significantly higher in 2009 (). All the temperatures fall in the typical range exhibited by unabsorbed AGN (e.g. Gierliński & Done 2004; Crummy et al. 2006). The measured temperature is not correlated in an obvious manner with the black body luminosity (e.g. the highest temperature corresponds to the intermediate luminosity) and a standard thermal accretion disc origin for the soft excess is unlikely.
A narrow () Gaussian profile is added to the fit to search for Fe K emission at arising from distant material (e.g. the torus). A marginal improvement over the power law model is seen at each epoch including such a feature, and the measured energies and fluxes are consistent at all epochs. Fitting a common feature at all epochs provides the most significant detection (Table LABEL:tab:gauss). When permitting the width of the line to vary, the fit prefers a broad feature likely compensating for spectral curvature and/or emission due to He- and H-like iron. While these high-ionisation lines may very well be present, they would not account for the excess flux at . Our measurements of energy and flux are consistent with the recent analysis of Shu et al. (2010) who detected a significant emission line in one-third of a Chandra HETG observation of PG 0844+349.
| (1) | (2) | (3) | (4) | (5) |
|---|---|---|---|---|
| Parameter | 2000 | 2001 | 2009 | Combined |
| ( keV) | ||||
| log | ||||
4 Multi-epoch spectral analysis of PG 0844+349
| (1) | (2) | (3) | (4) | (5) | (6) |
| Model | Model Component | Model Parameter | 2000 | 2001 | 2009 |
| Blurred reflection | Power law | ||||
| log | |||||
| Blurring | |||||
| () | |||||
| () | |||||
| (∘) | |||||
| Reflection | () | ||||
| (Fe/solar) | |||||
| log | |||||
| Narrow Lines | (keV) | ||||
| (keV) | |||||
| (eV) | |||||
| log | |||||
| Fit Quality | |||||
| Double Neutral | Power law | ||||
| partial covering | log | ||||
| Absorber 1 | () | ||||
| Absorber 2 | () | ||||
| Narrow Lines | (keV) | ||||
| (keV) | |||||
| (eV) | |||||
| log | |||||
| Fit Quality | |||||
| Single Ionised | Power law | ||||
| partial covering | log | ||||
| Absorber 1 | () | ||||
| log | |||||
| Narrow Lines | (keV) | ||||
| (keV) | |||||
| (eV) | |||||
| log | |||||
| Fit Quality | |||||
| Double Ionised | Power law | ||||
| partial covering | log | ||||
| Absorber 1 | () | ||||
| log | |||||
| Absorber 2 | () | ||||
| log | |||||
| Narrow Lines | (keV) | ||||
| (keV) | |||||
| (eV) | |||||
| log | |||||
| Fit Quality |
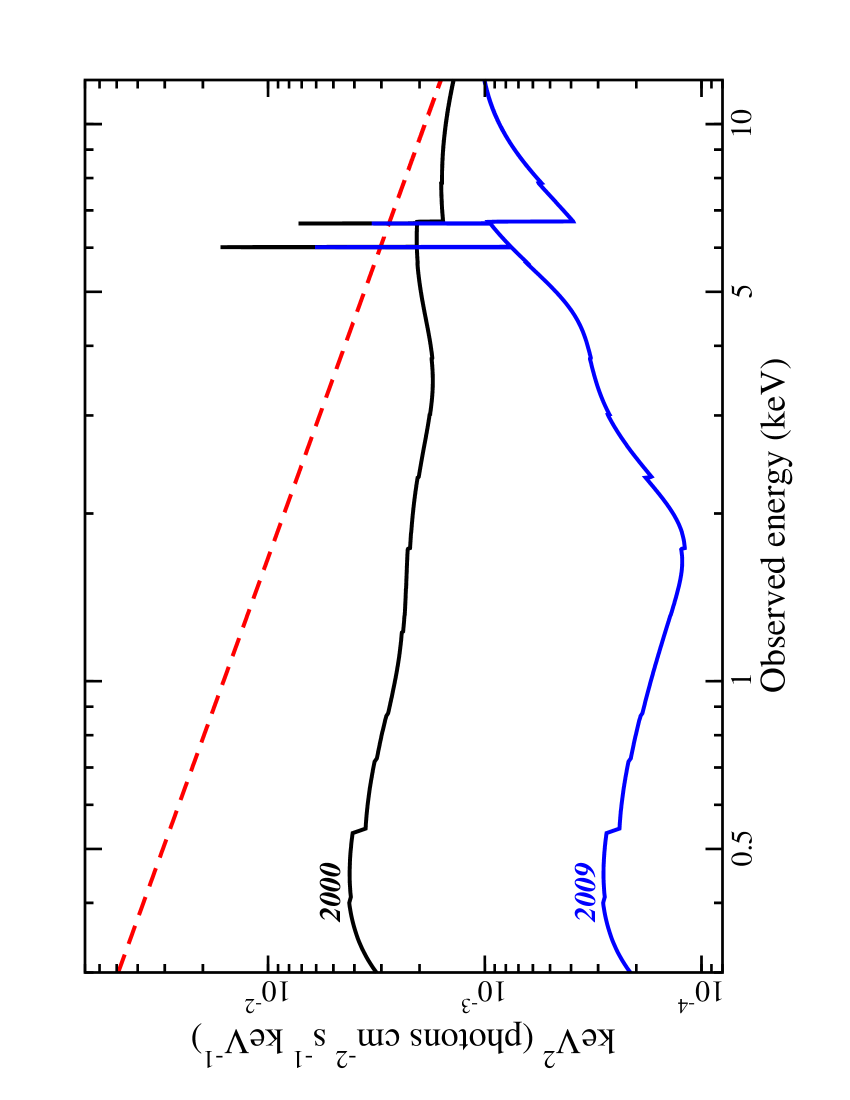
The spectral changes from high- to low-flux state in PG 0844+349 are significant (e.g. Figure 3). In this section we will attempt to model the entire data set with more physical models and in a self consistent manner. In shape, the low-flux spectrum of PG 0844+349 is reminiscent of other AGNs caught in a low-flux state (e.g. 1H 0707–495 and Mrk 335). The spectrum of such objects being modelled by blurred reflection or some form of partial covering. All models include two narrow Gaussian profiles with fixed energies and widths () that account for distant Fe K () detected here and with Chandra (Shu et al. 2010), and the undetected but expected Fe K () emission line. The normalisation of the Fe K feature is fixed to 0.17 that of the Fe K. All models and parameters are shown in Table LABEL:tab:fits. Based on the statistically best-fit model (i.e. the ionised disc reflection) the luminosities of PG 0844+349 (corrected for Galactic column density) are and in the low- and high-flux state, respectively. The corresponding luminosities in the low and high state are and , respectively.
4.1 Ionised disc reflection
Reflection from an ionised disc blurred for relativistic effects close to the black hole is often adopted to describe the origin of the soft excess (Ross & Fabian 2005; Ballantyne et al. 2001), and has been successfully fitted to the spectra of unabsorbed AGN (e.g. Fabian et al. 2004; Crummy et al. 2006). In particular, the spectral complexity seen in the X-ray weak state can be attributed to a reflection dominated spectrum. That is when the direct power law component seen by the observer is significantly diminished due to obscuration (e.g. Fabian et al. 2002) or light bending (Miniutti &Fabian 2004).
An intrinsic power law continuum plus blurred (kdblur) reflection model is fit to the data of PG 0844+349. The use of multi-epoch data permits linking of parameters that are not expected to vary over observable periods, for example: disc inclination (), iron abundance (), outer disc radius (). To further simplify the fitting process the inner () and outer disc radius are fixed at and , respectively (). Allowing these parameters to vary reproduced similar values, but did not significantly improve the fit quality. The only blurring parameter allowed to vary at each epoch is the emissivity profile of the disc, which is a power law in radius (). The ionisation parameter of the disc (, where is the hydrogen number density and is the distance between the ionising source and the material), power law continuum ( and normalisation) and normalisation of the reflector are permitted to vary at each epoch.
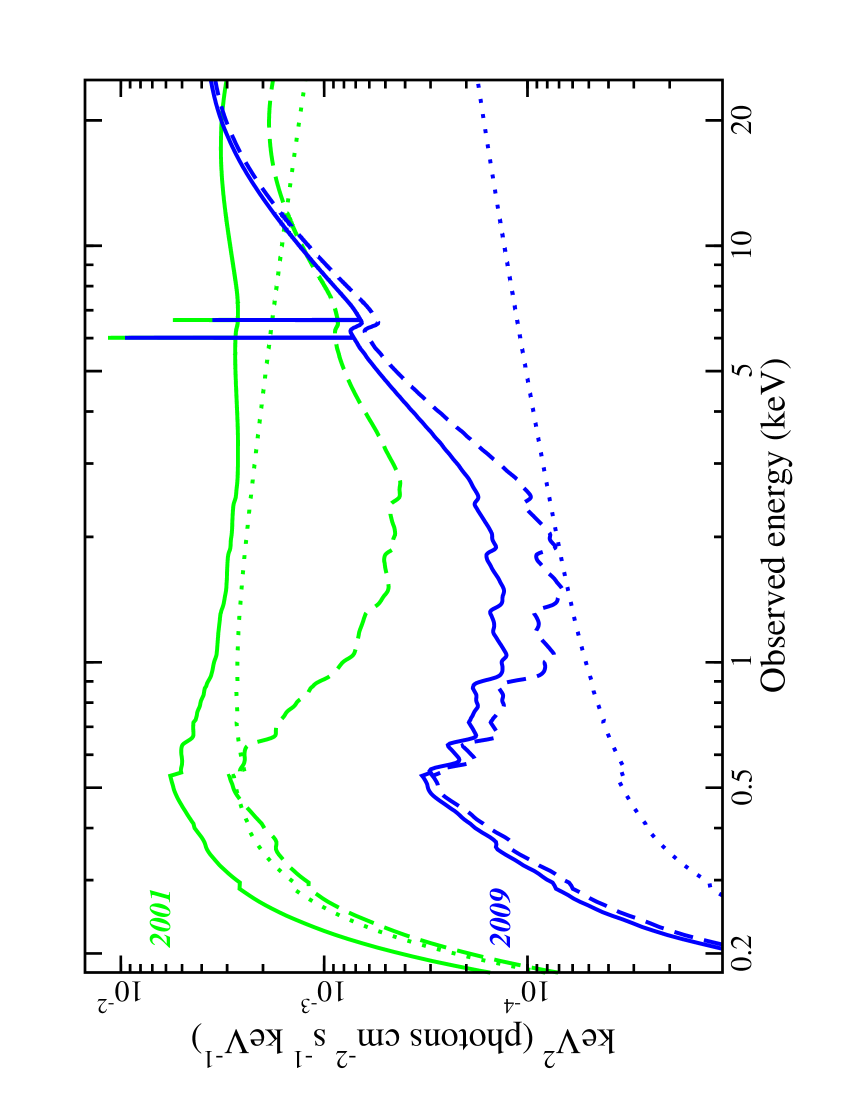
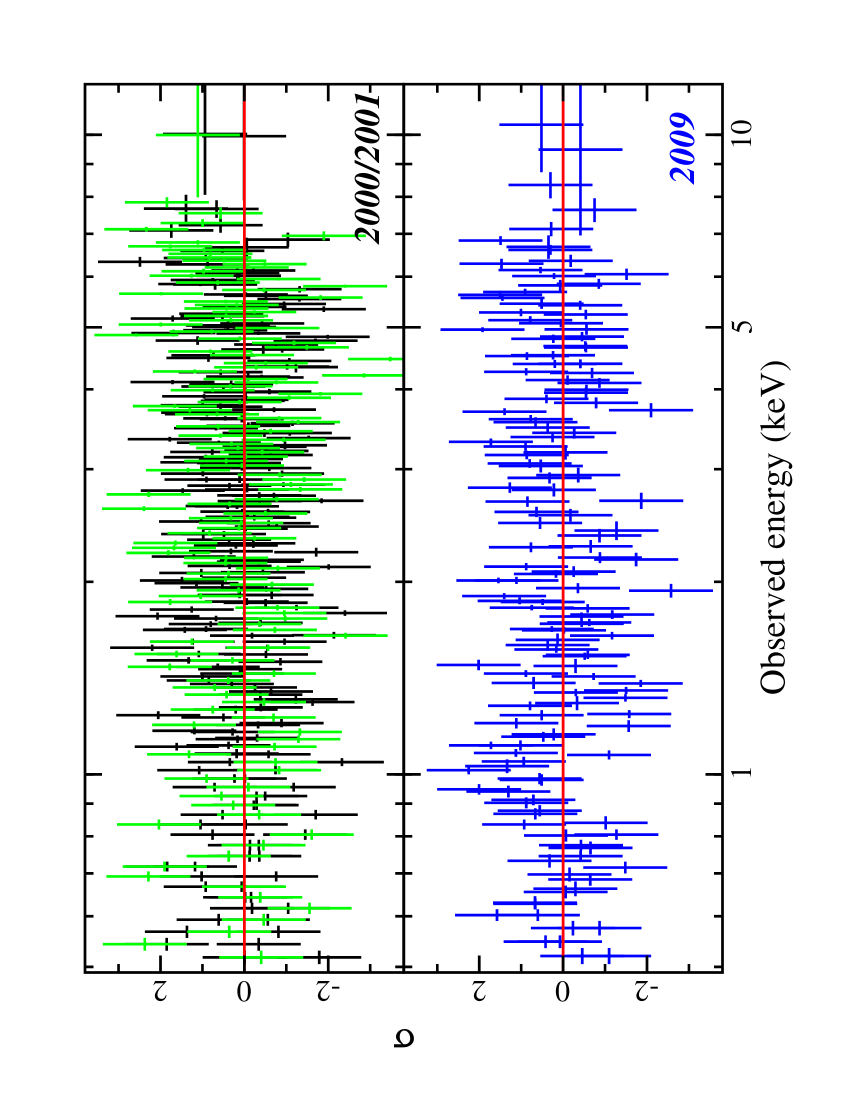
The model provides a good fit to the spectra at all three epochs (; Figure 7), and can be considered self-consistent. While there are several parameters that fluctuate from epoch-to-epoch the primary driver is the diminishing of the power law normalisation from high- to low-flux. Indeed, during the X-ray weak state the X-ray spectrum of PG 0844+349 is dominated by the reflection component (Figure 7, upper panel). We estimate the reflection fraction () at each epoch by comparing the expected model above (where ionisation and absorption effects are minimum) with the pexrav model in XSPEC (Magdziarz & Zdziarski 1995). During the high-flux state , commensurate with an isotropic emitter. In the X-ray weak state, indicating that extreme effects, such as light bending, may be at play.
The models also show a flattening of the power law slope from high- to low-state. While some variability is expected in the shape of the power law with time, the change measured here is rather significant and difficult to reconcile. Similar behaviour was noted in another AGN, Mrk 79 (Gallo et al. 2010).
4.2 Neutral partial covering
We consider a scenario where the intrinsic power law continuum is partially obscured by a neutral absorber along the line-of-sight (e.g. Grupe et al. 2004, Gallo et al. 2004). In this picture, the observed spectrum is the combination of direct emission from the power law emitter and a highly obscured component. Since a significant amount of time passes between observations, we allow for both intrinsic continuum changes (i.e. changes in the power law shape and luminosity) and changes in the characteristics of the absorber [i.e. column density () and covering fraction ()]. The simplest case of a single absorber results in a poor fit () and supports the addition of a second partial covering absorber (i.e. neutral double partial covering). The double partial covering model is akin to two distinct absorbing regions or a column density gradient along the line-of-sight (e.g. Tanaka et al. 2004).
The fit is significantly improved () with the addition of the second absorber. The model parameters and fit quality are shown in Table LABEL:tab:fits and Figure 8 (top panel), respectively. The two absorbers have similar characteristics during the high-state observations (2000 and 2001) and together obscure about per cent of the power law light. To account for the low-flux state the column density and covering fraction of both absorbers increase, and together diminish the source flux in the band by about per cent. We also note that the intrinsic power law flux dropped by about per cent in 2009 from its 2001 high. Noteworthy is the particularly steep spectrum that is required for the continuum () at each epoch.
A statistically worse, but not unreasonable fit, can be obtain by maintaining the shape and luminosity of the primary power law constant at all three epochs (; Figure 9). In this case, variations in the nature (covering fraction and column density) of the absorber account for the long-term variations in the shape and flux of the spectrum. The intrinsic luminosity of the power law in the band is . The power law photon index remains steep ().
4.3 Ionised partial covering
A modification of the partial covering model discussed above is to consider an absorber that is ionised (Reeves et al. 2008) rather than neutral. The ionised material will preferentially absorb intermediate energy X-rays giving rise to the different spectral slopes on either side of .
A single ionised absorber partially covering the primary continuum is a considerably better fit than the single neutral absorber (), but significantly worse than the neutral double partial covering and ionised reflection models. The addition of a second ionised absorber was attempted to improve the fit. In initial fits the ionisation parameter of the second absorber was comparable at all three epochs so it was linked in subsequent fits. The improvement over the single ionised absorber was substantial ( for 7 additional parameters). The fit residuals are displayed in Figure 8. Notably, the ionisation of the absorber does not follow the predicted flux of the continuum as would be expected if the power law is the sole source of ionisation for the absorber and if the absorber was of high density.
The two absorbers collectively obscure about per cent of the power law continuum in the high-state and about per cent in the low-flux state. The moderately low ionisation parameters predicted with this model will produce a spectrum rich in absorption features that should be detectable in high-resolution spectra even in the high-state. An analysis of the 2000 XMM-Newton data (including the RGS) by Pounds et al. (2003) resulted in claims of highly blue-shifted absorption lines due to a high-velocity outflow, but was later dismissed by Brinkmann et al. (2006).
Similar to the neutral partial covering, the long-term variations could be modelled with a constant power law and varying absorption parameters. The fit is slightly worse than that presented above () and the intrinsic power law is again steep ().
5 Discussion
In the X-ray weak state PG 0844+349 shows considerable spectral hardening and curvature compared to the relatively smooth spectrum during the bright state. Blurred ionised reflection models fit the multi-epoch spectra very well in a self-consistent manner. Partial covering models, with either neutral or ionised absorbers, also work reasonably well. The reflection and absorption models appear spectroscopically similar in the band, but each model appears different at higher energies and predict different temporal behaviour.
In the blurred reflection model the principle difference between the high- and low-state is the prominence of the direct power law continuum reaching the observer. There is more than a factor of difference in the power law flux between the high- and low-state. In fact, during the low-state the reflection component dominates the EPIC spectrum and the measured reflection fraction is . The attenuation of the direct power law flux could be attributed to obscuring of the component (e.g. Fabian et al. 2002) or by light bending effects (Miniutti & Fabian 2004).
In addition, the reflection models also indicate variations in the flux and ionisation of the reflection component. These changes are manifested in a model-independent way in the difference spectrum (Figure 4). Rather than being a simple power law (characteristic of normalisation changes alone), the difference spectrum has a soft excess. Ionisations changes in the reflection component would modify the soft excess.
The light bending scenario makes specific predictions about the rapid temporal behaviour of the power law and reflection components in various flux states that can in turn be tested. In examining the 2001 spectrum (Figure 10 left panel) we consider a situation where the power law component fluctuates in brightness and dominates the variability (i.e. the reflection component varies very little in comparison). Such conditions are expected from the light bending model when the AGN is in the bright state (Miniutti & Fabian 2004). Such a model agrees well with the data of PG 0844+349 (Figure 10 left panel).
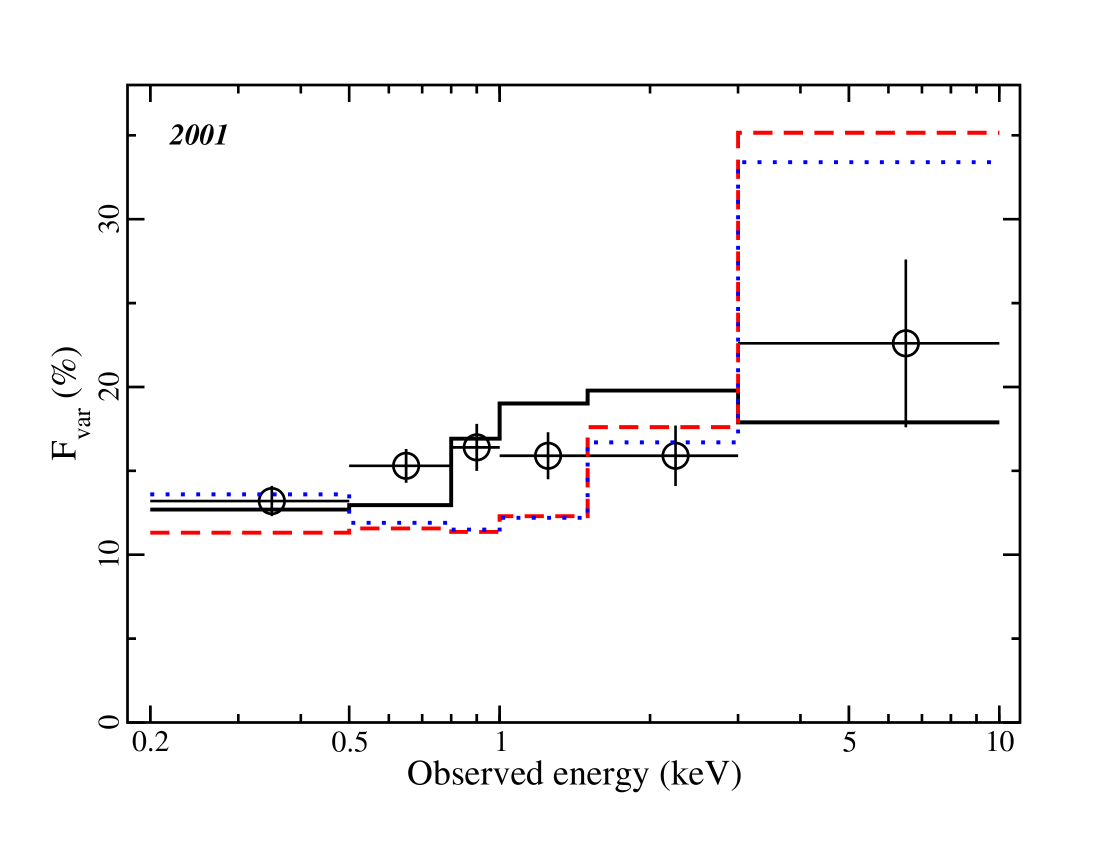
Likewise, the expected based on the partial covering models is also shown in Figure 10. The models are adequate given the signal-to-noise, but both models clearly miss the data in some energy bins. The absorption models likely require variability of an additional parameter to reconcile the . Gierliński & Done (2006) consider changes in the ionisation parameter of the absorber (in addition to power law flux) to reconstruct the of some sources that show the recognised peak at intermediate energies.
In a similar fashion we conducted the same exercise for PG 0844+349 in the low-flux state (right panel Figure 10). The spectrum is of lower quality than the 2001 observation as the amplitude of the variations is low and the observation is short, and consequently no model can be ruled out with statistical certainty. However, we note that the models predict significantly different behaviour and with a longer low-flux observation (and higher signal-to-noise) the models could potentially be distinguished.
If due to partial covering, the simultaneous UV/X-ray data could potentially place some restrictions on the geometry of the system depending on the nature of the absorber. The UV observations (all longward of the Lyman limit) do not appear to exhibit diminishing flux as the X-rays do. The fact that we do not see UV variability simultaneous with the X-rays implies that any partial covering absorber, if present, has to be dust-free and confined to the X-ray emitting region. This requires the existence of very dense, cold blobs that are a substantial fraction of the source size, occupying a small region close to the source. Ostensibly this would imply the presence of a strong iron fluorescence line that is not observed in the data. Such a strong feature would be detectable unless the covering fraction was small or in a rather contrived geometry (see Reynolds et al. 2009 and Miller et al. 2010 for opposing opinions).
The UV spectrum of PG 0844+349 also displays relatively weak Civ absorption (Brandt et al. 2000). The feature is expected to be much stronger if the X-ray weak state of PG 0844+349 were due to absorption from a BAL-related phenomenon (Brandt et al. 2000). UV spectroscopy of PG 0844+349 when it is in a X-ray weak state would confirm the absence of a BAL absorber.
The inferred intrinsic photon index measured in PG 0844+349 is steeper than the canonical value of that is normally adopted (e.g. Nandra & Pounds 1994). This seems to be independent of the model used and the flux-state of the AGN (except for the 2009 blurred reflection interpretation, see Sect. 4.1). There are potential explanations for this, for example if due to Comptonisation PG 0844+349 could have a cooler corona than the average AGN leading to a steeper spectrum. It is difficult to put this in to context of the NLS1/BLS1 nature of PG 0844+349. NLS1s are known to exhibit steeper spectra than BLS1 (e.g. Boller et al. 1996; Brandt et al. 1997), but this is only based on the observed spectrum that is modified by reflection and warm absorption. A true comparison of the intrinsic NLS1 and BLS1 photon index to examine for physical difference between the two classes is still lacking. However, in the near future, as BAT detections become more significant and hard X-ray imaging becomes possible, we will be in position to answer this question.
Each model has unique spectral signatures that could be discerned with higher spectral resolution or broader energy bandpass. The ionised absorber predicts absorption features in the spectra at due to various transitions in iron. Such features may be lost in the EPIC data due to the moderate spectral resolution. However, Shu et al. (2010) present the Chandra HETG spectrum of PG 0844+349 when it was in a comparable flux state as the 2000 and 2001 XMM-Newton observations. The HETG spectrum is of modest quality, but shows no indication of absorption features in the iron region (see figure 1 of Shu et al. ). A higher signal-to-noise HETG spectrum could potential constrain such features.
Finally, all three models make vastly different predictions of the spectral shape and flux above . The absorption models have steeper intrinsic spectra () and a weaker reflection component, whereas the blurred reflection model predicts a much flatter spectrum. The reflection model also predicts a flux that is twice as large in the high-state and greater in the low-state than the absorption models. Based on our models, the brightest flux reached by PG 0844+349 in the band is and fluctuates to lower fluxes. This peak value is still a factor of 2 lower than the current detection limit of the Swift BAT survey (Tueller et al. 2010).
Through multi-epoch X-ray observations the reflection-dominated low-state spectrum of PG 0844+349 appears more clearly. Similar observations of several other AGN also support the notion that the AGN X-ray low-flux state may be due to a diminished power law that in turn reveals the underlying reflection spectrum. Multi-epoch observations are necessary to distinguish between competing models. Placing constraints on the nature of the long-term spectral variability is educative and feasible with current instruments.
6 Summary
A XMM-Newton ToO observation of the Seyfert 1 PG 0844+349 was triggered when it was discovered with Swift in 2009 that the AGN was in an X-ray weak state. Here we conducted an analysis of the X-ray spectrum and the long-term variability by combining data of the AGN from previous epochs when it was in a bright state.
PG 0844+349 is fitted with various physical models (blurred reflection and partial covering). While no model is conclusively dismissed the blurred reflection model nicely describes the long- and short-term variability in a consistent manner. The two classes of models predict distinguishing characteristics that could be revealed with deeper observations (i.e. high signal-to-noise and broader energy band) of PG 0844+349 in the low-flux state with current X-ray observatories. In the future, such observations will be much simpler. The high-energy imaging capabilities and calorimeter resolution of Astro-H and IXO will provide the opportunity to simultaneously measure the broadband spectrum while achieving high spectral resolution below , and NuSTAR will be the first to image the high-energy band.
Acknowledgments
Thanks to Neil Gehrels for approving the Swift ToO request. Swift at PSU is supported by NASA contract NAS5-00136. The XMM-Newton project is an ESA Science Mission with instruments and contributions directly funded by ESA Member States and the USA (NASA). We are grateful to the XMM-Newton observing team for preparing and activating the ToO. We thank the referee for helpful comments and input. This research has made use of the NASA/IPAC Extragalactic Database (NED) which is operated by the Jet Propulsion Laboratory, Caltech, under contract with the National Aeronautics and Space Administration. This research was also supported by NASA contracts NNX07AH67G and NNX09AN12G (D.G.).
References
- [1] Arnaud K., 1996, in: Astronomical Data Analysis Software and Systems, Jacoby G., Barnes J., eds, ASP Conf. Series Vol. 101, p17
- [2] Bachev R., et al. , 2009, MNRAS, 399, 750
- [3] Ballantyne D. R., Ross R. R., Fabian A. C., 2001, MNRAS, 327 10
- [Ballo et al.(2008)] Ballo L., et al. , 2008, A&A, 483, 137
- [4] Beloborodov A. M., 1999, MNRAS, 510, 123
- [5] Boller Th., Brandt W. N., Fink H. H., 1996, A&A, 305, 53
- [6] Boroson T. A., Green R. F., 1992, ApJS, 80, 109
- [7] Brandt W. N., Mathur S., Elvis M., 1997, MNRAS, 285, 25
- [8] Brandt W. N., Laor A., Wills B. J., 2000, ApJ, 528, 637
- [9] Brinkmann W., Grupe D., Branuardi-Raymont G., Ferrero E., 2003, A&A, 398, 81
- [10] Brinkmann W., Wang T., Grupe D., Raeth C., 2006, A&A, 450, 925
- [Burrows et al. (2005)] Burrows, D., et al., 2005, Space Science Reviews, 120, 165
- [11] Crummy J., Fabian A., Gallo L., Ross R., 2006, MNRAS, 365, 1067
- [12] den Herder J. W. et al. 2001, A&A, 365, 7
- [13] Elvis M., Lockman F. J., Wilkes B. J., 1989, AJ, 97, 777
- [14] Fabian A. C., et al. ., 2009, Nature, 459, 540
- [15] Fabian A. C., Miniutti G., Gallo L. C., Boller Th., Tanaka Y., Vaughan S., Ross, R. R., 2004, MNRAS, 353, 1071
- [16] Fabian A. C., Ballantyne D. R., Merloni A., Vaughan S., Iwasawa K., Boller Th., 2002, MNRAS, 331, 35
- [17] Gallo L. C., Miniutti G., Miller J. M., Brenneman L. W., Fabian A. C., Guainazzi M., Reynolds C. S., 2010, MNRAS in press (arXiv:1009.2987)
- [18] Gallo L. C., 2006, MNRAS, 368, 479
- [19] Gallo L. C., Brandt W. N., Costantini E., Fabian A. C., Iwasawa K., Papadakis I. E., 2007a, MNRAS, 377, 391
- [20] Gallo L. C., Brandt W. N., Costantini E., Fabian A. C., 2007b, MNRAS, 377, 1375
- [Gehrels et al. (2004)] Gehrels, N., et al., 2004, ApJ, 611, 1005
- [21] Gierliński M., Done C., 2004, MNRAS, 349, 7
- [22] Gierliński M., Done C., 2006, MNRAS, 371, 16
- [23] Grupe D., Komossa S., Gallo L. C., 2007, ApJ, 668, 111
- [24] Grupe D., et al. , 2008, ApJ, 681, 982
- [25] Grupe D., Mathur S., Komossa S., 2004, AJ, 127, 3161
- [26] Grupe D., Komossa S., Leighly K. M., Page K. L., 2010, ApJS, 187, 64
- [27] Guainazzi M., 2010, XMM-Newton Calibration Documents (CAL-TN-0018)
- [Hill et al. (2004)] Hill, J.E., et al., 2004, SPIE, 5165, 217
- [28] Jansen F. et al. 2001, A&A, 365, L1
- [29] Just D. W., Brandt W. N., Shemmer O., Steffan A. T., Schneider D. P., Chartas G., Garmire G. P., 2007, ApJ, 665, 1004
- [30] Longinotti A. L., Nucita A., Santos-Lleo M., Guainazzi M., 2008, A&A, 470, 73
- [31] Magdziarz P., Zdziarski A. A., 1995, MNRAS, 273, 837
- [32] Mason K. O. et al. 2001, A&A, 365, 36
- [33] Miller, J. M., 2007, ARA&A, 45, 441
- [34] Miller L., Turner T J., Reeves J. N., 2009, MNRAS, 399, 69
- [35] Miniutti G., Fabian A. C., 2004, MNRAS, 349, 1435
- [36] Miniutti G., Fabian A. C., Brandt W. N., Gallo L. C., Boller Th., 2009, MNRAS, 396, 85
- [37] Nandra K., Pounds K. A., 1994, MNRAS, 268, 405
- [38] Osterbrock D. E., Pogge R. W., 1985, ApJ, 297, 166
- [39] Peterson B. M. et al. 2004, ApJ, 613, 682
- [40] Ponti G., Miniutti G., Cappi M., Maraschi L., Fabian A. C., Iwasawa K., 2006, MNRAS, 368, 903
- [41] Ponti G., et al. , 2010, MNRAS in press (arXiv:0911.1003)
- [Poole et al.(2008)] Poole, T.S., et al., 2008, MNRAS, 383, 627
- [42] Pounds K. A., King A. R., Page K. L., O’Brien P. T., MNRAS, 2003, 346, 1025
- [43] Rachen J. P., Mannheim K., Biermann P., 1996, A&A, 310, 371
- [44] Reynolds C. S., Fabian A. C., Brenneman L. W., Miniutti G., Uttley P., Gallo L. C., MNRAS, 397, 21
- [45] Ross R. R., Fabian A. C., 2005, MNRAS, 358, 211
- [Roming et al. (2005)] Roming, P.W.A., et al., 2005, Space Science Reviews, 120, 95
- [Schartel et al.(2010)] Schartel N., Rodríguez-Pascual P.M., Santos-Lleó M., Jiménez-Bailón E., Ballo L., Piconcelli E., 2010, A&A, 512, 75
- [46] Schlegel D. J., Finkbeiner D. P., Davis M., 1998, ApJ, 500, 525
- [47] Strüder L. et al. 2001, A&A, 365, L18
- [48] Shu X. W., Yaqoob T., Wang J. X., 2010, ApJS, 187, 581
- [49] Tanaka Y., Boller T., Gallo L., Keil R., Ueda Y., 2004, PASJ, 56, 9
- [Tananbaum et al. (1979)] Tananbaum H., et al. , 1979, ApJ, 234, 9
- [50] Tueller J. et al. 2010, ApJS, 186, 378
- [51] Turner, M. J. L. et al. 2001, A&A, 365, 27
- [52] Vasudevan R. V., Fabian A. C., 2009, MNRAS, 392, 1124
- [53] Vaughan S., Uttley P., 2008, MNRAS, 390, 421
- [54] Vignali C. et al. 2008, MNRAS, 388, 761
- [55] Wang T. G., Brinkmann W., Matsuoka M., Wang J. X., Yuan W., 2000, ApJ, 533 113
- [56] Zoghbi A., Fabian A. C., Gallo L. C., 2008, MNRAS, 391, 2003
- [57] Zoghbi A., Fabian A. C., Uttley P., Miniutti G., Gallo L. C., Reynolds C. S., Miller J. M., Ponti G., 2010, MNRAS, 401, 2419