Space Science Division, Naval Research Laboratory, Washington, DC 20375, USA
George Mason University, Fairfax, VA 22030, USA
Université Bordeaux 1, CNRS/IN2P3, Centre d’Études Nucléaires de Bordeaux, Gradignan, CENBG, Chemin du Solarium, BP 120, 33175 Gradignan, France
Department of Astronomy and Radio Astronomy Laboratory, University of California, Berkeley, CA 94720, USA
Laboratoire AIM, CEA-IRFU/CNRS/Université Paris Diderot, Service d’Astrophysique, CEA Saclay, 91191 Gif sur Yvette, France
National Research Council Research Associate, National Academy of Sciences, Washington, DC 20001, USA
W. W. Hansen Experimental Physics Laboratory, Kavli Institute for Particle Astrophysics and Cosmology, Department of Physics and SLAC National Accelerator Laboratory, Stanford University, Stanford, CA 94305, USA
Center for Research and Exploration in Space Science and Technology (CRESST) and NASA Goddard Space Flight Center, Greenbelt, MD 20771, USA
Department of Physics and Department of Astronomy, University of Maryland, College Park, MD 20742, USA
High Performance Technologies, Inc., 11955 Freedom Drive, Reston, VA 20190-5673, USA
Max-Planck-Institut für Radioastronomie, Auf dem Hügel 69, 53121 Bonn, Germany
NASA Goddard Space Flight Center, Greenbelt, MD 20771, USA
Observatoire de Paris-CNRS/LERMA, 77 av. Denfert Rochereau, Paris, 75014, France
Department of Physics and Astronomy, University of Calgary, Calgary, AB, Canada T2N 1N4
National Astronomical Observatories of China, Beijing, 100012, China
11email: smith@cenbg.in2p3.fr
11email: dparent@ssd5.nrl.navy.mil
11email: theureau@cnrs-orleans.fr
PSRs J0248+6021 and J2240+5832: Young pulsars in the northern Galactic plane
Abstract
Context. Pulsars PSR J0248+6021 (with a rotation period ms and spin-down power erg s-1) and PSR J2240+5832 ( ms, erg s-1) were discovered in 1997 with the Nançay radio telescope during a northern Galactic plane survey, using the Navy-Berkeley Pulsar Processor (NBPP) filter bank. The GeV gamma-ray pulsations from both were discovered using the Fermi Large Area Telescope.
Aims. We characterize the neutron star emission using radio and gamma-ray observations, and explore the rich environment of PSR J0248+6021.
Methods. Twelve years of radio timing data, including glitches, with steadily improved instrumentation, such as the Berkeley-Orleans-Nançay pulsar backend, and a gamma-ray data set times larger than previously published allow detailed investigations of these pulsars. Radio polarization data allow comparison with the geometry inferred from gamma-ray emission models.
Results. The two pulsars resemble each other in both radio and gamma-ray data. Both are rare in having a single gamma-ray pulse offset far from the radio peak. The anomalously high dispersion measure for PSR J0248+6021 (DM pc cm-3) is most likely due to its being within the dense, giant HII region W5 in the Perseus arm at a distance of 2 kpc, as opposed to being beyond the edge of the Galaxy as obtained from models of average electron distributions. Its large transverse velocity and the low magnetic field along the line-of-sight favor this small distance. Neither gamma-ray, X-ray, nor optical data yield evidence of a pulsar wind nebula surrounding PSR J0248+6021. We report the discovery of gamma-ray pulsations from PSR J2240+5832. We argue that it could be in the outer arm, although slightly nearer than its DM-derived distance, but that it may be in the Perseus arm at half the distance.
Conclusions. The energy flux and distance yield a gamma-ray luminosity for PSR J0248+6021 of erg s-1. For PSR J2240+5832, we find either erg s-1 if the pulsar is in the outer arm, or erg s-1 for the Perseus arm. These luminosities are consistent with an rule. Comparison of the gamma-ray pulse profiles with model predictions, including the constraints obtained from radio polarization data, implies outer magnetosphere emission. These two pulsars differ mainly by their inclination angles and acceleration gap widths, which in turn explain the observed differences in the gamma-ray peak widths.
1 Introduction
Pulsars PSR J0248+6021 and PSR J2240+5832 were discovered with the Nançay radio telescope (NRT) in a survey of the northern Galactic plane from 1997 to 1999 (Foster et al., 1997). Ray et al. (1999) reported their locations and rotation periods. Twelve years of timing measurements allow us to provide accurate ephemerides, including a proper motion determination for PSR J0248+6021 that helps us understand its relation to the complex of gas clouds co-located on the sky. Polarization data provides geometry constraints in addition to those obtained by comparing the gamma-ray pulse profiles with model predictions.
By coincidence, both pulsars have a high spin-down power erg s-1, making it also likely that they emit in GeV gamma-rays, as discussed by Smith et al. (2008). Indeed, PSR J0248+6021 is among the 46 gamma-ray pulsars described in the “First Pulsar Catalog” (Abdo et al., 2010b) using the Large Area Telescope (LAT) on the Fermi Gamma-ray Space Telescope (formerly GLAST). They have the same magnetic field strengths at the neutron-star light cylinder, , to within 20%, and the characteristic ages differ by only a factor of two. Table 1 lists measured and derived parameters for both pulsars. PSR J2240+5832 has a smaller dispersion measure (DM pc cm-3) than PSR J0248+6021 (DM pc cm-3), and the NE2001 model of the Galactic electron distribution (Cordes & Lazio, 2002) assigns PSR J2240+5832 a distance of kpc, whereas it places PSR J0248+6021 well beyond the edge of the Galaxy ( kpc). Curiously however, it is the nominally closer pulsar, PSR J2240+5832 that pulsates less brightly in the Fermi data.
Two obvious solutions to this seeming paradox are that either there is some intrinsic difference between the pulsars, such as their orientation angles and beaming, or that the distances are simply misunderstood. In this paper, we clarify the situation.
2 Nançay northern Galactic plane survey
The NRT is a meridian instrument, with a primary antenna 200 m wide by 35 m tall, equivalent to a parabolic dish with a 94 m diameter. It can track objects with declinations for roughly one hour around culmination. The half-power beam width at 1.4 GHz is 4 arcmin (east-west) by 22 arcmin (north-south) at , a shape well-adapted to sky scanning. The 1.4 GHz nominal system temperature at the time of these observations was about 50 K in both horizontal and vertical polarizations, for . The “FORT” receiver upgrade from 1999 to 2001 improved sensitivity by a factor of , with an efficiency of K/Jy and a system temperature of 35 K at GHz. The frequency coverage is now continuous from GHz to 3.5 GHz and allows full Stokes measurements (Theureau et al., 2005).
Two pulsar instrumentation systems (“backends”) were used successively, first for the survey and then for the continued timing. The earlier system was the Navy-Berkeley Pulsar Processor (NBPP) filter bank, designed and built for this survey at the Naval Research Laboratory (NRL) in collaboration with the University of California, Berkeley. We set the 96 channels in the full crate to cover MHz/channel, for a total bandwidth of 144 MHz (Backer et al., 1997). The output data has a time resolution of 50 to 100 s in search mode, allowing detection of signals with periods as short as 0.1 ms. For the survey, data were acquired at a sampling rate of 60 s using 4-bit digitization of 96 channels and both polarizations.
Since 2004, the NRT pulsar backend is the BON (Berkeley-Orléans-Nançay) coherent dedispersor with a bandwidth of 128 MHz. A spectrometer digitizes data voltages, followed by four data servers that share the data over a 70-node cluster of personal computers (PCs) running the Linux operating system. In 2009, a GPU-based (Graphics Processor Unit) computer system replaced the PC cluster, with the same computing power in only two nodes. Dedispersion is performed with a special filter in the complex Fourier domain. The timing resolution is a few 100 ns on the most stable millisecond pulsars (Cognard & Theureau, 2006; Cognard et al., 2009).
The NBPP was used to conduct a high-frequency, wide-bandwidth (1280–1430 MHz) pulsar survey of the Galactic plane from 1996 to 1998 (Foster et al., 1996). The search covered longitudes for Galactic latitudes , for a total sky coverage of 1170 square degrees. The survey was optimized to find distant pulsars with periods as short as the theoretical break-up speed of a neutron star. Over 40 000 pointings were acquired, each with an integration time of 2 minutes, for an expected detection of a mJy peak intensity profile after dedispersion. Observations were completed in late 1998. The final data volume is Tbytes.

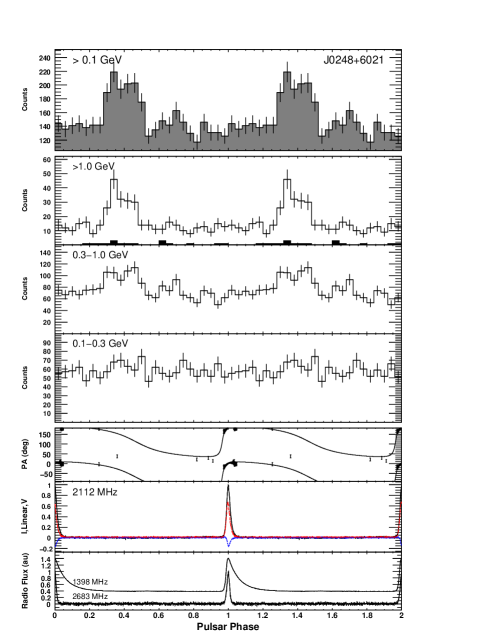
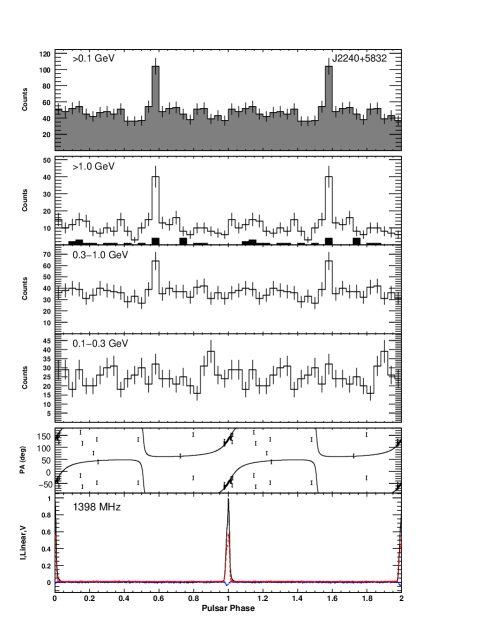
A total of two pulsars were discovered in the survey, during the first 1998 data analysis based on a fast Fourier transform (FFT). Figs. 1 and 2 show multiwavelength pulse profiles for PSRs J0248+6021 and J2240+5832, respectively. Table 1 lists various properties. PSR J0248+6021 has a spin period of 217 ms, with a duty cycle of 12% at 1.4 GHz. A scattering tail is seen at low frequency, as expected from the large DM and confirmed by the observations made at higher frequencies. PSR J2240+5832 has a spin period of 140 ms and the radio peak is even narrower, 7% of a rotation at half-maximum. Relatively few pulsars are known in this direction () and none with such a large DM. It may be one of the few pulsars known in the outer arm of the Galaxy and amongst the most distant known gamma-ray pulsars.
Subsequent FFT re-analysis using the PRESTO package developed by Ransom et al. (2003) identified no additional pulsars. We also used PRESTO to search for single pulses from the entire dataset: raw data were first dedispersed for 250 values ranging from 0 to 500 pc cm-3 keeping the original 60 s resolution. Each time sequence was then searched for single pulses with a signal-to-noise ratio (hereafter S/N) greater than 5. The search used matched filtering with boxcars up to 30 bins allowing good sensitivity up to 1.8 ms pulse width. We clearly detected series of very strong bursts from PSR J0248+6021 at the pulsar DM as shown in Fig. 4. No other single pulse signal was seen, including from PSR J2240+5832. PSR J0248+6021 is thus somewhat rare, in that it seems to burst in a way similar to PSR B0656+14 and RRATs (Rotating Radio Transients, Weltevrede et al., 2006). The single pulse search is confirmed to be complementary to a classical FFT analysis, favoring pulsars with a low average signal strength but having strong bursts.

3 Radio measurements
3.1 Flux density
The radio flux for pulsar profiles obtained with the Nançay coherent dedispersion instrumentation can be accurately measured using a pulsed noise diode. The diode’s counts-to-mJy scaling is obtained from fiducial galaxies. The diode is fired at 3.3 Hz for 15 seconds at the start of each observation, then phase-folded as for a pulsar. Several dozen observations at 1.4, 2.05, and 2.68 GHz were selected for PSR J0248+6021. The 1.4 GHz average value for the mean (i.e., phase-averaged) flux density of mJy is shown in Fig. 5, and a spectral index of is obtained. These values are consistent with those obtained previously using the radiometer equation for both polarization channels, along with the known telescope characteristics ( Jy) and an assumed continuum flux of 6.5 Jy at 1.4 GHz in this sky direction (Reich, 1982), to convert rms noise fluctuations in the off-pulse part of the profile to a Jansky scale.
Fourteen observations for PSR J2240+5832 yield a 1.4 GHz average value for the mean flux density of mJy, and a spectral index of , as also shown in Fig. 5. The sign convention for the radio energy spectral index is the opposite of that used for the gamma-ray photon index (i.e., as compared to as in Equation 2 in Section 5).
3.2 Polarization
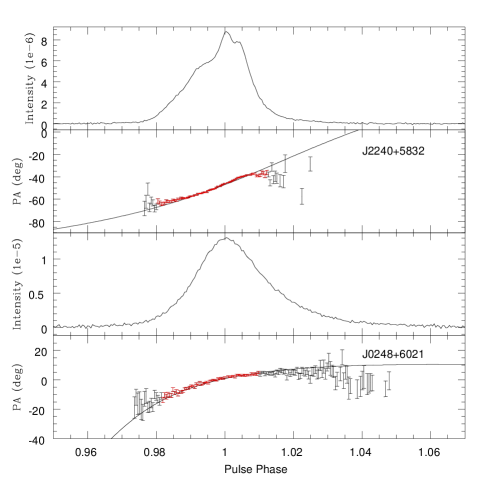
Fig. 3 zooms in on the sweep with phase of the linear polarization position angle (PA) for both pulsars. PA data is shown for all points with a minimum S/N in Figs. 1 and 2. We reduced the data using PSRCHIVE (Hotan et al., 2004). For PSR J0248+6021, we averaged 399 minutes of data from MJD 54851 to 55182, and obtained a rotation measure of rad m-2 ( statistical uncertainties). At inflection, extrapolated to infinite frequency, we obtain PA, shown in Fig. 6 together with the proper motion direction, discussed below. For PSR J2240+5832, we used 846 minutes of 1.4 GHz data recorded from MJD 54866 to 55209, yielding rad m-2 and PA.
We fit the PA and phase data with the rotating vector model (RVM, Radhakrishnan & Cooke, 1969) to estimate the inclination of the neutron-star rotation axis to the line-of-sight to Earth, and the angle between the rotation axis and the magnetic axis. We use only data points with a minimum S/N of . For PSR J0248+6021, the PA sweep inflection point seems to lead the radio peak due to bias induced by the broad scattering tail prominent at GHz. We therefore use the GHz data for the RVM analysis. The fit results still vary with the choice of data in the tail but become stable when we favor the leading edge of the PA swing. We interpret this as a deformation due to residual scattering. We reject the remaining points with phase beyond the peak. The results are robust once the choice to cut the tail is made. The points used for the RVM fit are shown in red in Fig. 3. As usual for RVM fits, the magnetic impact parameter is most strongly constrained, here to . A wide range of from to provides comparably good fits, and acceptable fits extend from to . The best fit has (reduced ).
The narrow radio pulse of PSR J2240+5832 is less affected by scattering: a fit to the 1.4 GHz profile yields (for typical ). Dispersion in the trailing data points causes a poor fit, with a minimum at (reduced ). Comparable fits persist from to , and plausible solutions extend from to .’
The green contours in Figs. 7 and 8 summarize the RVM fit results, while the RVM curves in Fig. 3 show the fit for specific combinations within the favored region. These classic RVM fits assume radio emission at low altitudes. It is becoming increasingly clear (Karastergiou & Johnston, 2007; Ravi et al., 2010) that for many young pulsars, especially the gamma-ray detected pulsars, the radio emission arises at a substantial fraction of the light cylinder radius, . This in turn means that the polarization PA sweeps are offset significantly from the radio pulse (Blaskiewicz et al., 1991), and that more subtle distortions in the PA sweep shape may occur. Self-consistent fitting using large radio altitudes should therefore lead to a shift in the inferred and values.
3.3 Radio timing and proper motions

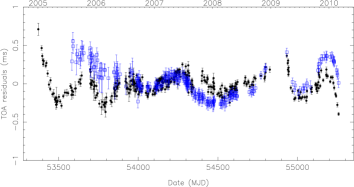
Both pulsars were observed regularly for twelve years with increasingly advanced instrumentation, except for 18 months in 2003-2004 when only the BON prototype with a 16 MHz bandwidth was available. Fig. 9 shows the evolution of the timing precision over the years, and also indicates five principal glitch epochs for PSR J0248+2240. The largest was in March 2009 (MJD 54897.41), where is the rotation frequency and is the permanent pulse frequency increment. The epochs and values for the other four glitches were and . Fig. 10 shows the BON data, including the data used to phase-fold the gamma-ray photons, in greater detail. The timing model includes a first time derivative of the DM (“DM1” variable in TEMPO2). Higher-order DM variations as well as achromatic timing noise can be seen. For PSR J2240+5832, no large glitches were seen, but even after whitening some residual structure due to timing noise remains.
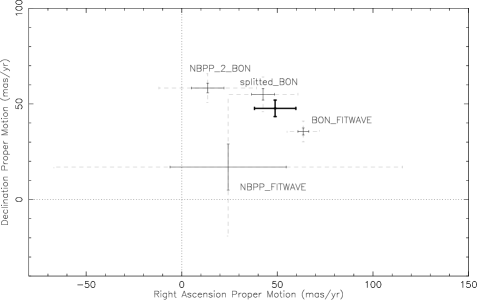
Timing noise biases proper-motion measurement unless care is taken. Different approaches were compared, summarized in Fig. 11, where the labels for the methods are described below. The first two methods compare the position at different epochs with separate data spans, fitting for rotational parameters () and pulsar position. The old NBPP timing data yield a position at MJD 51250, with another position at MJD 53900 from the BON data, for a proper motion of mas yr-1 and mas yr-1 (label NBPP_2_BON). In a similar way, the BON data were divided into two equal parts. Two positions obtained at MJDs 53700 and 54500 indicate a proper motion of mas yr-1 and mas yr-1 (splitted_BON). The two last methods use the harmonic whitening procedure proposed by Hobbs et al. (2004) in their Appendix A. An iterative process using a fit of harmonically related sinusoids (“FITWAVE” in TEMPO2, Edwards et al., 2006) is applied following a strict sequence of different parameter adjustments. This procedure was applied to both the old NBPP and the new BON timing data. The NBPP data give mas yr-1 and mas yr-1 (NBPP_FITWAVE). The new BON timing data imply a proper motion of mas yr-1 and mas yr-1 (BON_FITWAVE).
The error bars shown in Fig. 11 for the successive measurements sometimes do not overlap because systematic biases due to e.g., timing noise or covariances underestimated by the fitting routines, are larger than the statistical uncertainties. We computed a weighted mean proper motion for PSR J0248+6021 based on all the determinations except the NBPP_FITWAVE, which has very large uncertainty and hence constrains little. The mean values mas yr-1 and mas yr-1 were obtained by weighting by the inverse of the uncertainties. The total is mas yr-1 and the celestial position angle is PA .
PSR J2240+5832’s proper motion is roughly half that of the other pulsar. The measured value became stable only after multiple iterations of the method cited above (Hobbs et al., 2004), apparently due to one or two marginally detectable glitches that perturb the fits. We obtained mas yr-1 and mas yr-1 ( mas yr-1 and celestial position angle PA ). The uncertainties are statistical. To be conservative, we assume systematic uncertainties of the same magnitude as those observed for PSR J0248+6021, and thus obtain mas yr-1 (same fractional error) and celestial position angle PA (same absolute value).
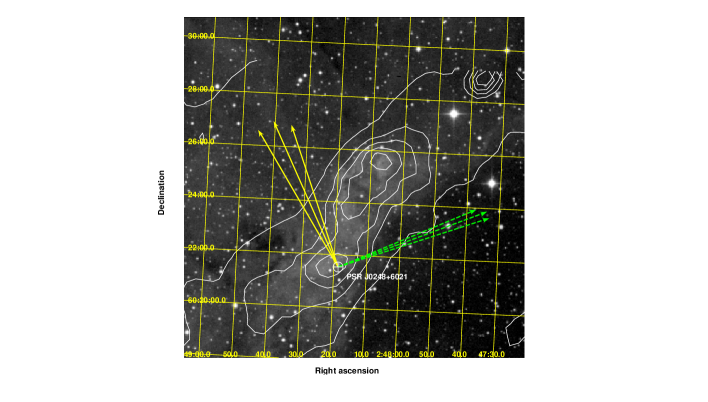
Fig. 6 shows both the proper motion and polarization position angles for PSR J0248+6021. They are roughly perpendicular (difference of ). Johnston et al. (2007) recall that neutron star velocity vectors and spin-axis may naturally become aligned at birth, if the supernova “kick” is preferentially along the spin-axis, and the radio emission is orthogonal to the magnetic field. That paper adds a new sample of measurements for which this scenario appears to hold about half the time, weakening the observational evidence supporting this picture. For PSR J2240+5832, the difference between the velocity and polarization PA’s is : hence, in this new sample of two pulsars, again only half seem to comply with the “rule”.
4 Distances and surroundings
One goal of this work is to compare model predictions of the pulsars’ gamma-ray luminosity with observations. Following the “Atlas” of Watters et al. (2009) and its update (Romani & Watters, 2010), we define
| (1) |
for , the integral gamma-ray energy flux above 100 MeV. The beam correction factor is the ratio of the gamma-ray flux radiated into all space to that along the line-of-sight, both averaged over a neutron star rotation. Most models depend on the inclination and viewing angles as discussed below. The distance is clearly important.
4.1 Dispersion measure, kick velocities, and rotation measures
4.1.1 Distance to PSR J0248+6021
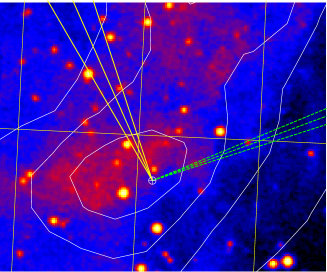
As stated earlier, the DM for PSR J0248+6021 is so large for this line-of-sight (, ) that the NE2001 model places it outside the Galaxy. However, Fig. 6 shows extensive clouds that add to the electron column density and bias the NE2001 distance.
The pulsar lies west of the center of the open cluster IC 1848, which itself lies within the giant HII region W5, the “Soul” nebula in the Galaxy’s Perseus arm. The cluster diameter is (Kharchenko et al., 2005). The pulsar was born southwest of its current position. The heliocentric distance to IC 1848 estimated from both main sequence fitting of the star cluster and a Galactic kinematic model converges towards 2 kpc (Kharchenko et al., 2005). That reference gives no distance uncertainty111See also WEBDA database, http://www.univie.ac.at/webda/. Distance uncertainties for individual stars from other studies, e.g. using photometric measurements (Morgan et al., 2009) do not exceed kpc, and we assume kpc. We now argue that the pulsar is at the distance of the open cluster, i.e., on the near side of W5.
The parallel component of the magnetic field along the line-of-sight to PSR J0248+6021 is G. This matches nicely the expectation from Fig. 6 of Mitra et al. (2003) and therefore the pulsar is most likely within the Perseus arm. From Reid et al. (2009), the far edge of that arm is kpc distant.
The proper motion of PSR J0248+6021 is, with its uncertainty, mas yr-1. The largest measured neutron-star velocities due to supernova “kicks” at birth are of the order of 1000 km s-1 (Hobbs et al., 2005). Thus, if PSR J0248+6021 were beyond kpc it would have an unusually large kick velocity. Conversely, a 2 kpc distance implies a very typical transverse velocity of km s-1. Furthermore, the DM of PSR J0248+6021 increased steadily by cm-3 pc per year from 2006 to 2008, and decreased at the same rate in 2009 and 2010. Fig. 10 shows that the detailed behavior is complex. The simplest interpretation of the DM evolution is that the pulsar is moving rapidly in a dense environment, that is, that the pulsar is in a cloud (conceivably a nearer, invisible cloud).
For the cloud coincident with the pulsar (Fig. 6), the largest velocity (largest Doppler shift) of reliable HI features towards PSR J0248+6021 is km s-1. In light of the known velocity reversal in this part of the Perseus arm (Tian et al., 2010) the cloud is thus between 2 and 3 kpc, like the rest of W5. High resolution H imaging could confirm this preliminary indication.
Towards PSR J0248+6021, the NE2001 model places the edge of the stellar Galactic disk 9 kpc from the Sun, with a DM of cm-3 pc. A dense local environment, as within W5, may explain the large observed electron column density DM cm-3 pc. For 2 kpc, NE2001 predicts DM cm-3 pc, implying an excess of 315 cm-3 pc. The main part of the HII region neighboring the pulsar is a shell of diameter on the sky, equivalent to a true size of 17.5 pc at 2 kpc. This converts into an electron density in the cloud of cm-3. Though large, this is typical of other HII regions, where values from 0.1 to 100 cm -3 are seen (see e.g. Mitra & Ramachandran (2001), for their study of the scatter broadening in the direction of the Gum Nebula). The WISE collaboration (Wright, 2010) released a detailed image of the Heart and Soul nebulae seen between and 22 microns222http://antwrp.gsfc.nasa.gov/apod/ap100601.html. PSR J0248+6021 lies in one of the “thickest” areas, where the shell is seen edge-on and the electron density is surely greater than the average value, indicating again that the large DM is compatible with a small pulsar distance.
The large scattering tail excludes the notion that PSR J0248+6021 may be within the Orion spur, thus only kpc away, because of nearby but invisible electron clouds. To conclude, PSR J0248+6021 is almost certainly in W5, at the distance of IC 1848, and we use kpc.
4.1.2 Distance to PSR J2240+5832
PSR J2240+5832 has DM cm-3 pc and along this line-of-sight (, ) the NE2001 distance is kpc. Archival optical and radio images show no bright structures near the pulsar position that would indicate significant deviations from the NE2001 maps. However, the pitch angle of the outer arm has been shown to be smaller than known when the NE2001 model was created (Reid et al., 2009), and the far edge of the outer arm is kpc in this direction.
Again assuming a transverse velocity km s-1, the proper motion of mas yr-1 of PSR J2240+5832 limits its distance to kpc. Conversely, a value of km s-1 would place the pulsar in the Perseus arm, which extends from 3 to kpc in this direction. PSR J2240+5832 is therefore among the few pulsars in this direction for which rotation measures are available (Han et al., 2006). The positive value of RM rad m-2, albeit small, is anomalous: other low-latitude RM’s for are negative. On the other hand, in this direction no other pulsar between 6 and 8 kpc has an RM measurement and the positive value may be due to the magnetic field inversion beyond the Perseus arm suggested by Han et al. (2006). The magnetic field G is within the range of observed values in Mitra et al. (2003).
Neutron stars are most likely born within arms and, since kpc, the pulsar should not have gone far from its birthplace. We conclude by presenting two possible values for the distance to PSR J2240+5832: one in the outer arm ( kpc) and another in the Perseus arm ( kpc). If in the outer arm, is large but not exceptional and the pulsar is farther than most known gamma-ray pulsars. If it is in the Perseus arm, the DM excess and positive RM remain unexplained but the speed and distance are more typical. We see below that the two values of obtained using the two distances are both plausible. VLBI astrometric parallax measurements would be of great interest for these and all gamma-ray pulsars.
4.2 Evidence of a pulsar wind nebula?
PSR J0248+6021 coincides with the heart of an elongated nodule long (see Fig. 6), seen at both 21 cm (NVSS, Condon et al., 1998) and in the optical. The pulsar proper motion is from the nodule long axis. The POSS-II (Palomar Optical Sky Survey) image shows an arc long about from the pulsar position. The simple formulae for the size and offsets for pulsar wind nebula (PWN) termination shocks given by Kargaltsev & Pavlov (2008) are roughly consistent with what we observe. Might we be seeing shocks in the interstellar medium caused by the pulsar’s high transverse velocity?
To explore the idea of a possible PWN, we obtained Swift (Gehrels et al., 2004) observations of PSR J0248+6021 with data taken over two days, 2009 Dec. 10-11. The target was not detected in the X-ray Telescope (XRT; Burrows et al., 2005) combined 7.2 ks exposure and we derive a limit on the source count rate (0.5–8 keV) of cts/s after dead time, vignetting, and PSF corrections. Using PIMMS, this corresponds to an observed flux limit of erg cm-2 s-1, or erg cm-2 s-1 unabsorbed with Galactic cm-2 (Kalberla et al., 2005), assuming a power-law photon flux with as is typical among observed X-ray PWN (same sign convention for as in Eq. 2, Sect. 5). For kpc, we obtain (absorbed) erg/s for the PWN X-ray luminosity. Only eight of the 40 X-ray PWN’s in Kargaltsev & Pavlov (2008) are dimmer: if there is an X-ray PWN, it is faint, possible for a PWN of the age of these pulsars.
An upper limit on GeV PWN emission is given in Section 5.1. The position of PSR J0248+6021 is at the corner of both the MAGIC (Albert et al., 2006) and the VERITAS (Acciari et al., 2008) TeV significance maps for LS I 303. No evidence of TeV emission from a putative PWN is apparent. Reanalysis of the complete TeV datasets optimized for a source at this location with PWN-like properties (i.e. possibly offset, and/or spatially extended) is encouraged.
4.3 Upper limit for detection of an optical pulsar
Digital Sky Survey images show a faint source seemingly coincident with the pulsar position. Analyzing the Ultra-Violet/Optical Telescope (UVOT; Roming et al., 2005) U-filter image (exposure: 3575 s) obtained with Swift on 2009 December 11th, the faint source is detected at . We measure its center (J2000) at RA = 02h 48’ 18.711”, dec = 60d 21’ 38.98” with a statistical uncertainty of 0.46” (90% confidence). Its observed flux density is mJy at Hz corresponding to magnitude . The uncertainties are statistical. This source is not detected in the UVOT W1-filter image (3537 s) obtained on 2009 December 10th and we derive a upper limit of mJy at Hz. Pulsar timing is incompatible with the position of the optical object and there is therefore no evidence of an optical pulsar.
5 Gamma-ray Observations
The LAT is an electron-positron pair conversion telescope that was placed in orbit with the Fermi satellite on 2008 June 11 (Atwood et al., 2009; Abdo et al., 2009e). The LAT covers the 20 MeV to GeV energy range with higher sensitivity and more accurate localisation than previous instruments (an on-axis effective area cm2 above 1 GeV and angular resolution at 1 GeV). LAT measurements yielded a catalog of 1451 gamma-ray “1FGL” sources during its first year (Abdo et al., 2010a).
We used the standard Science Tools software package for Fermi LAT data analysis333Gamma-ray data, analysis software, rotation ephemerides, and the diffuse background models are publically available at the Fermi Science Support Center, FSSC, http://fermi.gsfc.nasa.gov/ssc/.. For both pulsars, we selected data collected between 2008 August 4 (MJD 54682) when Fermi began scanning-mode operations, and the end of the ephemeris validity range (over 15 months in both cases). We kept “diffuse” class events (highest probability of being -ray photons) within a “region-of-interest” (ROI) around the pulsar. We excluded events with zenith angles to reject the -ray albedo from the Earth’s limb. Photon phases were calculated using the TEMPO2 pulsar timing software (Edwards et al., 2006).
At low photon energies, multiple scattering dominates the LAT’s angular resolution. For the gamma-ray pulse profiles (phase histograms), we applied an energy-dependent angular radius cut centered on the pulsar that approximates the instrument point spread function (PSF), given by , which corresponds to a 68% containment angle (P6_V3 Instrument Response Function, “IRF”). A maximum radius of and for PSRs J0248+6021 and J2240+5832, respectively, reduces the background at low energies. We also remove events from nearby 1FGL sources within using the same bounded, energy-dependent radius as applied to the pulsar.
The on-pulse spectra were obtained with a maximum likelihood analysis (Mattox et al., 1996) of the LAT data within of the pulsar, using the Fermi science tool “gtlike”. The likelihood method weights events from the target and background sources according to the energy-dependent PSF, which explains the need for such a large ROI. We excluded time intervals when the ROI intersected the Earth’s limb. In this paper, we modeled the pulsars using the functional form
| (2) |
where is the differential flux normalization (ph cm-2 s-1 MeV-1), the photon index, and the cutoff energy. A pure power law () describes many gamma-ray sources, such as active galactic nuclei (Abdo et al., 2010a). The 46 gamma-ray pulsars discussed in Abdo et al. (2010b) are generally well-described by a simple exponential cutoff, , a shape predicted by outer magnetosphere emission models (see the Discussion, below). Models where gamma-ray emission occurs closer to the neutron star can have sharper “super-exponential” cutoffs, e.g. .
The Galactic diffuse emission was modeled using the gll_iem_v02 map cube based on six Galactocentric “ring” maps of N(HI) and W(CO) and on the spatial distribution of the inverse Compton intensity modeled by GALPROP (Strong et al., 2004a, b). Diffuse extragalactic gamma-ray emission and residual instrument backgrounds were modeled jointly by the isotropic component isotropic_iem_v02. Both models are available from the FSSC. All 1FGL sources within were modeled with a power-law. Sources farther than 5∘ from the target pulsar were assigned fixed power law spectra, with parameters taken from the 1FGL source catalog. Spectral parameters for the pulsars and sources within 5∘ of the pulsar were allowed to vary. Systematic uncertainties were estimated by reapplying the fitting procedures using bracketing IRFs where the effective area was shifted (linear extrapolations in log space) by 10% at 0.1 GeV, 5% near 0.5 GeV, and 20% at 10 GeV.
5.1 PSR J0248+6021
PSR J0248+6021 is called 1FGL J0248.3+6021 in the LAT catalog (Abdo et al., 2010a). It is in the Galactic plane, away from the bright gamma-ray source 1FGL J0240.5+6113, identified as the Be star binary LSI +61∘ 303 (Abdo et al., 2009d). No other 1FGL sources are within . The high pulsar PSR J0205+6449 in 3C 58 is about away (Abdo et al., 2009b). PSR J0248+6021 was discovered towards the end of EGRET’s lifetime, and ephemerides contemporaneous with only a fraction of EGRET data exist. Before the Fermi mission, we searched for gamma-ray pulsations in all EGRET data for a range of (, ) values extrapolated from our radio ephemeris. However, no pulsed signal was detected presumably because of the poor S/N of the EGRET data.
Fermi LAT data for PSR J0248+6021 do however exhibit clear pulsations for the 3810 photons with energies GeV remaining after cuts. Fig. 1 shows the folded light curve of these events for different energy bands, along with the radio profiles used to derive the timing parameters. The light curve in each energy interval consists of one broad peak between 0.20 and 0.55 in phase, which dominates the highest energy band ( GeV) but is progressively less pronounced with decreasing energy. The pulsation significances based on the bin-independent H-test (de Jager & Büsching, 2010) are , , , respectively, for the three energy bands , , and 1 GeV. Between and 1 GeV, a structure with statistical significance of 3 (signal/) appears between phases 0.6 and 0.7. However, it is not observed in the other energy bands, and a full likelihood analysis in that phase interval yields an excess with a significance of only between 0.1 and 100 GeV. We fit the main -ray peak () above 0.1 GeV with two half-Lorentzian functions. This shape provides a higher value of than others and accommodates differences between the leading and trailing edges. The fit peak is at phase after the maximum of the radio peak, with a full width at half maximum (FWHM) of . The uncertainty in is statistical. The bias due to the DM uncertainty in extrapolating the radio TOA to infinite frequency is negligible. The peak position does not vary with -ray energy within the statistical uncertainties, and the highest energy photon has 5 GeV at phase .
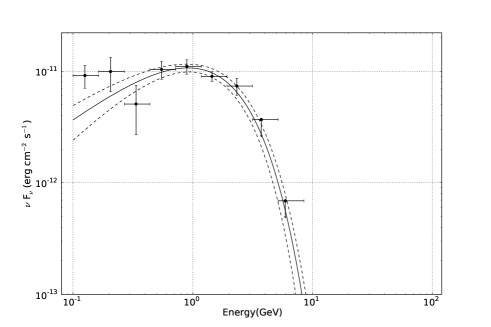
We fit the on-pulse () data for PSR J0248+6021 with an exponentially cutoff power law (). The two neighbors mentioned above, as well as PSR J0218+4232 (Abdo et al., 2009a), were modeled in similar ways. Softer or sharper cutoffs () yield essentially the same statistical significance. The likelihood ratio test (, twice the difference of the logarithm of the likelihood maximum value) prefers the simple exponentially cutoff power law () for PSR J0248+6021 to a simple power law () by . The spectral results for are listed in Table 1, along with the integral photon flux and integral energy flux above GeV. The first errors are statistical and the second are systematic. Fig. 12 shows both the overall fit between 0.1 and 9 GeV (solid lines) with , and spectral points from likelihood fits in each individual energy band using a power-law spectrum.
We performed a maximum likelihood analysis for 50 days before and after the 2009 March glitch epoch. No change in the flux was observed. We searched the off-pulse data for a point source in the energy band 0.1-100 GeV at the radio pulsar position. No signal was observed. After scaling to the full pulse phase, we derived a 95% confidence level upper limit on the flux of cm-2 s-1. If a PWN is associated with the pulsar, deep observations will be required to see it.
5.2 PSR J2240+5832
PSR J2240+5832 is in the Galactic plane away from the radio-quiet gamma-ray pulsar PSR J2238+5903 (Jy, Ray et al., 2010), and away from the Vela-like PSR J2229+6114 associated with the “Boomerang” PWN and SNR (Abdo et al., 2009c). No other 1FGL source lies within . The high background from nearby PSR J2238+5903 is the reason for the choice of small value of . A total of 1208 photons with energies GeV were selected. Fig. 2 shows the gamma-ray pulse profiles in different energy bands, phase-aligned with the peak of the GHz radio profile observed at Nançay. A single peak between phases and appears above GeV only. We tried different apertures to search for a signal below GeV, but no excess was observed at the peak location. The highest H-test significance is 6.3 and occurs above 1 GeV. Fitting above GeV with a Lorentzian function places the peak at after the radio maximum, with an FWHM of . The peak position does not vary with -ray energy within statistical uncertainties, and the highest energy photon (20 GeV) lies at , just outside the peak phase range.
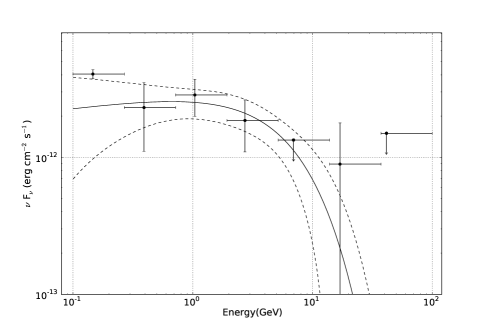
We determined the on-pulse () spectrum using the maximum likelihood analysis within a 15∘ aperture. Both nearby pulsars PSRs J2238+5903 and J2229+6114 as well as PSR J2240+5832 were modeled by a simple exponentially cutoff power law ( in Eq. 2). Results are listed in Table 1. The source is three times fainter than the other pulsar, leading to large uncertainties in the spectral parameters. The spectral index and cutoff are consistent with those seen for most young gamma-ray pulsars. We explored different models and the exponential cutoff () is preferred to a power law by only . Fig. 12 shows both the overall fit between 0.1 and 100 GeV (solid lines), along with the spectral points from power-law likelihood fits to each individual energy band.
As for PSR J0248+6021, we searched the off-pulse region for a possible PWN at the pulsar position. No signal was observed. Scaling to the entire phase range (a full rotation) yields a 95% confidence level upper limit on the flux of cm-2 s-2. We note however that the MILAGRO significance map for the region surrounding the “Boomerang” PWN and PSR J2229+6114 extends intriguingly towards the Galactic plane, reaching at the position of PSR J2238+5903 (Abdo et al., 2009f). The Tibet air shower array similarly sees a excess at that location (Amenomori et al., 2010). Both MILAGRO’s and Tibet’s angular resolutions are poor, and TeV PWN’s are notoriously offset from the pulsars driving them. PSR J2238+5903 is more energetic ( erg s-1) than PSR J2240+5832 and presumably closer, given that it is brighter ( photons cm-2 s-1 above 100 MeV). The TeV excess might be a conflation of two adjacent sources. Deeper observations with a Cherenkov imager array may be interesting.
6 Discussion
6.1 Gamma-ray luminosity
Armed with the gamma-ray integral energy flux and the distances , we can now evaluate the luminosity (Eq. 1). We set as in Abdo et al. (2010b), and see below that the emission models in any case yield . Defining erg cm-2 s-1 and kpc cm gives erg s-1. For PSR J0248+6021, summing the distance and uncertainties in quadrature yields erg s-1. For PSR J2240+5832, the distance ambiguity leads to larger uncertainties: if the pulsar is in the outer arm, we obtain erg s-1, but if there is some unseen cloud along the line-of-sight creating an overdensity of electrons, and the pulsar is in the nearer Perseus arm, then erg s-1. The corresponding efficiencies are listed in Table 1.
We compare these luminosities with the rule-of-thumb for young pulsars illustrated in Fig. 6 of the Fermi Pulsar Catalog (Abdo et al., 2010b), erg/s, where stands for “heuristic”. For the of our two pulsars, is erg s-1, very near obtained for PSR J0248+6021. The measured value of for PSR J2240+5832 overlaps the rule-of-thumb for the distance of the Perseus arm, while the outer arm value is within the spread of values observed for the other pulsars. It is important not to assign a distance to the pulsar based on a comparison of observed with expectations, since that may bias future attempts to use population modeling to refine emission models.
6.2 Emission models
These two pulsars have atypical gamma-ray pulse profiles: as for the six pulsars studied by Weltevrede et al. (2010), they have only one gamma-ray peak, and like four of those, they have a large offset from the radio pulse. Most gamma-ray pulsars have two peaks, the first lagging the radio beam by rotations. Hence, these two pulsars help extend the parameter space over which we can test gamma-ray emission models.
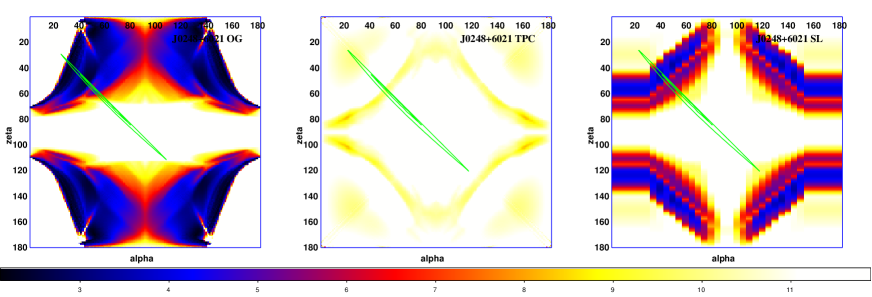
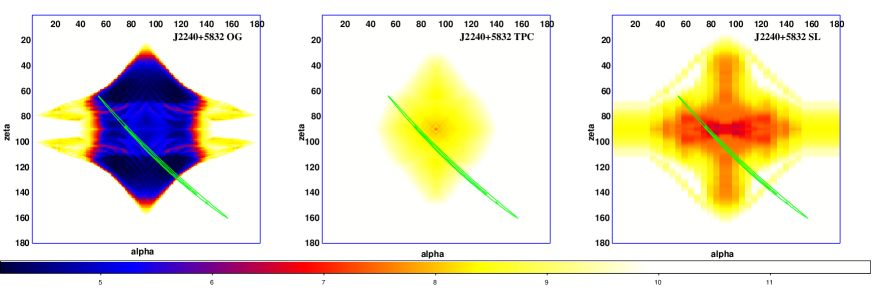
To pin down the geometrical angles and , beyond the RVM work described above, we follow Romani & Watters (2010) in modeling the gamma-ray pulse profiles. Byproducts are the flux correction factors , which reduce the uncertainty in . We test two simple versions of outer magnetosphere pulse models. The first model (‘outer gap’, or OG, Romani, 1996) has emission starting at the ‘null charge’ surface and extending to the light cylinder. The second model (‘two pole caustic’, or TPC, Dyks & Rudak, 2003) has emission starting at the star surface and extending to a perpendicular distance of from the rotation axis or a radial distance of , whichever is less. In both cases, the emission comes from a zone spanning a characteristic fraction of the open zone near the last-closed field lines. For PSR J0248+6021, we choose a linear intensity gradient across the gap but the modeled light curve shape is not very sensitive to the illumination across the gap zone, and narrow or uniformly illuminated gaps give similar results. In contrast, the very sharp -ray pulse of PSR J2240+5832 seems to require a relatively small range of field lines near the maximum to dominate the emission: here we used a simple Gaussian weighting, peaked around . We also plot the fits to the numerical plasma-filled (force free) model of Bai & Spitkovsky (2010). This so-called ‘separatrix layer’ (SL) model has a dense plasma and currents and posits emission from field lines extending well outside the light cylinder into the wind zone.
Figs. 7 and 8 show the goodness-of-fit surfaces in the plane for the two pulsars. “Goodness-of-fit” matching of the observed and modeled post-profiles uses the exponentially-tapered weighting defined in Romani & Watters (2010), a more robust test statistic than a simple . The regions selected by the RVM fits to the radio data are superimposed. In both cases, emission from near the light cylinder (as used in this OG model) seems necessary to provide good fits. In addition, emission from below the ‘null charge’ surface appears to create too many pulse components and too much off-pulse emission. For PSR J0248+6021, the best-fit curves in the radio-allowed region are near , . This model produces a broad, merged peak at the correct phase with a good fit statistic . The inferred flux correction factor is . The best fit TPC model in the allowed region is near the same angles but gives a substantially poorer fit, because of a second pulse component at . Here we have .
A similar exercise for PSR J2240+5832 shows rather similar regions of best fit for the two models. However, again the OG model provides a better fit (near , ) with . The poorer TPC fit at this position has . In this case, the OG light curve is dominated by a single narrow pulse near . A much weaker component near is faint or missing in the present gamma-ray light curve. Although these same two components are present in the TPC curve, the first peak after the radio pulse is comparably bright to the second, and for these angles significant emission is predicted for all pulsar phases. These differences indicate that, using the particular realizations of the OG and TPC models described by Romani & Watters (2010), the data are most consistent with the OG-type picture. For both fits, . The SL models provide fit levels intermediate between the OG and TPC models. The relatively good fits tend to lie along a narrow band and the intersection with the RVM-allowed angles is similar to that proposed in the OG case.
Thus, while both of these pulsars show single dominant components in the GeV light curves, the pulse profile modeling suggests a different origin. For PSR J0248+6021, the single broad component near phase may be a merged double from a grazing sweep across the hollow -ray beam. In contrast, the very narrow pulse at phase for PSR J2240+5832 implies a cut through a caustic surface for a component normally identified with the second peak in young pulsars: the first peak is weak or absent.
7 Conclusions
The Nançay survey of the northern Galactic plane led to the discovery of two remarkably similar young pulsars. They were subsequently timed for twelve years, during which period instrument precision improved steadily. The extensive timing data allowed proper motion determinations, and revealed a slowly varying DM for one pulsar. These data, together with RM measurements obtained with polarization data, proved crucial in constraining the distance of PSR J0248+6021 to 2 kpc, much less than the value deduced from the DM alone. The timing data also facilitated investigations of the pulsar’s environment. Radio polarization data constrained the pulsar geometry.
Both pulsars have large spin-down power and are among the growing number of gamma-ray pulsars detected with the Fermi Large Area Telescope. Yet they are in the minority of gamma-ray pulsars displaying only a single peak, with a large offset from the radio pulse. Gamma-ray emission modeling constrains the regions where the electrons radiate at high energies. The gamma-ray luminosities obtained reinforce the growing evidence for how emission depends on spin-down power.
We have studied radio, optical, X-ray, and TeV data for evidence of either accompanying pulsar wind nebulae or a bright optical pulsar. None was seen, but we presented evidence to encourage deeper X-ray and TeV searches. Sustained, accurate pulsar timing combined with multi-wavelength data are thus allowing progress in the understanding of the emission mechanisms at work around neutron stars, and of the diffuse Galactic radiations at all energies.
| Pulsar name | J0248+6021 | J2240+5832 |
| Right ascension, (J2000) | 02:48:18.617(1) | 22:40:42.939(4) |
| Declination, (J2000) | +60:21:34.72(1) | +58:32:37.52(4) |
| Position epoch, (MJD) | 54000 | 54000 |
| Galactic longitude, (degrees) | 136.9 | 106.6 |
| Galactic latitude, (degrees) | 0.698 | -0.111 |
| Pulse frequency, (s-1) | 4.6063 | 7.1462 |
| First derivative of pulse frequency, ( s-2) | ||
| Proper motion in right ascension, (mas yr-1) | ||
| Proper motion in declination, (mas yr-1) | ||
| Timing data span (MJD) | 54682.7 to 55160.9 | 54682.7 to 55202.6 |
| Rms timing residual () | 181 | 66 |
| Radio pulse width at 1.4 GHz, (phase) | 0.12 | 0.07 |
| Dispersion measure, (cm-3pc) | ||
| DM epoch, (MJD) | 54000 | 54000 |
| Rotation measure, (rad m-2) | ||
| Mean flux density at 1400 MHz, (mJy) | ||
| Radio spectral index | ||
| Radio-gamma-ray peak offset, | ||
| Gamma-ray spectral Parameters | ||
| Differential photon flux normalization, (cm-2 s-1 MeV-1) | ||
| Integral photon flux, ( MeV, ph cm-2 s-1) | ||
| Integral energy flux, ( MeV, erg cm-2 s-1) | ||
| Exponential cut-off energy, (GeV) | ||
| Power law index, | ||
| Derived Quantities | ||
| Spin-down power, (erg s-1) | ||
| Characteristic age, (kyr) | 63 | 151 |
| Surface magnetic field strength, ( G) | 3.5 | 1.45 |
| Magnetic field strength at the light cylinder, (G) | 3150 | 4860 |
| Distance from NE2001, (kpc) | ||
| Distance used in this work, (kpc) | or | |
| Luminosity, ( MeV, erg s-1) | or | |
| Efficiency, (%) | or | |
Acknowledgements
We thank Simon Johnston for useful discussions regarding the radio polarization signal.
The Nançay Radio Observatory is operated by the Paris Observatory, associated with the French Centre National de la Recherche Scientifique (CNRS). This research made use of the WEBDA database, operated at the Institute for Astronomy of the University of Vienna.
The Fermi LAT Collaboration acknowledges generous ongoing support from a number of agencies and institutes that have supported both the development and the operation of the LAT as well as scientific data analysis. These include the National Aeronautics and Space Administration and the Department of Energy in the United States, the Commissariat à l’Energie Atomique and the Centre National de la Recherche Scientifique / Institut National de Physique Nucléaire et de Physique des Particules in France, the Agenzia Spaziale Italiana and the Istituto Nazionale di Fisica Nucleare in Italy, the Ministry of Education, Culture, Sports, Science and Technology (MEXT), High Energy Accelerator Research Organization (KEK) and Japan Aerospace Exploration Agency (JAXA) in Japan, and the K. A. Wallenberg Foundation, the Swedish Research Council and the Swedish National Space Board in Sweden.
Additional support for science analysis during the operations phase is gratefully acknowledged from the Istituto Nazionale di Astrofisica in Italy and the Centre National d’Études Spatiales in France.
References
- Abdo et al. (2010a) Abdo, A. A., Ackermann, M., Ajello, M., et al. 2010a, ApJS, 188, 405, (1FGL catalog)
- Abdo et al. (2010b) Abdo, A. A., Ackermann, M., Ajello, M., et al. 2010b, ApJS, 187, 460
- Abdo et al. (2009a) Abdo, A. A., Ackermann, M., Atwood, W. B., et al. 2009a, Science, 325, 848, (Millisecond Pulsars)
- Abdo et al. (2009b) Abdo, A. A., Ackermann, M., Atwood, W. B., et al. 2009b, ApJ, 699, L102, (PSR J0205+6449)
- Abdo et al. (2009c) Abdo, A. A., Ackermann, M., Atwood, W. B., et al. 2009c, ApJ, 706, 1331, (PSRs J10485832 and J2229+6114)
- Abdo et al. (2009d) Abdo, A. A., Ackermann, M., Atwood, W. B., et al. 2009d, ApJ, 701, L123, (LSI+61∘303)
- Abdo et al. (2009e) Abdo, A. A., Ackermann, M., Atwood, W. B., et al. 2009e, Astroparticle Physics, 32, 193, (On-orbit calibration)
- Abdo et al. (2009f) Abdo, A. A., Allen, B. T., Aune, T., et al. 2009f, ApJ, 700, L127
- Acciari et al. (2008) Acciari, V. A., Beilicke, M., Blaylock, G., et al. 2008, ApJ, 679, 1427
- Albert et al. (2006) Albert, J., Aliu, E., Anderhub, H., et al. 2006, Science, 312, 1771
- Amenomori et al. (2010) Amenomori, M., Bi, X. J., Chen, D., et al. 2010, ApJ, 709, L6
- Atwood et al. (2009) Atwood, W. B., Abdo, A. A., Ackermann, M., et al. 2009, ApJ, 697, 1071, (LAT)
- Backer et al. (1997) Backer, D. C., Dexter, M. R., Zepka, A., et al. 1997, PASP, 109, 61
- Bai & Spitkovsky (2010) Bai, X.-N. & Spitkovsky, A. 2010, ApJ, 715, 1282
- Blaskiewicz et al. (1991) Blaskiewicz, M., Cordes, J. M., & Wasserman, I. 1991, ApJ, 370, 643
- Burrows et al. (2005) Burrows, D. N., Hill, J. E., Nousek, J. A., et al. 2005, Space Science Reviews, 120, 165
- Cognard & Theureau (2006) Cognard, I. & Theureau, G. 2006, Present and Future of Pulsar Astronomy, 26th IAU meeting, Joint Discussion 2, 16-17 August, 2006, Prague, Czech Republic, #36, 2
- Cognard et al. (2009) Cognard, I., Theureau, G., Desvignes, G., & Ferdman, R. 2009, in Windows on the Universe, XXI Rencontres de Blois, arXiv:0911.1612
- Condon et al. (1998) Condon, J. J., Cotton, W. D., Greisen, E. W., et al. 1998, AJ, 115, 1693
- Cordes & Lazio (2002) Cordes, J. M. & Lazio, T. J. W. 2002, ArXiv e-prints, (arXiv:astro-ph/0207156)
- de Jager & Büsching (2010) de Jager, O. C. & Büsching, I. 2010, A&A, 517, L9
- Dyks & Rudak (2003) Dyks, J. & Rudak, B. 2003, ApJ, 598, 1201
- Edwards et al. (2006) Edwards, R. T., Hobbs, G. B., & Manchester, R. N. 2006, MNRAS, 372, 1549
- Foster et al. (1997) Foster, R. S., Ray, P. S., Cadwell, B. J., et al. 1997, in Bull. AAS, Vol. 29, Bulletin of the American Astronomical Society, 1392
- Foster et al. (1996) Foster, R. S., Ray, P. S., Lundgren, S. C., et al. 1996, in Astronomical Society of the Pacific Conference Series, Vol. 105, IAU Colloq. 160: Pulsars: Problems and Progress, ed. S. Johnston, M. A. Walker, & M. Bailes, 25
- Gehrels et al. (2004) Gehrels, N., Chincarini, G., Giommi, P., et al. 2004, ApJ, 611, 1005
- Han et al. (2006) Han, J. L., Manchester, R. N., Lyne, A. G., Qiao, G. J., & van Straten, W. 2006, ApJ, 642, 868
- Hobbs et al. (2005) Hobbs, G., Lorimer, D. R., Lyne, A. G., & Kramer, M. 2005, MNRAS, 360, 974
- Hobbs et al. (2004) Hobbs, G. B., Lyne, A. G., Kramer, M., Martin, C. E., & Jordan, C. 2004, MNRAS, 353, 1311
- Hotan et al. (2004) Hotan, A. W., van Straten, W., & Manchester, R. N. 2004, Publications of the Astronomical Society of Australia, 21, 302
- Johnston et al. (2007) Johnston, S., Kramer, M., Karastergiou, A., et al. 2007, MNRAS, 381, 1625
- Kalberla et al. (2005) Kalberla, P. M. W., Burton, W. B., Hartmann, D., et al. 2005, A&A, 440, 775
- Karastergiou & Johnston (2007) Karastergiou, A. & Johnston, S. 2007, MNRAS, 380, 1678
- Kargaltsev & Pavlov (2008) Kargaltsev, O. & Pavlov, G. G. 2008, in American Institute of Physics Conference Series, Vol. 983, 40 Years of Pulsars: Millisecond Pulsars, Magnetars and More, ed. C. Bassa, Z. Wang, A. Cumming, & V. M. Kaspi, 171–185
- Kharchenko et al. (2005) Kharchenko, N. V., Piskunov, A. E., Röser, S., Schilbach, E., & Scholz, R.-D. 2005, A&A, 440, 403
- Mattox et al. (1996) Mattox, J. R., Bertsch, D. L., Chiang, J., et al. 1996, ApJ, 461, 396
- Mitra & Ramachandran (2001) Mitra, D. & Ramachandran, R. 2001, A&A, 370, 586
- Mitra et al. (2003) Mitra, D., Wielebinski, R., Kramer, M., & Jessner, A. 2003, A&A, 398, 993
- Morgan et al. (2009) Morgan, L. K., Urquhart, J. S., & Thompson, M. A. 2009, MNRAS, 400, 1726
- Radhakrishnan & Cooke (1969) Radhakrishnan, V. & Cooke, D. J. 1969, Astrophys. Lett., 3, 225
- Ransom et al. (2003) Ransom, S. M., Cordes, J. M., & Eikenberry, S. S. 2003, ApJ, 589, 911
- Ravi et al. (2010) Ravi, V., Manchester, R. N., & Hobbs, G. 2010, ApJ, 716, L85
- Ray et al. (1999) Ray, P. S., Cadwell, B. J., Lazio, T. J. W., et al. 1999, in BAAS, Vol. 31, Bull. Am. Astr. Soc., 903
- Ray et al. (2010) Ray, P. S. et al. 2010, ApJ, in prep (Precise Timing of Fermi Gamma-Ray Pulsars)
- Reich (1982) Reich, W. 1982, A&AS, 48, 219
- Reid et al. (2009) Reid, M. J., Menten, K. M., Zheng, X. W., et al. 2009, ApJ, 700, 137
- Romani (1996) Romani, R. W. 1996, ApJ, 470, 469
- Romani & Watters (2010) Romani, R. W. & Watters, K. P. 2010, ApJ, 714, 810
- Roming et al. (2005) Roming, P. W. A., Kennedy, T. E., Mason, K. O., et al. 2005, Space Science Reviews, 120, 95
- Smith et al. (2008) Smith, D. A., Guillemot, L., Camilo, F., et al. 2008, A&A, 492, 923
- Strong et al. (2004a) Strong, A. W., Moskalenko, I. V., & Reimer, O. 2004a, ApJ, 613, 962
- Strong et al. (2004b) Strong, A. W., Moskalenko, I. V., Reimer, O., Digel, S., & Diehl, R. 2004b, A&A, 422, L47
- Theureau et al. (2005) Theureau, G., Coudreau, N., Hallet, N., et al. 2005, A&A, 430, 373
- Tian et al. (2010) Tian, W. W., Leahy, D. A., & Li, D. 2010, MNRAS, 404, L1
- Watters et al. (2009) Watters, K. P., Romani, R. W., Weltevrede, P., & Johnston, S. 2009, ApJ, 695, 1289
- Weltevrede et al. (2010) Weltevrede, P., Abdo, A. A., Ackermann, M., et al. 2010, ApJ, 708, 1426
- Weltevrede et al. (2006) Weltevrede, P., Stappers, B. W., Rankin, J. M., & Wright, G. A. E. 2006, ApJ, 645, L149
- Wright (2010) Wright, E. L. 2010, in AAS Abstracts, Vol. 216, American Astronomical Society Meeting, 104.01