11email: dreyer@astro.physik.tu-berlin.de
Circumstellar dust shells around long-period variables
Abstract
Context. Long-period variables (LPVs) and Miras exhibit a pronounced variability in their luminosity with a more or less well-defined period, and they suffer large mass loss in the form of stellar winds. Owing to this extensive mass loss, they are surrounded by extended circumstellar dust shells (CDSs). The dynamics of these envelopes is the result of a complex interplay via an external excitation by the pulsating central star, dust formation, and radiative transfer.
Aims. Our study is aimed at an understanding of the dynamics of CDSs around carbon-rich, standard luminous LPVs and Miras. These shells often show multiperiodicity with secondary periods as high as a few superimposed on a main period that is in the range of approximately . Such secondary periods may be caused at least in part by the presence of dust.
Methods. We consider an excitation of the CDSs either by a harmonic force, provided by the oscillation of the central star, or by a stochastic force with a continuous power spectrum. The resulting numerically computed dynamical behaviour of the shell is analysed with the help of Fourier analysis and stroboscopic maps.
Results. CDSs may be described as multioscillatory systems that are driven by the pulsating stars. A set of normal modes can be identified. The obtained periods of these modes are some , which is a characteristic timescale for dust nucleation, growth, and elemental enrichment in the dust formation zone. Depending on the oscillation period and strength of the central star, the envelope reacts periodically, multi- periodically, or irregularly.
Key Words.:
stars: AGB and post-AGB - stars: circumstellar matter - stars: oscillation - chaos - hydrodynamics - method: numerical1 Introduction
Long-period variables (LPVs) and Miras are highly evolved stars located in the upper region of the asymptotic giant branch (AGB). They are characterised by low surface temperatures and high luminosities of the order of . They typically exhibit a pronounced variability of their intensity and suffer large mass loss in the form of a stellar wind with mass loss rates of up to . Owing to their extensive mass loss, LPVs and Miras are surrounded by extended circumstellar envelopes that provide the necessary conditions for the formation of dust.
Dreyer et al. (2009) (henceforth called paper I), a previous paper of this series, studied the dynamics of circumstellar dust shells (CDSs) around high luminous LPVs and Miras. It turned out that for these kind of stars, the dynamics of the envelopes is clearly dominated by the interplay between dust formation and radiative transfer, i.e. the exterior -effect (see Fleischer et al. 1995; Höfner et al. 1995). A regular oscillation of the shell can be solely explained by the formation of dust and the radiative pressure on it.
In this work we concentrate on the circumstellar envelopes of less luminous LPVs and Miras. For luminosities of less than , additional input of energy and momentum is required to sustain the observed oscillations. This energy is provided by oscillations of the star’s deeper layers. Caused by the pulsational instability due to variations in the convective flux (cf. Fox & Wood 1982), hydrodynamic waves are generated in the dense stellar atmosphere and steepen into shock waves when travelling into the thinner circumstellar medium. The presence of such shock waves causes a levitation of the atmosphere producing favourable conditions for dust nucleation and growth. Once the first dust particles have formed, the momentum coupling between matter and radiation field is strongly enhanced, which again results in a massive stellar wind.
Although the shell’s oscillation has to be triggered by a stellar pulsation, the presence of dust influences the dynamics of the entire system. Even for a strictly harmonic excitation, the shell does not necessarily mimic the stellar pulsation, but instead exhibits its own normal modes (cf. Barthés & Tuchman 1994). Superimposed upon the excitation period that is in the range of approximately (Whitelock et al. 1991), the envelope typically shows oscillations with periods of up to a few . This could explain, at least in part, the observed cycle-to-cycle variation in the periods of some Miras (Eddington & Plakidis 1929). As pointed out by Percy & Colivas (1999), these fluctuations could come from multiperiodicity, with either a secondary period that is comparable to the primary one or a secondary period an order of magnitude longer than the primary one. In the latter case, the secondary oscillation may be explained by an oscillation of the circumstellar shell from the exterior -effect.
In the context of dynamical systems, the CDS can be described as a multioscillatory system that is driven by the pulsating stellar atmosphere. The resulting dynamical behaviour depends on both the frequency and strength of the excitation, as well as, on the intrinsic dynamics of the shell. For a close examination of the possible normal modes of a CDS, which are controlled by the intrinsic timescales of the various physical and chemical processes, we consider response spectra of a circumstellar shell that is excited not only by a harmonic force but also by a stochastic force with a continuous power spectrum. The inherently non-linear nature of the underlying equations introduces an element of randomness into the shell’s dynamics. This also becomes clear when the CDS is excited by a strictly harmonic force. For a sensitive range of frequencies and excitation strengths, the shell does not behave strictly periodically but shows signs of deterministic chaos.
This paper is organised as follows. Section 2 outlines our dynamical modelling method of a CDS,
giving a special focus to the formulation of a purely harmonic and stochastic excitation of the CDS
provided by a central star. Section 3 presents our direct methods as used to investigate the dynamical
CDS behaviour. This section discusses the problems of creating and analysing discrete power spectra and deterministic
maps. In Sect. 4, we apply the method to a reference model. The eigendynamics are first
determined and then the complex interaction between the inner excitation by a pulsating star and the multioscillatory
circumstellar shell is discussed, in this case depending on excitation frequency and strength. The paper finishes
with some concluding remarks in Sect. 5.
2 Modelling of CDSs
The theoretical model of a CDS is conceived as the complete unique set of solutions of an appropriate
system of fundamental dynamical equations, comprising the conservation laws, transport equations, and
constitutive equations that describe both the local and global physical situation of the CDS and the
various inherent processes, such as radiative transfer (Lucy 1971, 1976; Unno & Kondo 1976)
or dust formation (Gail & Sedlmayr 1988; Gauger et al. 1990). These equations were listed and solved according
to the procedure given in Fleischer et al. (1992).
The CDSs are characterised by the fundamental parameters of their generating stars, which are mass ,
luminosity , effective temperature , and carbon-to-oxygen abundance ratio C/O. As these parameters
change only slightly with time because of stellar evolution, they are considered as given external parameters
for modelling a circumstellar shell.
2.1 Monoperiodic excitation
The pulsation of an AGB star, more specifically the underlying inner -mechanism, is treated by the piston approximation adopted from the work of Wood (1979), Bowen (1988), and Bowen & Willson (1991). It is assumed that the radius of the inner boundary located a few scale heights below the stellar radius oscillates sinusoidally about an equilibrium position with
| (1) |
This implies that, at the inner boundary the hydrodynamic velocity , varies in a manner determined by
| (2) |
The velocity amplitude , which simulates the strength of the interior pulsation of the star, as well as the pulsation period , are input parameters.
2.2 Stochastic excitation
To examine the eigenfrequencies and the band-pass characteristics of circumstellar shells around standard and low-luminous AGB stars, we consider the excitation of the shell by external white noise as generated by, e.g., a convective atmosphere of the giants. In analogy to the piston approximation, the movement of the inner boundary is described by the following stochastic equations:
| (3) |
| (4) |
The term describes the influence of the randomness or noise and is taken to be a Gaussian with a mean of zero:
| (5) |
Since we adopt white noise, is uncorrelated in time, which corresponds to the (auto)correlation function being Dirac’s -function
| (6) |
where scales the intensity of the noise. According to the Wiener-Khinchin theorem, the spectral density of is given by the Fourier transform of its autocorrelation function,
| (7) |
and is therefore independent of the frequency .
The integral of the Gaussian white noise, i.e. the solution of
Eq. (4), is known as the Wiener process. It is also Gaussian
distributed, so the mean vanishes, and its variance increases linearly with time .
For a concrete numerical modelling of the CDS, only realisations of the stochastic
process Eq. (3) where stays within predefined finite
boundaries (to ensure that the inner boundary stays within the stellar radius ) are
considered. The strength of the noise is also an input parameter.
3 Diagnostic approach
The dynamics of (non-)linear systems may be described by means of different characteristics. One of the classical ways to characterise the dynamics is to compute the power spectrum based on the Fourier transform. This provides the possibility of obtaining a deeper physical understanding of the real system dynamics by detecting various frequencies contained in a given signal. Another way is an examination by means of a deterministic approach, e.g., to create stroboscopic or specific Poincaré maps to find domains of stability in the phase space.
3.1 Fourier transform
Generally, the Fourier transform is simply a method of expressing a function in terms of the sum of its projections onto a set of basis functions. The standard basis functions used for Fourier transform are , or, equivalently, . It is the oscillatory frequency that varies over the set of all real numbers to give an infinite collection of basis functions. We project a given time function onto our basis functions to get the Fourier amplitudes for each frequency :
| (8) |
In general, will be complex. The norm of the amplitude, is called the Fourier spectrum, and the square is called the power spectrum of .
When using a fast Fourier-transform (FFT)-algorithm to compute the spectrum of a signal, we use a finite length of signal, consisting of discrete samples. However, the discretisation of a signal is not without problems. If the sampling rate is not high enough to sample the signal correctly, then a phenomenon called aliasing occurs; i.e., components of the signal at high frequencies are mistaken for components at lower frequencies.
3.2 Mapping
For dynamic systems having several degrees of freedom, it is not very practical to discuss the orbit in a multidimensional phase space. A more appropriate way is to study the intersections of orbit with a plane in phase space, which reduces the phase space dimension by one.
If the differential equations describing a system contain terms periodic in time (where is the period), it is convenient to create stroboscopic maps showing the time trajectory for several time intervals ; i.e., the flow is sampled whenever for . This kind of map can be constructed for any temporal interval. Sampling by a fixed time interval , i.e. by successive times when the orbit crosses the phase angle plane, i.e. with being an integer, results in a Poincaré map.
4 Application
The condition for a purely dust-driven wind by the exterior -mechanism is only properly fulfilled at the very end of the AGB evolution. If the stellar luminosity decreases, the dominance of the dust with respect to the CDS dynamics at first diminishes. Then, further reduction eventually leads to a vanishing outflow, if no additional energy input is provided. AGBs with low and standard luminosities generate neither self-induced shocks and outflows, with self-maintained oscillatory patterns caused solely by the dust formation (exterior -mechanism), nor a CDS. Generating a CDS requires input of momentum and energy via an additional mechanism in order to levitate material into the outer atmosphere, i.e. into the dust formation window. An example of such a mechanism can be the pulsation of the outer layers of a red giant. The pulsation provides the star with mechanical momentum for levitating the material in their atmosphere.
4.1 Eigendynamics of envelopes
To examine the eigendynamics of a CDS around a standard or low luminous AGB star (e.g. with the reference stellar parameters: , , , and ), the additional mechanism of pulsation is adopted to be irregular (stochastically determined), such as is generated by convection in a red giant atmosphere. The reason for this assumption is to avoid the dominance of the stellar pulsation on the CDS dynamics. The shell has been excited with different noise intensities and sequences from up to 24 models were calculated (cf. Table 1), each with the same set of fundamental stellar parameters, but for different realisations of the stochastic process as described in Sect. 2.2. The stochastic movement of the inner boundary and the corresponding velocity for an arbitrary stochastic realisation with intensity are displayed in Fig. 1.
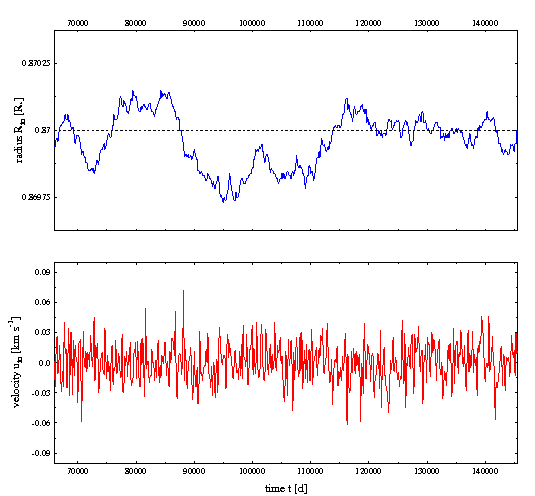
Figure 2 shows snapshots of the radial envelope structure from the stochastically excited model calculation at time for the intensity strengths (left) and (right) for various physical quantities describing a CDS.
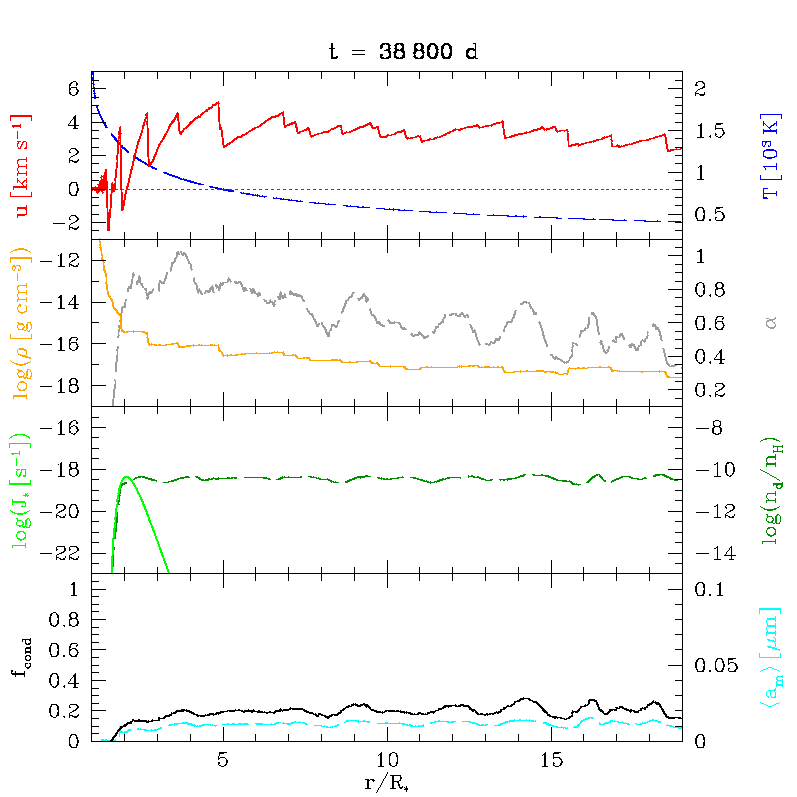
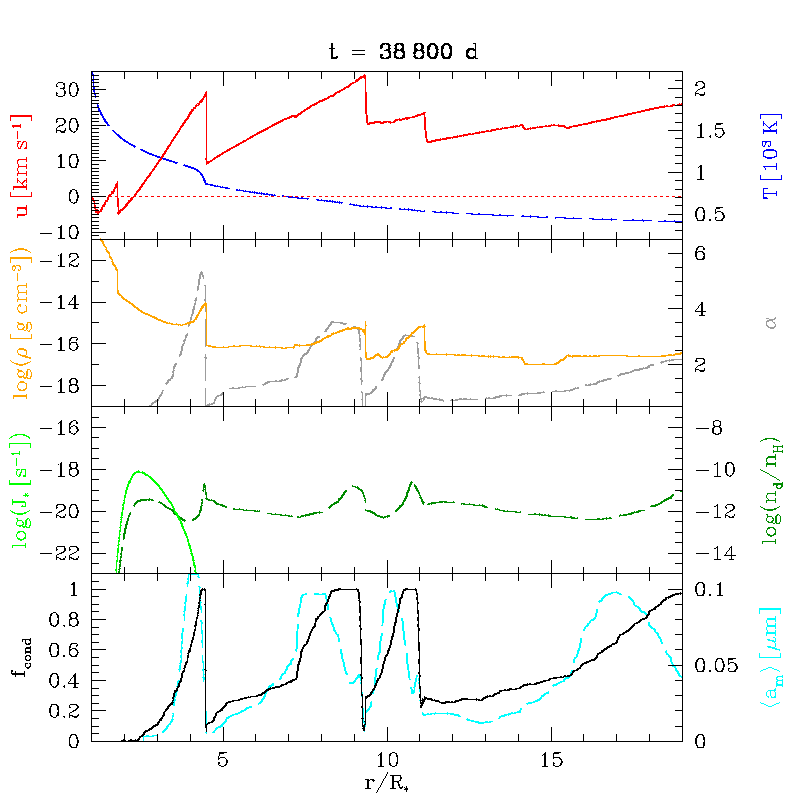
The higher input of mechanical energy in the model with can be seen immediately from the higher amplitude of the innermost shock compared to the model with (uppermost panels). Since the density scale height is the same for both models in the inner region, the higher energy input yields a smoother transition to the wind region (second panels), i.e. a more levitated atmosphere, hence more favourable conditions for dust formation. The outflow is initiated by the pulsation but is accelerated by the dust. The stellar radiation is blocked by the opacity of the instantly formed shell, thereby heating the material behind it, which is located at smaller radii. This backwarming effect prevents new dust from forming and demonstrates that formation and growth of grains also strongly influences the thermodynamical shell structure. As depicted in the lowermost left panel for , the radial structure is rather smooth with an almost constant degree of condensation ; i.e., only 20% of the condensable carbon has actually condensed into solid particles.
This results in an optically thin, slowly dust-driven wind with a time-averaged mass loss rate of 111. This nomenclature denotes averaging of quantity
at a fixed radial position of over a time interval T of at least one pulsation period . and terminal velocity of .
For , the wind becomes rather irregular, but shows the well-known onion-like
shell structure (lowermost right panel). The calculated mass loss rate is , and the final outflow velocity shows a typical value of several tens of kilometres
per second for an AGB star, namely . For both excitation
strengths the nucleation zone is localised around (third panels).
These stochastically excited CDSs were subjected to a Fourier transform. Since the gas velocity of a CDS outflow is usually taken to be a tracer of (multi)periodicity, we focused on a detailed analysis of the velocity structure. Regularly sampled with an interval over a time domain of , the time-dependent velocity was transformed at each fixed radial position r for , i.e. within the dust-forming zone. The spatial resolution was chosen to be . To identify whether spurious frequencies are generated either by interaction between the grid with numbers of gridpoints , grid remapping 222For details of grid redistribution see Fleischer (1994) or by the choice of the sampling interval , we studied several numerical parameter combinations. These studies suggest the following optimal numerical parameter set for our reference CDS: , , , and , which yields a Nyquistfrequency of . Averaging all stochastic realisations provides an overall mean power spectrum of the local expansion gas velocity , which is presented in Fig. 3 for the same excitation strengths as discussed in Fig. 2. See also Table 1, which lists the model parameters of excitation strength , the number of ensemble members , and the resulting quantities: ensemble-averaged CDS-eigenmodes , time-averaged mass loss rate , outflow velocity , and dust-to-gas mass ratio in the dust nucleation zone at .
| No. | |||||||||
|---|---|---|---|---|---|---|---|---|---|
| - | - | ||||||||
| - | |||||||||
| - | |||||||||
| - | |||||||||
-
a
Values in boldface indicate the dominant mode
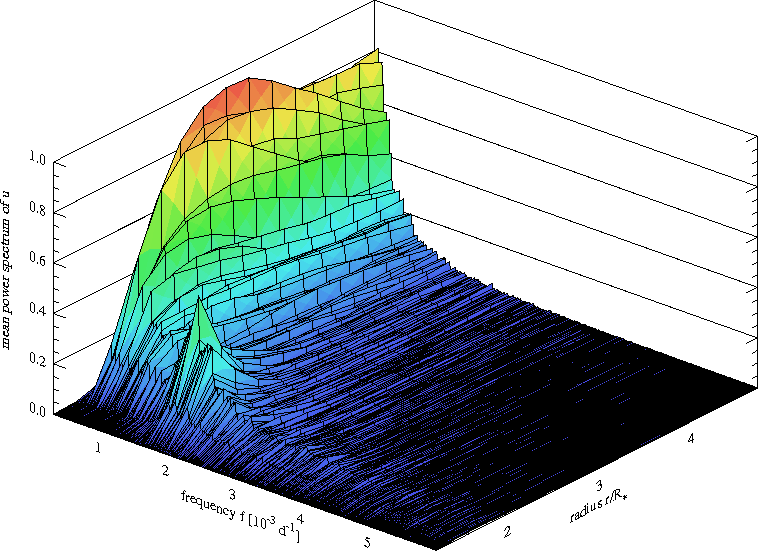
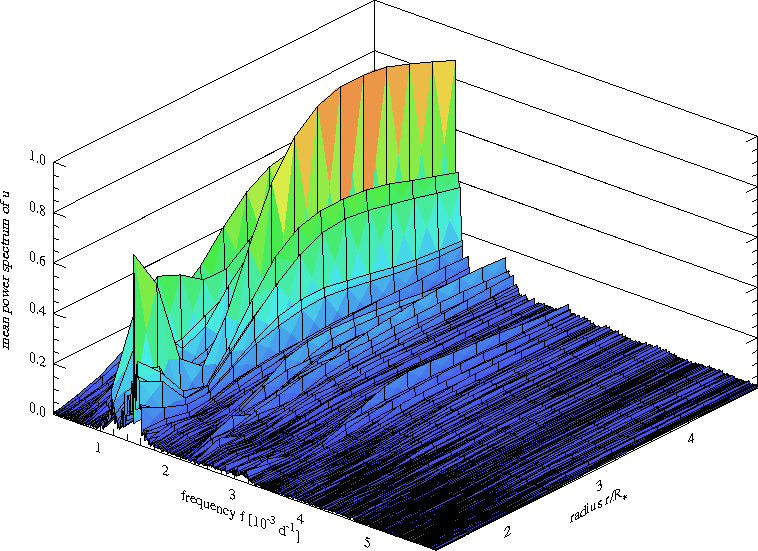
To gain more insight, Fig. 4 illustrates the power spectra for some selected radial positions within the circumstellar envelope. For small excitation strength , the response spectra are dominated by three distinct peaks at , at , and at . The amplitude of the third frequency reaches its maximum near the inner edge of the dust nucleation zone at and diminishes rapidly with increasing distance from the star. Beyond , dust formation sets in and the first and second maxima at and at become visible. They eventually dominate the spectrum for .
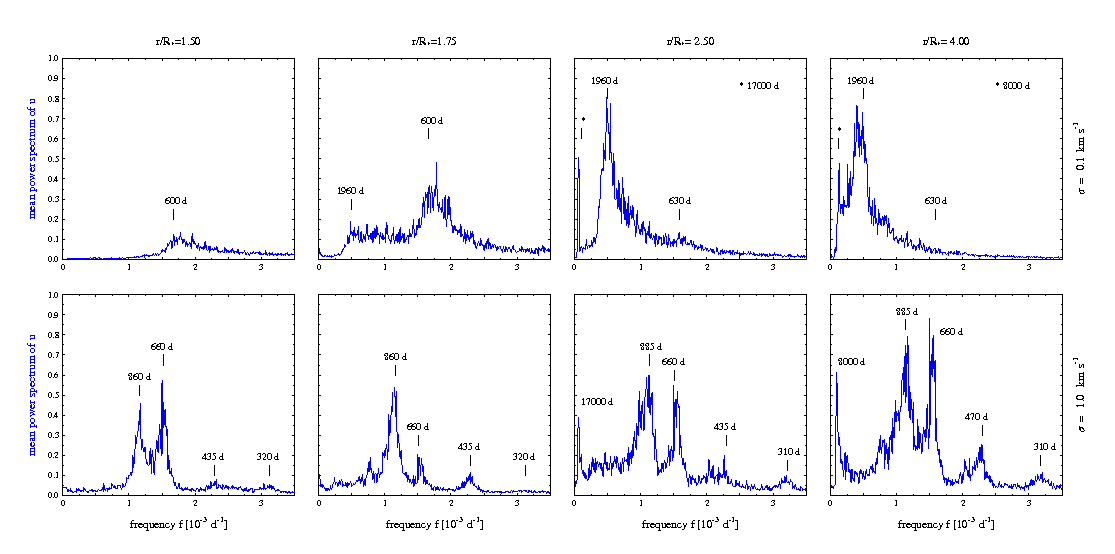
For the higher excitation strength , the power spectrum looks much richer in detail than for with at least five distinct maxima. Even closer to the star where the medium is too hot to allow for effective dust formation, two strong peaks at and can be seen. Here, the dynamics of the gas are influenced by the backwarming of the dust and the dilution wave originating in the dust nucleation zone (cf. Paper I). With increasing distance from the star, additional maxima appear at , , and .
Similar to the case of a self-excited CDS (Paper I), which can be characterised by an eigenmode , these frequency maxima are characteristic of the dynamics of envelope around low and standard luminous LPVs and Miras. The result shows that a CDS does not simply mimic an external excitation but has its own eigenmodes, which are determined by the complex interplay between dust formation, growth, radiative transfer, and hydrodynamics. It has also become apparent that the response of the CDS strongly depends on the excitation strength. It is assumed that the maxima at for and at for belong to the same eigenmode, whose frequency is detuned towards lower values as the strength of the excitation increases.
4.2 Dynamics of periodically excited envelopes
This section examines the response of the CDS to an external excitation by a sinusoidally oscillating stellar
atmosphere (cf. Sect. 2.1). Owing to the inherent non-linearities of a dust-forming system, the
CDS does not generally oscillate with the applied frequency but usually exhibits a much more complex behaviour.
Depending on the excitation frequency, it may exhibit an irregular or periodic behaviour.
Since the dynamics in CDSs are strongly influenced by the presence of dust, we focus our investigation
not only on the dust-formation zone, but also on the physical quantities responsible for providing favourable
conditions for dust formation, such as gas velocity , density , and temperature .
4.2.1 Excitation frequency
Figure 5 shows the most prominent shell modes normalised by the eigenfrequency in the dust nucleation zone at as a function of the excitation period in the case of our reference model. Once again, the perturbation force was taken as the sine of period according to Eqs. (1) and (2), whereas the amplitude was held at .
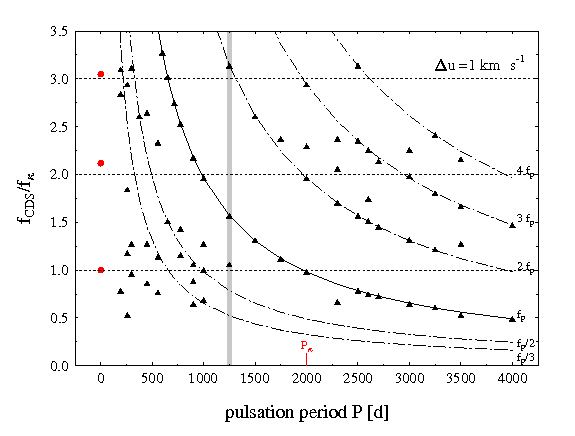
The excitation frequency itself and some of its harmonics are recognisable for all periods , whereas the determined eigenmodes are only visible for small excitation periods .
-
•
Irregular domain
For small and intermediate excitation periods , the power spectra show a rather extended continuum with a number of distinct maxima. Some of these could be identified as eigenmodes of the CDS or as their harmonics. Also, the subharmonics and of the excitation frequency show up. As the pulsation period increases, the excitation period and its harmonics become clearly recognisable. In contrast, the amplitude of the envelope’s eigenmode mostly decreases as increases. Within this domain a kind of resonance phenomenon between excitation and envelope period occurs. The envelope reacts multiperiodically for a sensitive range of excitation period P and strength . -
•
Pulsation-dominated domain
For longer periods , the CDS becomes finally enslaved by the excitation force. The most prominent feature of the spectrum is the pulsation mode supplemented by a set of its harmonics.
In general, the final velocity has a fairly high value with a maximum at for . With increasing period , the velocity continuously slopes downward to at period . The corresponding mass loss rates show the same trend. The maximum mass loss rate is for , and the minimum for (cf. Table 2).
| - | ||||||
| - | ||||||
-
a
Values in boldface indicate the most dominant mode and underlined values the excitation frequency
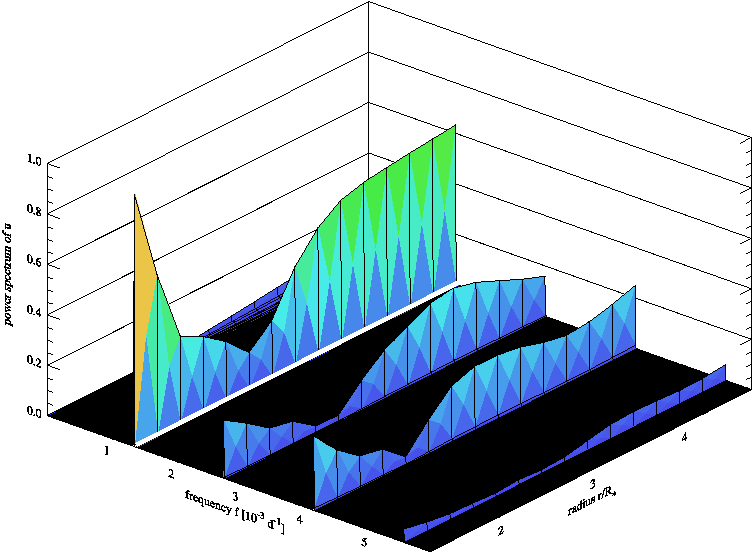
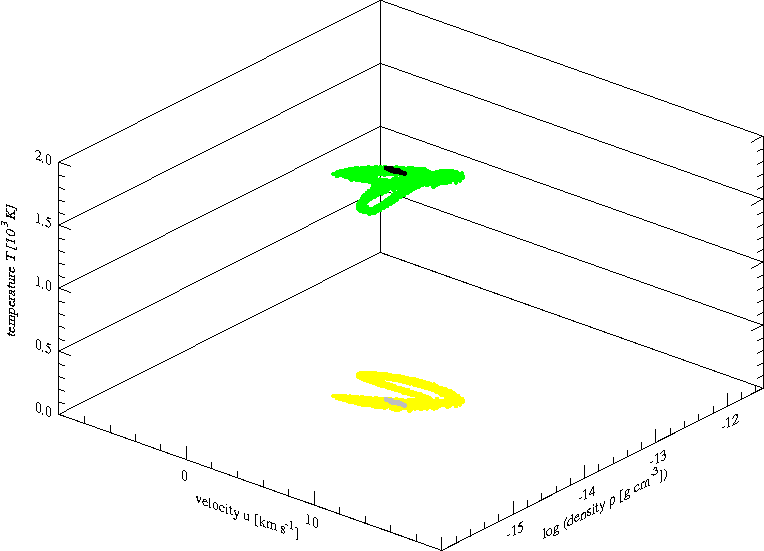
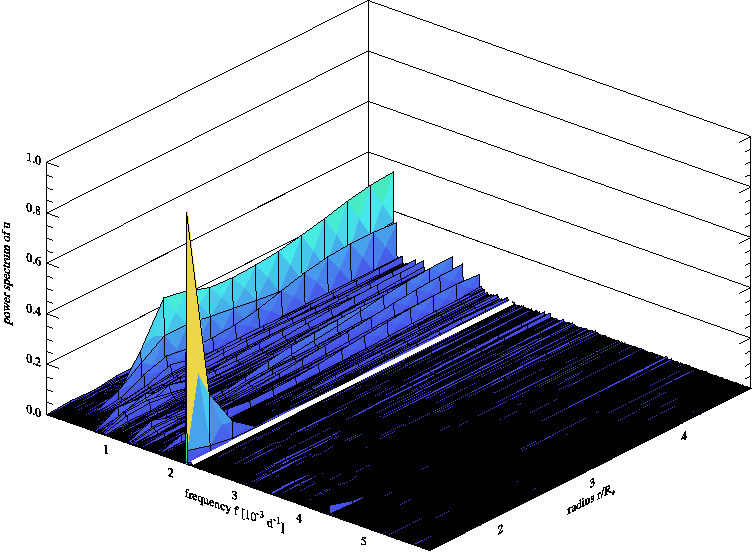
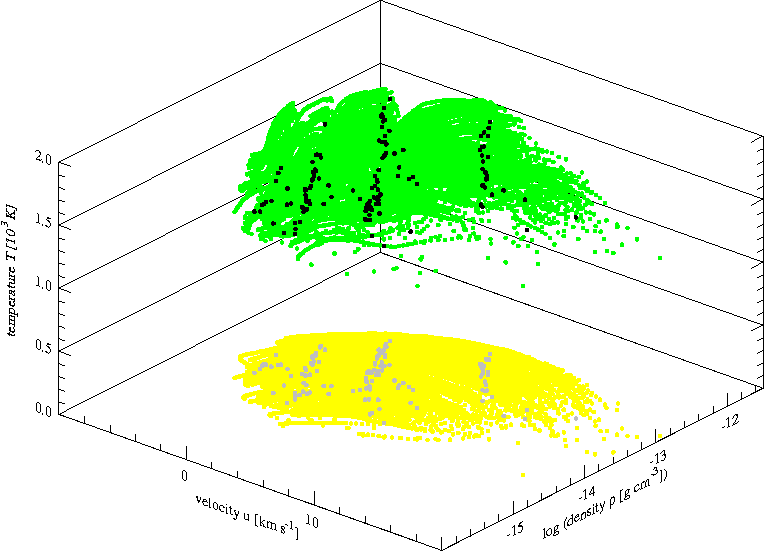
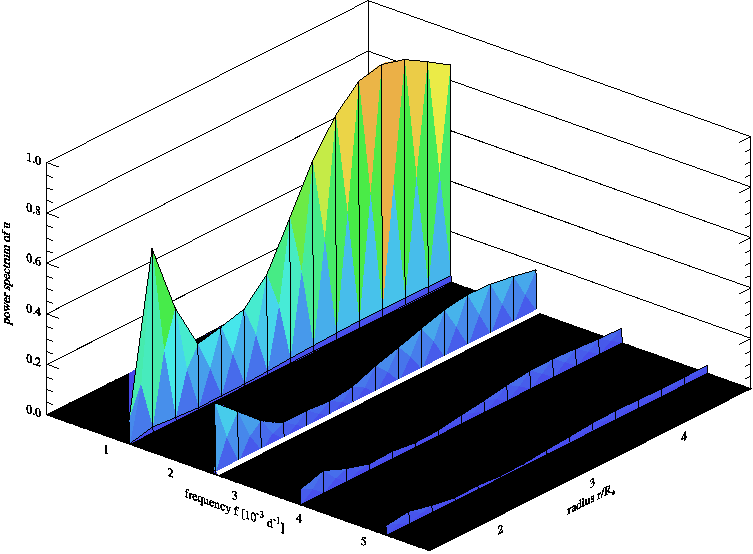
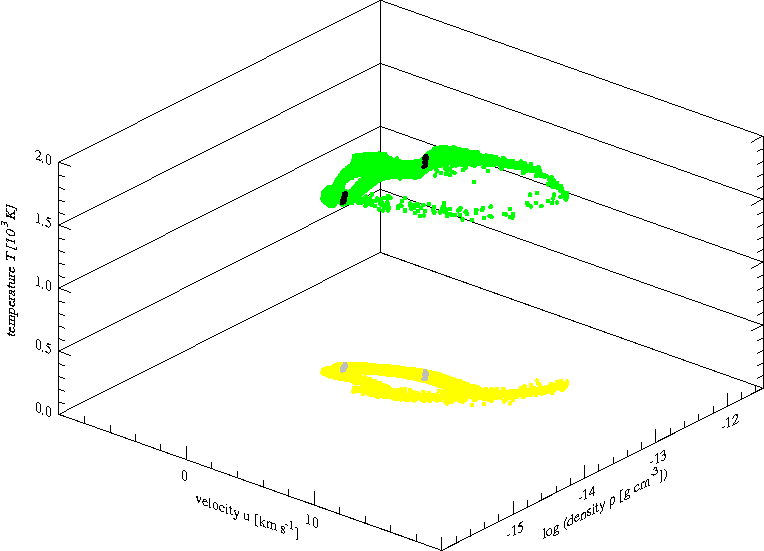
Figure 6 demonstrates the basic behaviour of the envelope for some selected monoperiodic excitation periods , , and chosen from the irregular shell dynamics regime. The left panels display the power spectra of the local expansion velocity by scaling to the overall strongest mode. Finally, the right panels present the stroboscopic maps in the (, , )-phase space, supplemented by a projection onto the (, )-plane. Both were sampled at an interval . They also show the corresponding state of the system at a constant phase angle , i.e. (Poincaré map) in the dust nucleation zone at .
As can be seen in the uppermost and lowermost spectra, the CDS reacts with the same dominant mode , even though it is excited with different periods and . This is similar to the resonance phenomenon () studied in paper I for high-luminous Miras and LPVs. However, for the case of standard luminous LPVs and Miras studied in this paper we always found , which means that the period of the CDS appears as an integer multiple of the excitation period (). In the context of circumstellar envelopes, this phenomenon is often referred to as multiperiodicity (cf. Winters et al. 1994; Fleischer et al. 1995; Höfner et al. 1996). As indicated by the number of the black clusters in the stroboscopic maps, the system reacts monoperiodically (single black cluster, upper right panel, i.e. ) for an excitation with , whereas the system’s response is double-periodic (two black features in the lowermost plot on right, i.e. ) for an excitation with . In other words, the system returns to the same state after a time interval . The corresponding curves in the -hyper plane are restricted and closed. Nevertheless, some parts of the trajectory are passed through extremely rapidly, so that these parts are only depicted by a few points on the corresponding stroboscopic map.
For , as can be seen from the power spectra in the middle-left panel, the excitation period does
not dominate the envelope. The amplitude of the piston frequency
is weak, and the frequency spectrum shows up with distinct maxima at , which is a characteristical timescale of the CDS and , which seems to correspond to the somewhat-shifted feature providing
the resonance case for this model. This is also consistent with the stroboscopic map given in the middle-right panel.
In contrast to and , the system is not limited to a closed trajectory in the
-space but rather completely fills out a continuous part of the phase space. However, the dynamics
of the envelope once more seem to synchronise with the excitation period to some extent. For a constant phase angle of the
stellar pulsation, i.e. , the system stays inside well-defined stripes that cut through
the entire phase-space area filled out by the system.
4.2.2 Excitation strength
This section studies the above-mentioned reference model with regard to the response of the CDS for a sinusoidally stellar pulsation with period , i.e. a typical oscillation period of LPVs and Miras, over a sequence of varying strengths, i.e. amplitudes . The amplitude starts with a value of , so the disturbance is subsonic, and is then increased up to i.e. into the supersonice regime. Table 3 lists the results of these calculations.
The excitation frequency itself is only noticeable for a low excitation strength of . Because weak in power, it vanishes with increasing excitation strengths. The inertial envelope is not able to follow the short excitation period; in fact, this mode at no time does it dominate the envelope dynamics. Actually, the first subharmonic of the excitation frequency dominates the dynamics. It can be regarded as a detuned envelope-eigenmode . Subsequently, the eigenmode at takes over the dominance of the shell dynamics. In general, the CDS-eigenmodes are detuned towards lower frequencies as already shown in the case of a CDS around a high-luminous LPV (cf. paper I). The stellar pulsation leads to a levitation of the atmosphere; i.e., it lifts the material out of the gravitational field into the dust-forming zone. With increasing strength of the pulsation amplitude , the additional input of energy and momentum leads to an enhanced density in the dust-forming region and supports further dust formation rather than accelerating the wind. Consequently, the stellar wind becomes far more massive, and the mass loss rate increases from for to for at nearly constant velocity. As the wind becomes more intense, the periodic depletion in dust-forming material also increases, and it takes more time to re-enrich the nucleation zone. The result is a longer shell period as seen in Table 3.
-
a
Values in boldface indicate the most dominant mode, whereas single and double underlined values refer to the excitation frequency and its first harmonic, respectively.
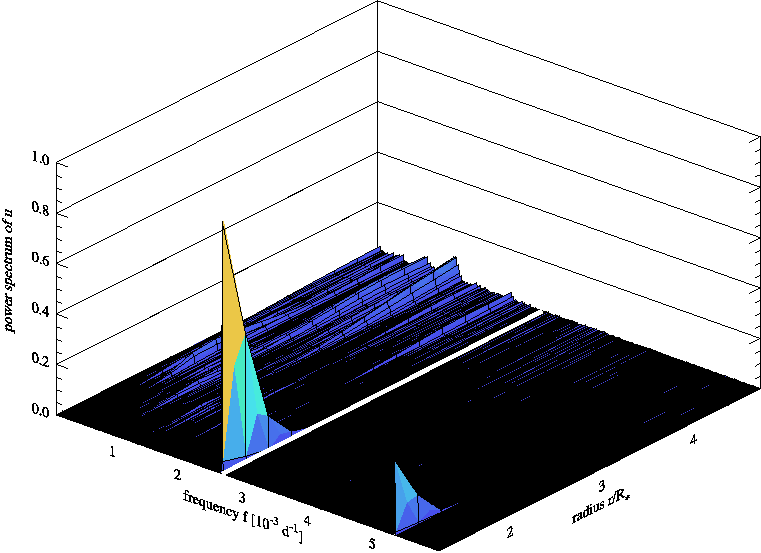
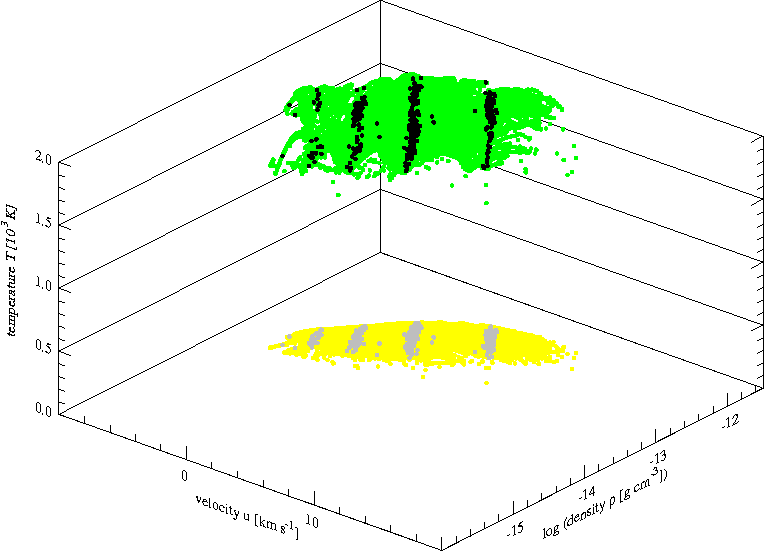
Figure 7 depicts the spectrum and maps of the reference CDS excited with period and amplitude . With increasing amplitude the CDS behaviour changes from multiperiodic to irregular, as can be seen in the stroboscopic maps (cf. Fig. 6, lowermost panels, right and Fig. 7, right). The double periodicity breaks up. As can be seen in the power spectrum, the timescale of the stellar pulsation (excitation modes) imprints their dynamics onto the envelope close to the star. With onset of the dust formation at a continuous power spectrum appears rather than distinct modes in terms of the radial excitation frequency.
5 Summary and outlook
In this article we have investigated the dynamics of envelopes around standard and low-luminous, carbon-rich AGB stars. We analysed the numerical solutions of the coupled equation system of hydrodynamics, thermodynamics, dust nucleation and growth, and radiative transfer by means of power spectra and stroboscopic maps of quantities, such as radial outflow velocity, temperature, and density.
As shown for the case of CDSs around highly luminous AGBs, the presence of dust influences the dynamical and energetic behaviour of the entire system. Firstly, it amplifies the momentum coupling between matter and radiation field, and secondly, it enforces an additional dynamical behaviour (exterior -mechanism) besides the pulsation to the dust envelope. The consequence of the coupling is the development of an envelope dynamics, which is in fact excited by the momentum and energy input by the stellar pulsation, but is operating on the timescales of the physical processes that determining the envelope. These dynamics can be characterised by a set of autonomous frequencies that are not identical to the frequency of the pulsation.
For CDSs around low and standard luminous AGBs, such distinct frequencies are not obvious. To study the shell eigendynamics, the system has to be supplied with energy and momentum. This we have done by introducing an additional force, regarded stochastic, e.g. provided by convection in the giant’s atmosphere. The goal is to supply enough energy to introduce a CDS generating mass loss, but also to minimise the influence on the CDS’s eigendynamics.
When applying this method with different stochastic noise intensities to a reference CDS, the power spectra of the radial velocity show up as a set of eigenmodes of about , which represents the dynamical timescale of dust formation and element enhancement in the dust formation zone. To study the interaction between the envelopes’s eigendynamics and stellar pulsation, a parameter study of various stellar excitation periods and strengths was carried out. Depending on the stimulation, the system reacts periodically, multiperiodically, or irregularly. For short excitation periods, the considered power spectra suggest that the CDS models tend to be semi-regular or even chaotic. The timescale of the excitation is much smaller than the timescale of the various physical processes (in particular the timescale of dust formation) in the envelope, so that the shell is not able to follow the excitation. For long periods the system is dominated by the external excitation. In contrast to envelopes around high luminous AGBs, no eigenmode-dominated domain could be found. In a closer examination of excitation periods from the irregular domain, we found the same resonance phenomenon () as in the case of envelopes around high-luminous LPVs and Miras. However, it turns out that the integer j always equal 1 for standard luminous AGBs.
Combined with the analysis method of shells around highly luminous AGBs already presented in a previous article, we are now able to start a systematic stellar parameter study. In order to compare the results with observations, this planned study will also analyse synthetic lightcurves and spectra.
References
- Barthés & Tuchman (1994) Barthés D.,Tuchman Y.: 1994, A&A, 289
- Bowen (1988) Bowen G.H.: 1988, ApJ, 329, 299
- Bowen & Willson (1991) Bowen G.H., Willson L.A.: 1991, ApJ, 375, L53
- Eddington & Plakidis (1929) Eddington A.S., Plakidis L.: 1929, MNRAS, 90, 65
- Dreyer et al. (2009) Dreyer C., Hegmann M., Sedlmayr E.: 2009, A&A, 499, 765
- Fleischer et al. (1992) Fleischer A.J., Gauger A., Sedlmayr E.: 1992, A&A, 266, 321
- Fleischer (1994) Fleischer A.J.: 1994, PhD thesis, Technische Universität Berlin, FRG
- Fleischer et al. (1995) Fleischer A.J., Gauger A., Sedlmayr E.: 1995, A&A, 297, 543
- Fox & Wood (1982) Fox M.W., Wood P.R.: 1982, ApJ, 259, 198
- Gail & Sedlmayr (1988) Gail H.P., Sedlmayr E.: 1988, A&A, 206, 153
- Gauger et al. (1990) Gauger A., Gail H.P., Sedlmayr E.: 1990, A&A, 235, 345
- Höfner et al. (1995) Höfner S., Feuchtinger M.U., Dorfi E.A.: 1995, A&A, 297, 815
- Höfner et al. (1996) Höfner S., Fleischer A.J., Gauger A., Feuchtinger M. U., Dorfi E.A., Winters J.M., Sedlmayr E.: 1996, A&A, 314, 204
- Whitelock et al. (1991) Whitelock, P.A., Feast, M.W., Catchpole, R.M.: 1991, MNRAS, 248, 276
- Lucy (1971) Lucy L.B.: 1971, ApJ 163, 95
- Lucy (1976) Lucy L.B.: 1976, ApJ 205, 482
- Percy & Colivas (1999) Percy J.R., Colivas T.: 1999; PASP, 111, 94
- Unno & Kondo (1976) Unno W., Kondo M.: 1976, PASJ 28, 347
- Winters et al. (1994) Winters J.M., Fleischer A.J., Gauger A., Sedlmayr E.: 1994, A&A 290, 623
- Wood (1979) Wood P.R.: 1979, ApJ, 227, 220