High-resolution imaging at the SOAR telescope
Abstract
Bright single and binary stars were observed at the 4.1-m telescope with a fast electron-multiplication camera in the regime of partial turbulence correction by the visible-light adaptive optics system. We compare the angular resolution achieved by simple averaging of AO-corrected images (long-exposure), selection and re-centering (shift-and-add or “lucky” imaging) and speckle interferometry. The effect of partial AO correction, vibrations, and image post-processing on the attained resolution is shown. Potential usefulness of these techniques is evaluated for reaching the diffraction limit in ground-based optical imaging. Measurements of 75 binary stars obtained during these tests are given and objects of special interest are discussed. We report tentative resolution of the astrometric companion to Aqr B. A concept of advanced high-resolution camera is outlined.
1 Introduction
Progress of observational astronomy depends mostly on advances in the wavelength coverage, sensitivity, and angular resolution. Although the record in resolution is set by long-baseline interferometers, imaging and spectroscopy of faint sources is done today at the angular resolution of adaptive optics (AO) in the infra-red (IR) and at the resolution of the 2.4-m Hubble Space Telescope in the visible. Reaching the diffraction limit in the visible from the ground for progressively fainter sources continues to be an important goal for astronomy. Here we report on new experiments in this direction.
Diffraction-limited resolution at large ground-based telescopes has been first attained by speckle interferometry (Labeyrie, 1970). In the following years, modifications to this method to obtain true images, rather than their auto-correlations (ACFs), have been developed. One of the early approaches consisted in shifting the images to concidence of their brightest pixels and accumulating the result. This shift-and-add (SAA) method (Bates & Cady, 1980; Bates & Fright, 1982) has been used to reconstruct the first image of stellar surface (Lynds, Warren, & Harvey, 1976). It has been demonstrated that this approach is superior to simple tip-tilt compensation (Christou, 1991). Tip-tilt correction works well only at moderate ratios ( – telescope diameter, – Fried parameter); in this case, selection of the sharpest images with prominent central speckle is a good strategy. For , the probablity of obtaining diffraction-limited image without turbulence correction becomes negligible, but the SAA method and speckle interferometry still work.
The development of electron-multiplication CCD (EMCCD) detectors made it practical to record sequencies of short-exposure frames without readout noise penalty. On this occasion, the SAA method was revived under a new name, lucky imaging (Baldwin, Warner, & McCay, 2008). A combination of re-centering on bright pixel and selection of best frames was proposed. The selection works well only at small , restricting this approach to long wavelengths and to telescopes with m. However, partial turbulence correction with AO effectively increases , and the SAA method can give good results at larger apertures (Law et al., 2009). Dedicated high-resolution imagers such as LuckyCam (Law et al., 2006) or FastCam (Oscoz et al., 2008) were built to take advantage of these new opportunities.
An AO system for partial image correction in the vsible, SOAR Adaptive Module (SAM), is being built at CTIO (Tokovinin et al., 2004, 2008a) for the Southern Astrophysical Research Telescope (SOAR). This instrument will use a Rayleigh laser guide star to selectively correct low turbulence layers. The diffraction limit will not be reached, but the effective increase of resulting from the partial correction will boost the potential of other methods such as speckle interferometry and SAA. First tests of these methods at SOAR are described by Tokovinin & Cantarutti (2008) and Cecil & Rashkeev (2007), respectively.
In this paper we report some results from the first tests of SAM. At this stage, natural guide stars (NGS) were used to close the AO loop. We begin with the description of our experiments in Section 2 and the analysis of the AO performance in Section 3. Then three methods of data processing – simple averaging, SAA, and speckle interferometry – are compared in Section 4. Measurements of close binary stars obtained as a by-product of these tests are reported in Section 5; they continue the series of speckle observations published by Tokovinin, Mason, & Hartkopf (2010a) (hereafter TMH10). Some pairs deserve special comments; two faint tertiary companions in wider binaries were resolved for the first time. We conclude in Section 6 with a perspective of diffraction-limited imaging in the visible.
2 Description of the experiments
SOAR is located at the Cerro Pachón observatory in Chile, at 2800 m above the sea level. It has alt-azimuth mount with two Nasmyth and several bent Cassegrain focal stations fed by a flat mirror M3. This mirror can be actuated in tip and tilt.
The SOAR Adaptive Module (SAM) is an AO system for correcting wave-front distortions and feeding improved images to science instruments (Tokovinin et al., 2004, 2008a). SAM has internal re-imaging optics (two off-axis paraboloids), turbulence corrector (60-element curvature deformable mirror, DM), and a 10x10 Shack-Hartmann wave-front sensor (WFS). The SAM instrument is designed to work with a laser guide star, but initially it used natural guide stars (NGS). The light of an on-axis star was mostly reflected to the WFS by a neutral beamsplitter placed after the DM, with 14% transmitted to the science detector. The latter was a High-Resolution Camera (HRCAM) which contained an EM CCD with a pixel scale of 15.23 mas and filters (Tokovinin & Cantarutti, 2008). Owing to the light attenuation by the beamsplitter, we observed only relatively bright stars.
SAM was installed in August 2009 at the Nasmyth focus, receiving the light after four reflections in the telescope. It rotates as a whole for compensating field rotation as the telescope tracks stars. The AO loop cycle was 4.3 ms, with a 2-cycle delay between WFS measurement and correction. To compensate for this relatively slow loop, we used the Smith predictor (SP) controller (Madec, 1998). Alternatively, a standard leaky integrator (INT) with a gain of 0.25 was tried. The degree of AO correction is equivalent to compansation of 45 Zernike modes.
Of the three engineering runs assigned to these tests in August - October 2009, the first was completely lost to clouds, the second produced 1.5 nights of data under fast and poor seeing of , the third and last run enjoyed few hours of good conditions (seeing 05 to ).
We pointed telescope to single or multiple bright stars, closed the AO loop and recorded, typically, 400 images with 20-ms exposure time and EM gain of 44. Only the central region of was recorded in most cases. In parallel, we frequently saved data from the AO loop (sequences of centroids and DM voltages) for off-line analysis.
3 Analysis of the AO loop data


We calculate the first 45 Zernike coefficients of the input (atmospheric) and corrected (residual) wave-fronts (in radians at m) from the AO loop data. The DM voltages are converted into corresponding slopes by matrix multiplication, using the recorded AO interaction matrix. The slopes, in turn, are converted into Zernike coefficients by means of the calculated theoretical slopes of Zernike modes (gradient matrix); we simply multiply the vector of slopes by the pseudo-inverse gradient matrix. Of course, the Zernike coefficients derived in this way contain errors due to noise on the measured slopes and cross-talk with higher-order modes (aliasing).
The Fried radius and seeing are estimated from the variance of Zernike coefficients which should, in theory, equal (Noll, 1976). The ratio of measured variances to the Noll’s coefficients is averaged using modes from 7 to 19 to get an estimate of . The atmospheric coherence time is derived from the temporal variation of the defocus coefficient , as described by Tokovinin, Kellerer, Coudé du Foresto (2008b). Its values at m ranged from 1 ms to 3.5 ms. Both and derived from the loop data are in reasonable agreement with simultaneous measurements from the MASS-DIMM site monitor (Tokovinin et al., 2010b).

Temporal power spectra of the Zernike coefficients corresponding to the input (un-corrected) wave-fronts are calculated from the DM signal, with division of the raw power spectrum by the theoretical frequency response of the closed AO loop. The high-frequency part of those spectra shows a typical power-law decline proportional to , with exponents between 2 and 3 (Fig. 1). A high-frequency asymptotic decline with is characteristic of atmospheric tilts, while a steeper dependence with is expected for the defocus and higher modes (Roddier et al., 1993). This mismatch between theory and real spectra has also been observed with physically simulated turbulence in the laboratory and reproduced in the numerical simulations. Most probably, it is caused by the atmospheric errors of WFS slope measurements (Thomas et al., 2006) and by the aliasing of higher-order modes, as shown by Véran & Poyneer (2010).
The power spectra of the residual coefficients derived from the WFS signal show that distortions with low temporal frequencies (up to 20 Hz) are compensated, while high frequencies are amplified. This amplification is caused by the AO servo system and depends on the type of temporal controller used; the SP controller gives more high-fequency errors than INT. The spectra of residual coefficients match very well their expected shape – a product of the input disturbance and the AO loop error transfer function (Fig. 1).
Quasi-periodic signals caused by vibrations are seen as narrow “lines” superposed on the otherwise smooth spectra of input or residual distortions. Such lines are detected in modes up to 6 (astigmatism), but are not present in the higher-order modes. The focus coefficient almost always has a line at 47 Hz. This frequency is too high to be caused by a real focus variation in the telescope. It is suspiciousy close to the 1/5 of the loop frequency and is likely of instrumental origin (we do not see such signal in the laboratory, however). On the other hand, the 50-Hz component in the tip and tilt coefficients is real. This vibration is caused by the pick-up noise in the position sensors of the SOAR fast tip-tilt mirror, M3. This signal is detected by the standard SOAR guider, as well as directly in the voltages of the M3 drives (M. Warner, private communication). By extracting the 50-Hz component from the SAM loop signal, we show that motions on both axes are co-phased (Fig. 2). The amplitude of these vibrations and relative phase shift between the axes are not constant. On October 2, 2009, the worst-case rms amplitude was 19 mas, the smallest one – 3 mas.
As the typical exposure time in speckle interferometry is 20 ms – one full period of the 50-Hz vibration – the speckle structure is sometimes blurred and the resolution does not reach the diffraction limit (30 mas in the visible). If the vibration ellipse is narrow, as in Fig. 2, the resulting blur can mimic a close binary with separation of 20-50 mas. Such effect was indeed seen in the previous speckle data obtained at SOAR (TMH10). It biases the measurements of very close binaries in un-controlled way. Modification of the M3 drive electronics is in progress. Once the 50-Hz component is eliminated, there will be no other sources of fast blur, making the SOAR telescope most suitable for diffraction-limited observations.
4 Imaging
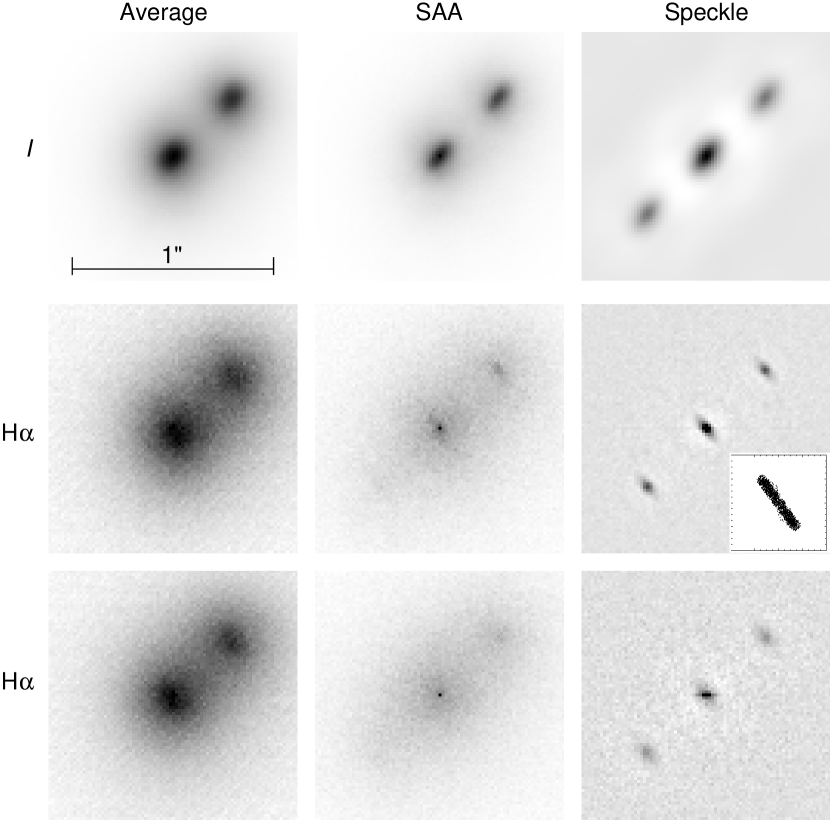
Series of short-exposure images were processed in three different ways (Fig. 3). In all cases we subtracted the average background to remove the fixed offset and the dark current which was non-negligible in a small number of “hot” pixes. All images are Nyquist-sampled.
Speckle interferometry in its standard form is implemented as described in TMH10. We compute the power spectrum from all images in each series, remove the photon-noise bias, filter out the low frequencies and derive by inverse Fourier transform the average auto-correlation function (ACF). The phase information is lost, but the diffraction-limited resolution can be reached even without AO correction.
We found that fast wave-front distortions amplified by the SP controller in closed loop (cf. Fig. 1) blur the high-frequency structure in the 20-ms images and degrade the resolution in the speckle mode. At the same time this controller gives similar or smaller overall wave-front residuals as the INT controller with a gain of 0.25; the resolution in the long-exposure images is also a little better with the SP controller.
All data on binary stars were processed uniformly by speckle interferometry to derive relative component positions and magnitude differences (see Sect. 5). For the analysis of AO imaging performance, we de-convolve the binary signature (as determined by the speckle processing) and derive the point spread function (PSF).
Long-exposure images were obtained as simple averages of the data cubes. Typically, the total exposure was about 12 s (30 Hz frame rate, 400 frames). As an option, we could re-center individual images before averaging; the images were shifted by integer number of pixels as determined by their centroids. Re-centering brings almost no resolution gain when the AO loop is closed. Therefore we restrict further analysis to long-exposure images.
SAA imaging is implemented by selecting a certain fraction of the sharpest images in a given series and co-adding them with re-centering on the brightest pixel. In this case, the most prominent, diffraction-limited speckle is enhanced in the average image, while fainter speckles are averaged out and contribute to the diffuse halo. As a result, a PSF with a diffraction-limited core and a halo is obtained, reminiscent of partially-corrected AO images. Combination of partial AO correction with re-centering on the brightest pixel gives better results than each of these methods alone.
For the image selection, we experimented with different criteria such as second moment or sharpness and found that selection on the maximum image intensity works best, in agreement with Smith et al. (2009). As to the fraction of retained images, it is not critical. The resolution gain is achieved mostly by re-centering, not by selection. We co-add the best 20% frames to produce the SAA images. For faint stars, the choice of the brightest pixel is affected by the noise, leading to a sharp 1-pixel spike at the center; this spike was replaced by the average of its neighbours for PSF evaluation. In the case of a binary star with components of comparable brightness, the noise and speckle fluctuations cause the brightest pixel to belong sometimes to the secondary component. As a result, a weaker false spike located symmetrically with respect to the primary component appears in the SAA image.
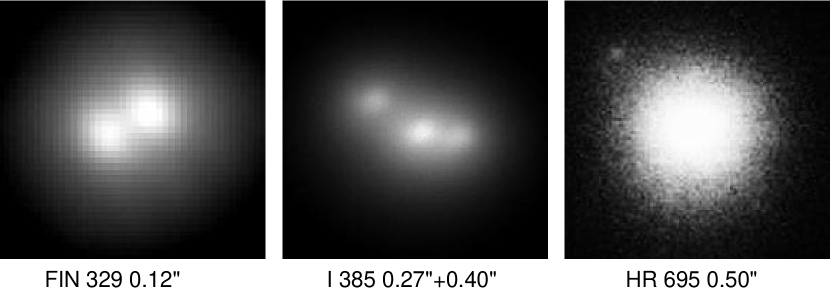
Figure 4 gives some representative images of multiple systems observed on October 2, 2009 in closed loop with the SP controller. As expected, the best resolution in the long-exposure compensated images is reached in the band (wavelength 0.8 m), so most of the data were obtained in this filter. The resolution gain over un-compensated, seeing-limited imaging is impressive, even at shorter wavelengths. For example, three images taken one after another in the , , and filters show the long-exposure FWHMs of , and respectively under a seeing.

The SAA (co-addition of re-centered images) produces a FWHM with diffraction-limited core even without AO correction. We obtained such images from the data of 2008-2009 speckle runs at SOAR recorded under a 05 seeing. Partial AO correction helps to concentrale the light in few bright speckles and thus enhances the range of conditions where this method works well (Law et al., 2009). We found that under partial AO correction the SAA post-processing yields a better resolution than simple averaging. However, as the seeing improves and the AO correction becomes good, the additional gain brought by this technique becomes less evident (Fig. 5). Average FWHM for the 22 points in Fig. 5 is 025 and 018 for the long-exposure and SAA, respectively.


Radial profiles of the PSFs under good and partial AO correction are plotted in Fig. 6. For comparison, Gaussian profiles with the seeing-limited FWHM are given, using values estimated form the AO loop. The shape of the AO-corrected PSFs is different from a Gaussian and resembles a negative exponent. Such PSF is typical for an AO system like SAM, according to our simulations.
A detailed comparison of various processing techniques is presented in Fig. 3. The binary star BU 172 was observed at zenith distance under average seeing ( m to 0.14 m from the loop data). The first row demonstrates good compensation in the band (long-exposure FHWM 018) achieved with the INT loop controller. The SAA and speckle processing increase the resolution to the point where the atmospheric dispersion (47 mas in the direction parallel to the binary) becomes visible. The dispersion is negligibly small (5 mas) in the narrow-band H filter, but the AO compensation at this longer wavelength is not so good (FWHM 033). The photon flux is low, so the SAA method does not work very well, while the speckle processing gives a stronger signal. The images are elongated perpendicularly to the binary by the 50-Hz vibrations (see the insert) of peak-to-peak amplitude 45 mas, in this case. Finally, when the SP controller is used, the images become more fuzzy because of the rapid residual wavefront jitter. However, the average image is even a little sharper (FWHM 031) than with the INT controller.
Although the binary BU 172 is bright, the flux is decreased by by the beamsplitter in SAM and, further, by by the narrow-band H filter (in comparison with or bands). Therefore, the photon flux is equivalent to a binary star with observed in a wide band without SAM beamsplitter. Further gain in sensitivity by at least is achievable with a better detector; the quantum efficiency is presently only about 0.5, while the clock injection charge (about 40 photons per frame) is a serious limitation for faint stars. Considering that this observation is not yet close to the limit, there are reasons to believe that stars down to can be observed at diffraction-limited resolution in speckle or lucky mode with SAM.
5 Results on multiple stars
5.1 Binary-star measurements
Relative positions and magnitude difference in close binary stars were measured by speckle interferometry, following the same procedure as in TMH10. We took advantage of that work to calibrate new results from SAM on common wide systems and found that the pixel scale remained the same within errors, 15.23 mas. An offset in position angle of has been determined and corrected. For the most part, we measured bright and well-known systems, although some recently discovered close pairs were also observed.
Table 1 lists 122 measurements of 75 resolved binary stars. Its columns contain (1) the WDS (Mason et al., 2001) designation, (2) the “discoverer designation” as adopted in the WDS, (3) an alternative name, mostly from the Hipparcos catalog, (4) Besselian epoch of observation, (5) filter, (6) number of individual data cubes, (7,8) position angle in degrees and internal measurement error in tangential direction in mas, (9,10) separation and its internal error in mas, and (11) magnitude difference . An asterisk follows if is determined from the resolved photometry (see TMH10 for details). A colon indicates that the data are noisy and is likely over-estimated. Note that in the cases of multiple stars, the positions and photometry refer to the pairings between individual stars, not with photo-centers of sub-systems.
For stars with known orbital elements, columns (12–14) of Table 1 list the residuals to the ephemeris position and the reference to the orbit from the 6th Orbit Catalog (Hartkopf et al., 2001). Some measurements from this work were used to calculate improved orbits by Mason, Hartkopf, & Tokovinin (2010); these orbits are referenced as Msn2010 in Table 1.
In most cases we see binary companions in the SAA images and can thus resolve the ambiguity inherent to the speckle method. For a few pairs where this was not possible, the position angles are preceded by the letter A (ambiguous).
5.2 Comments on individual systems

005222237 = STN 3 has a new faint tertiary component D at 057 from B with . As the separation in the wide pair AB is only , the triple system appears to be close to the dynamical stability limit. We cannot exclude that the new companion is just an unrelated background source projecting on the AB. The companion C listed in the WDS is in fact such a background source, as evidenced by its relative motion since 1897. However, the actual separation of AC is , so the C companion was well outside the field.
020572423 = HIP 9744 is a close visual triple star consisting of the 08 pair AB = I 454 and the inner spectroscopic binary Aa,Ab (Tokovinin & Smekhov, 2002). It forms a quadruple or quintuple system together with HIP 9769 which has common radial velocity, parallax, and proper motion with HIP 9774, at separation.
We determined a preliminary spectroscopic orbit of the Aa,Ab sub-system with a period of 2.6 y and eccentricity 0.76. The estimated semi-major axis of this pair is 43 mas, indicating that it can be resolvable at 4-m telescopes. First resolution of Aa,Ab (named on this occasion WSI 71) was achieved in July 2008, shortly after passage through the periastron (TMH10). The pair was resolved again in October 2008 at SOAR and observed also on October 2, 2009 with SAM. By that time the components opened up to 42 mas.
An attempt to combine the three position measurements with the known spectroscopic orbit has shown that the separations and magnitude differences in the published speckle observations are likely over-estimated. They were determined jointly with the position of the wide pair Aa,B by fitting a triple-star model. We re-processed all speckle data by imposing a constraint , as determined from the relative intensity of component’s lines in the resolved spectra. The presence of the wide companion B was ignored by fitting only the close binary. This reprocessing gives closer separations of Aa,Ab, as expected (Table 2). No formal errors are given because measurements of such close binaries can be seriously biased by vibrations (see above).
| Epoch | [OC]θ | [OC]ρ | ||
|---|---|---|---|---|
| (deg) | (′′) | (deg) | (′′) | |
| 2008.5406 | 132.4 | 0.027 | 9.9 | 0.002 |
| 2008.7700 | 188.7 | 0.019 | 15.8 | 0.000 |
| 2009.7558 | 286.3 | 0.042 | 5.1 | 0.007 |
Figure 7 shows a preliminary interferometric orbit obtained by fitting jointly radial velocities and resolved measurements. Clearly, more data are needed for a definitive solution. However, plausible values of the visual elements are obtained: semi-major axis mas, position angle of nodes and inclination .
Speckle interferometry is the only method for resolving such close binaries. Adaptive optics at 8-m telescopes has somewhat poorer resolution (diffraction limit mas in the band), whereas long-baseline interferometers lack the sensitivity and productivity to follow such binaries.
221163428 = HIP 109561 is a visual triple consisting of the 04 pair AB = BU 769 and the inner pair Aa,Ab = CHR 230. We marginally resolved the inner sub-system at almost the same position angle as measured in TMH10 (its estimated period is 100 y). Note that component A is a K1III giant and B is a blue star, possibly of A5V spectral type. Therefore the magnitude difference of AB is larger at longer wavelengths.
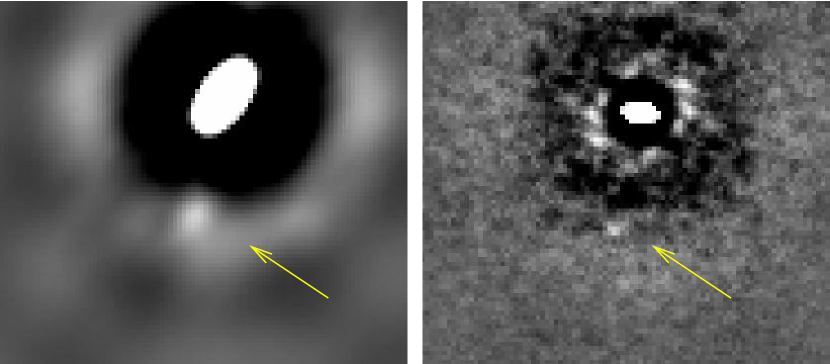

222880001 = Aqr B = HR 8558 is a secondary in the wide visual pair AB = STF 2909 with components of similar spectral types and magnitudes (F3V and F6IV, ) observed since 1821. Both stars are above the Main Sequence and have fast axial rotation. A “wavy” motion of AB suggested that there is an inner sub-system. Strand (1942) published the first astrometric orbit of this sub-system, attributing it to the component B. Several authors confirmed subsequently the 25-y astrometric wave and refined both outer and inner orbits; the latest are papers by Heintz (1984) and Scardia et al. (2009). The first direct resolution of the astrometric companion in the and bands was reported by McCarthy et al. (1982) who fitted one-dimensional scans in the North-South direction to a triple-star model. No further resolved observations of Ba,Bb were published to date. The component A was also resolved with speckle into a 0064 binary by Ebersberger & Weigelt (1979), but never confirmed ever since, despite several speckle measurements of AB at 4-m telescopes. Interestingly, Heintz (1984) dismisses both resolutions as bogus and attributes the 25-y sub-system to A, based on the astrometry of A and B.
Despite the controversy, the existence of a 25-y sub-system makes little doubt. Let us assume the mass of the Ba star in agreement with its spectral type and the dynamical mass sum derived from the AB orbit and adopt the mass sum of 1.9 for Bab. Then its period 25.8 y and the third Kepler’s law lead to a semi-major axis of 10.8 AU, or 034 with the Hipparcos parallax of 31.5 mas. The comparison with the astrometric semi-major axis mas (Heintz, 1984) leads to a mass ratio and , in broad agreement with other published estimates. The unseen component could be an M0V dwarf. In this case the magnitude difference with Ba in the band would be around . The estimated radial-velocity variation of Ba is km/s; it has never been detected, possibly because of the fast axial rotation.
We see a faint () companion to B in four data cubes – two in the band and two in H (Fig. 8). This resolution should be considered as tentative until confirmed by further measurements. It would be relatively easy to detect such a companion with AO in the infrared. The component A has also been observed with SAM and found unresolved.
The observed position of Ba,Bb, if it is real, does not match well the two recent astrometric orbits, which also differ from each other substantially (Fig. 9). In both cases we adopted the semi-major axis of 034. If we correct the periastron epoch in the orbit of Heintz (1984) from the original 2007.0 to 2004.0, it would agree with our observation.
6 Conclusions and outlook
To summarize, the first tests of SAM in its NGS mode have shown the following:
-
•
The AO system works as expected when closed on natural guide stars. The FWHM resolution of AO-corrected long-exposure images can be better than 02 in the -band and is significantly improved with respect to the seeing across the visible spectrum.
-
•
Fine speckle structure in the images with 20-ms exposure time can be blurred by the 50-Hz vibration originating in the SOAR tip-tilt mirror (soon to be improved) and by the amplification of fast atmospheric distortions in the AO loop using the SP controller. A softer controller is preferable for diffraction-limited imaging.
-
•
The SAA (“lucky”) processing of the data cubes improves the resolution for bright sources under partial compensation. It gives little additional gain under good AO correction and is less powerful than the speckle processing in the photon-starved regime.
-
•
Both speckle and SAA work well for stars as faint as if all available photons are used by the current HRCam. A further gain of 1-2 magnitudes could be achievable by using state-of-the-art EM CCD with a higher quantum efficiency and lower charge injection noise.
These first results suffer from small statistics and incomplete sampling of atmospheric conditions; more experiments are needed to substantiate and extend these findings.
Methods like speckle and SAA imaging, enhanced by partial AO correction, open a unique high-resolution niche. A non-exhaustive list of potential science programs includes:
-
•
Followup of close nearby binaries and determination of their orbits, leading to mass measurement (including pre-main-sequence stars), statistics of orbital elements, dynamics of multiple systems, etc.
-
•
Surveys of various stellar polulations for binarity delivering observational constraints on star formation.
-
•
Optical imaging of solar-system objects (planetary satellites, asteroids), see e.g. (Cecil & Rashkeev, 2007).
-
•
Studies of dense stellar aggregates (globular clusters, young groups like R 136a).
-
•
Resolved emission details around young stars (jets, disks)
Further interesting results are expected from the combination of the HRCam with SAM. In a more distant perspective, a dedicated high-resolution instrument will be worth considering. As the AO technology becomes mature and accessible, we envision building a small-field camera with integrated compact AO system. The light from the object (or its bright stellar component) will be divided in wavelength between the science channel and the WFS, e.g. by sensing the beam reflected from the science filter. An advanced WFS with a EM CCD would be able to operate on much fainter stars than is possible with SAM now. In fact, even the faintest stars will be useful. When the number of photons is not sufficient for fast turbulence correction, the AO system will work in the slow mode to compensate residual telescope aberrations (mostly defocus and tilts), delivering to the speckle camera truly seeing-limited images.
References
- Baldwin, Warner, & McCay (2008) Baldwin, J. E., Warner, P. J., & Mackay, C. D. 2008, A&A, 480, 589
- Bates & Fright (1982) Bates, R. H. T. & Fright, W. R. 1982, MNRAS, 198, 1017
- Bates & Cady (1980) Bates, R. H. T. & Cady, F. M. 1980, Opt. Comm. 32, 365
- Cecil & Rashkeev (2007) Cecil, G., & Rashkeev, D. 2007, AJ, 134, 1468
- Christou (1991) Christou, J. C. 1991, PASP, 103, 1040
- Ebersberger & Weigelt (1979) Ebersberger, J. & Weigelt, G. 1979, ESO Messenger, No. 18, 24
-
Hartkopf et al. (2001)
Hartkopf, W. I., Mason, B. D., & Worley, C. E. 2001, AJ, 122, 3472
http://www.ad.usno.navy.mil/wds/orb6/orb6.html - Heintz (1984) Heintz, W. D. 1984, ApJ, 284, 806
- Labeyrie (1970) Labeyrie, A. 1970, A&A, 6, 85
- Law et al. (2006) Law, N. M., Mackay, C. D. & Baldwin, J. E. 2006, A&A, 446, 739
- Law et al. (2009) Law, N. M., Mackay, C. D., Dekany, R. G., Ireland, M., Lloyd, J. P., Moore, A. M., Robertson, J. G., Tuthill, P., & Woodruff, H. C. 2009, ApJ, 692, 924
- Lynds, Warren, & Harvey (1976) Lynds, C. R., Warren, S. P., & Harvey, J. B. 1976, ApJ, 207, 174
- Madec (1998) Madec, P.-Y., 1998, in: Adaptive Optics in Astronomy, ed. F. Roddier, Cambridge Univ. Press, 1998, p. 131
-
Mason et al. (2001)
Mason, B. D., Wycoff, G. L., Hartkopf, W. I., Douglass, G. G., &
Worley, C. E.
2001, AJ, 122, 3466
http://ad.usno.navy.mil/wds/ - Mason, Hartkopf, & Tokovinin (2010) Mason, B. D., Hartkopf, W. I., & Tokovinin, A. 2010, AJ, 140, 735.
- McCarthy et al. (1982) McCarthy, D. W., Low, F. J., Kleinmann, S. G., Arganbright, D. V. 1982, ApJL, 257, L75
- Noll (1976) Noll, R. J., 1976, JOSA, 66, 207
- Oscoz et al. (2008) Oscoz, A. et al., 2008 in: McLean I. S., Casali, M. M., eds., Ground-based and airborne instrumentation for astronomy II. Proc. SPIE, 7014, paper 47
- Roddier et al. (1993) Roddier, F., Northcott, M. J., Graves, J. E., & McKenna, D. L. 1993, JOSA(A), 10, 957
- Scardia et al. (2009) Scardia, M., Prieur, J.-L., Pansecchi, L., Argyle, R. W., Sala, M. 2009, AN, 331, 286
- Smith et al. (2009) Smith, A., Bailey, J., Hough, J. H., & Lee, S. 2009, MNRAS, 398, 2069
- Strand (1942) Strand, K. A. 1942, AJ, 49, 165
- Thomas et al. (2006) Thomas, S., Fusco, T., Tokovinin, A., Nicolle, M., Michau, V., & Rousset, G. 2006, MNRAS, 373, 323
- Tokovinin & Smekhov (2002) Tokovinin, A. A. & Smekhov, M. G. 2002, A&A, 383, 118
- Tokovinin et al. (2004) Tokovinin, A., Thomas, S., Gregory, B., van der Bliek, N., Schurter, P., Cantarutti, R., & Mondaca, E. 2004, in: Advancements in adaptive optics, eds. Bonaccini Calia, D., Ellerbroek, B. E., Ragazzoni, R., Proc. SPIE, 2004, 5490, 870
- Tokovinin et al. (2008a) Tokovinin, A., Tighe, R., Schurter, P., Cantarutti, R., van der Bliek, N., Martinez, M. Mondaca, E., Montane, A. 2008a, Proc. SPIE, 7015, paper 157
- Tokovinin, Kellerer, Coudé du Foresto (2008b) Tokovinin, A., Kellerer, A., & Coude Du Foresto, V. 2008b, A&A, 477, 671
- Tokovinin & Cantarutti (2008) Tokovinin, A. & Cantarutti, R. 2008, PASP, 120, 170
- Tokovinin, Mason, & Hartkopf (2010a) Tokovinin, A., Mason, B. D., & Hartkopf, W. I. 2010, AJ, 139, 743 (TMH10)
- Tokovinin et al. (2010b) Tokovinin, A., Tighe, R., Schurter, P., Cantarutti, R., van der Bliek, N., Martinez, M., Mondaca, E., Montané, A., Naudy Cortés, W. 2010, Proc. SPIE, 7736, paper 7736-132.
- Véran & Poyneer (2010) Véran, J.-P. & Poyneer, L. 2010, in Adaptative Optics for Extremely Large Telescopes, eds. Clénet, Y., Conan, J.-M. , Fusco, Th., & Rousset, G. EDP Sciences, Paris.
| WDS | Discoverer | Other | Epoch | Filt | N | [OC]θ | [OC]ρ | Reference | |||||
|---|---|---|---|---|---|---|---|---|---|---|---|---|---|
| (2000) | Designation | name | +2000 | (deg) | (mas) | (′′) | (mas) | (mag) | (deg) | (′′) | code∗ | ||
| 001432732 | HDS 33 | HIP 1144 | 9.6709 | I | 2 | 310.8 | 0.3 | 0.1674 | 0.9 | 0.9 | |||
| 002842020 | B 1909 | HIP 2237 | 9.6709 | I | 3 | 307.8 | 0.5 | 0.1888 | 0.5 | 0.2 | 3.8 | 0.003 | Sod1999 |
| 003156257 | I 260 CD | HIP 2487 | 9.6711 | y | 2 | 242.4 | 0.4 | 0.2529 | 0.3 | 1.5 | 5.6 | 0.017 | Msn2001c |
| 003450433 | D 2 AB | HIP 2713 | 9.6708 | I | 2 | A207.9 | 0.4 | 0.0610 | 0.1 | 0.8 | 109.9 | 0.223 | Sey2002 |
| 9.6708 | R | 2 | A207.8 | 1.0 | 0.0604 | 0.9 | 0.1 | 109.8 | 0.223 | Sey2002 | |||
| 9.7556 | I | 6 | A204.7 | 5.3 | 0.0574 | 1.2 | 0.9 | 106.6 | 0.228 | Sey2002 | |||
| 003520336 | HO 212 AB | HIP 2762 | 9.6708 | I | 2 | 229.6 | 0.1 | 0.2345 | 0.4 | 1.2 | 0.7 | 0.000 | Msn2005 |
| 9.6708 | y | 2 | 229.5 | 0.4 | 0.2344 | 1.0 | 1.4 | 0.7 | 0.000 | Msn2005 | |||
| 9.7556 | I | 4 | 231.7 | 0.5 | 0.2387 | 0.2 | 1.1 | 0.4 | 0.000 | Msn2005 | |||
| 003732446 | BU 395 | HIP 2941 | 9.6709 | I | 4 | 95.0 | 0.1 | 0.4627 | 0.1 | 0.4 | 2.8 | 0.017 | Pbx2000b |
| 9.7557 | I | 2 | 95.6 | 0.1 | 0.4727 | 0.3 | 0.2 * | 2.9 | 0.018 | Pbx2000b | |||
| 004276537 | I 440 | HIP 3351 | 9.6711 | I | 2 | 269.4 | 0.2 | 0.4023 | 0.3 | 0.7 | 1.1 | 0.084 | Lin2004a |
| 005222237 | STN 3 AB | HIP 4072 | 9.6709 | I | 3 | 243.1 | 1.4 | 1.9853 | 2.3 | 0.7 * | |||
| 005222237 | STN 3 BD | HIP 4072 | 9.6709 | I | 3 | 336.9 | 5.9 | 0.5743 | 3.3 | 4.0 | |||
| 010614643 | SLR 1 AB | HIP 5165 | 9.6711 | y | 2 | 113.0 | 0.1 | 0.4050 | 0.1 | 0.5 | 29.2 | 0.042 | Ary2001a |
| 010784129 | RST 3352 | HIP 5300 | 9.6711 | I | 2 | 156.1 | 0.2 | 0.1412 | 0.3 | 1.0 | 1.9 | 0.003 | Sod1999 |
| 9.6711 | y | 2 | 156.1 | 0.4 | 0.1408 | 0.3 | 1.3 | 2.0 | 0.004 | Sod1999 | |||
| 010845515 | RST 1205 AB | HIP 5348 | 9.6711 | y | 2 | 110.0 | 1.5 | 0.5486 | 0.4 | 2.7 | 2.3 | 0.033 | Lin2004a |
| 010945636 | HU 1342 | HIP 5428 | 9.6711 | I | 3 | 328.8 | 0.2 | 0.3746 | 0.7 | 0.6 | 1.8 | 0.018 | Hei1984a |
| 011586853 | I 27 CD | HIP 5842 | 9.6711 | I | 2 | 312.5 | 0.3 | 1.0540 | 0.2 | 0.5 * | 2.0 | 0.034 | Sod1999 |
| 011980031 | FIN 337 BC | HIP 6226 | 9.6710 | I | 2 | 32.2 | 1.4 | 0.1337 | 1.7 | 0.8 | 3.8 | 0.003 | Msn2010 |
| 011980031 | STF 113 AB | HIP 6226 | 9.6710 | I | 2 | 19.1 | 3.4 | 1.6783 | 0.3 | 2.4 | |||
| 012206943 | I 263 | HIP 6377 | 9.6711 | I | 2 | 279.1 | 0.2 | 0.4271 | 0.2 | 0.8 | 5.3 | 0.099 | Msn1999a |
| 012430655 | BU 1163 | HIP 6564 | 9.6710 | I | 3 | 218.0 | 0.2 | 0.3227 | 0.1 | 0.4 | 0.4 | 0.002 | Sod1999 |
| 013344354 | HDS 205 | HIP 7254 | 9.6711 | I | 2 | 195.8 | 0.2 | 0.1322 | 0.7 | 0.9 | |||
| 013502955 | BU 1000 AC | HIP 7372 | 9.6709 | I | 2 | 351.1 | 2.1 | 1.8128 | 0.9 | 3.2 | 17.8 | 0.237 | Nwb1969a |
| 013502955 | DAW 31 AB | HIP 7372 | 9.6709 | I | 2 | 40.7 | 2.6 | 0.1366 | 3.3 | 0.5 | 7.0 | 0.005 | Msn1999c |
| 013612954 | HJ 3447 | HIP 7463 | 9.6709 | I | 2 | 182.5 | 0.3 | 0.7729 | 0.1 | 1.4 | 2.9 | 0.038 | Cve2006e |
| 013760924 | KUI 7 | HIP 7580 | 9.6710 | y | 1 | 112.5 | 0.2 | 0.0771 | 0.2 | 1.2 : | 3.7 | 0.002 | Tok1993 |
| 9.6710 | I | 2 | 111.9 | 0.4 | 0.0786 | 0.7 | 1.0 | 3.1 | 0.004 | Tok1993 | |||
| 014171119 | STF 147 | HIP 7916 | 9.6709 | I | 2 | 120.2 | 0.1 | 0.1072 | 0.2 | 1.0 | |||
| 9.6710 | y | 2 | 120.4 | 0.1 | 0.1065 | 0.5 | 1.1 | ||||||
| 020222402 | HDS 272 AB | HIP 9497 | 9.6710 | I | 3 | 340.6 | 0.8 | 0.5861 | 1.6 | 3.4 | |||
| 9.6710 | R | 2 | 340.6 | 0.8 | 0.5801 | 0.3 | 4.4 | ||||||
| 9.7557 | I | 3 | 340.2 | 1.1 | 0.5851 | 2.3 | 3.5 | ||||||
| 020222402 | TOK 41 Ba,Bb | HIP 9497 | 9.6709 | I | 3 | 162.2 | 0.3 | 0.1018 | 1.0 | 0.1 | |||
| 9.6710 | R | 2 | 162.7 | 1.4 | 0.0948 | 2.9 | 0.0 | ||||||
| 9.7557 | I | 3 | 160.1 | 4.0 | 0.1007 | 2.5 | 0.0 | ||||||
| 020572422 | WSI 71 Aa,Ab | HIP 9774 | 9.7557 | I | 2 | 276.1 | 0.8 | 0.0462 | 8.2 | 1.4 : | |||
| 9.7558 | I | 2 | 283.7 | 2.3 | 0.0553 | 0.1 | 1.4 : | ||||||
| 9.7559 | I | 2 | 287.2 | 8.3 | 0.0525 | 1.4 | 1.5 : | ||||||
| 020572423 | I 454 AB | HIP 9774 | 9.7557 | I | 2 | 154.4 | 0.1 | 0.8204 | 1.1 | 1.9 : | |||
| 9.7558 | I | 2 | 154.6 | 0.3 | 0.8173 | 0.1 | 2.2 : | ||||||
| 9.7559 | I | 2 | 154.7 | 0.6 | 0.8185 | 3.1 | 2.0 : | ||||||
| 022252349 | TOK 40 | HIP 11072 | 9.6709 | I | 2 | 125.3 | 1.2 | 0.4969 | 1.2 | 3.8 | |||
| 9.6709 | R | 2 | 124.8 | 4.6 | 0.4997 | 4.6 | 4.5 | ||||||
| 9.7558 | I | 5 | 126.1 | 0.9 | 0.4966 | 1.2 | 3.6 * | ||||||
| 023961152 | FIN 312 | HIP 12390 | 9.6710 | y | 2 | 131.1 | 0.3 | 0.0762 | 0.2 | 0.8 | 7.6 | 0.003 | Sod1999 |
| 024422530 | FIN 379 Aa,Ab | HIP 12780 | 9.6709 | I | 2 | 302.2 | 0.4 | 0.0648 | 0.7 | 0.2 | 41.6 | 0.279 | Hng2005 |
| 9.7557 | I | 3 | 310.1 | 0.9 | 0.0727 | 2.8 | 0.5 | 33.9 | 0.270 | Hng2005 | |||
| 9.7558 | V | 1 | 312.2 | 0.5 | 0.0596 | 0.5 | 0.7 : | 31.8 | 0.283 | Hng2005 | |||
| 024600457 | BU 83 | HIP 12912 | 9.6710 | I | 2 | 14.8 | 0.4 | 0.9560 | 0.4 | 1.6 * | 1.3 | 0.130 | Ole2002d |
| 025722458 | BEU 4 Ca,Cb | HIP 13769 | 9.6709 | I | 2 | A352.4 | 0.3 | 0.0818 | 0.9 | 0.8 | 10.6 | 0.985 | Sca2002c |
| 170315314 | HDS 2412 Aa,Ab | HIP 83431 | 9.7551 | I | 4 | 199.4 | 0.7 | 0.5939 | 0.9 | 2.7 * | |||
| 9.7551 | H | 2 | 199.3 | 0.7 | 0.5925 | 1.3 | 2.8 | ||||||
| 171955004 | FIN 356 | HIP 84759 | 9.7551 | I | 2 | A84.7 | 0.2 | 0.0698 | 0.4 | 0.0 | |||
| 9.7552 | H | 2 | A91.0 | 0.2 | 0.0647 | 0.7 | 0.4 : | ||||||
| 9.7564 | H | 2 | A89.9 | 2.2 | 0.0645 | 0.5 | 0.7 : | ||||||
| 172485913 | I 385 AB | HIP 85216 | 9.7551 | I | 3 | 121.3 | 2.3 | 0.3984 | 4.8 | 0.8 | |||
| 172485913 | WSI 87 AD | HIP 85216 | 9.7551 | I | 3 | 269.4 | 4.3 | 0.2687 | 7.7 | 0.7 | |||
| 180310811 | STF 2262 AB | HIP 88404 | 9.6702 | I | 2 | 285.2 | 0.8 | 1.6053 | 0.5 | 0.7 * | 0.5 | 0.020 | Sod1999 |
| 9.6702 | R | 6 | 285.2 | 1.2 | 1.6024 | 1.3 | 0.7 * | 0.5 | 0.023 | Sod1999 | |||
| 181121951 | BU 132 | HIP 89114 | 9.6702 | I | 1 | 8.4 | 1.3 | 1.4047 | 1.3 | 1.3 : | |||
| 185941250 | KUI 89 | HIP 93225 | 9.6703 | I | 2 | 142.4 | 0.4 | 0.2159 | 0.3 | 0.9 | 12.4 | 0.019 | Msn1999c |
| 9.6703 | R | 2 | 142.3 | 0.4 | 0.2173 | 0.4 | 1.0 | 12.3 | 0.020 | Msn1999c | |||
| 9.6703 | I | 8 | 142.4 | 0.8 | 0.2163 | 0.8 | 0.9 | 12.4 | 0.019 | Msn1999c | |||
| 203111503 | FIN 336 | HIP 101221 | 9.6705 | I | 4 | 304.7 | 0.4 | 0.1528 | 0.6 | 1.5 | 1.9 | 0.000 | Msn2010 |
| 9.6705 | R | 2 | 304.8 | 0.8 | 0.1538 | 0.6 | 1.3 | 1.8 | 0.001 | Msn2010 | |||
| 203931457 | HU 200 AB | HIP 101923 | 9.6706 | R | 2 | 118.1 | 0.3 | 0.3313 | 0.3 | 0.6 | 2.1 | 0.006 | Hei1998 |
| 9.6706 | I | 2 | 118.1 | 0.2 | 0.3318 | 0.2 | 0.5 | 2.1 | 0.006 | Hei1998 | |||
| 205140538 | STF 2729 AB | HIP 102945 | 9.6706 | I | 2 | 25.1 | 0.4 | 0.8567 | 0.7 | 1.5 | 1.3 | 0.080 | Hei1998 |
| 205270859 | MCA 64 | HIP 103045 | 9.6706 | y | 2 | A137.3 | 0.3 | 0.0509 | 0.8 | 0.7 : | |||
| 9.6706 | I | 2 | A137.2 | 0.1 | 0.0525 | 0.4 | 0.4 | ||||||
| 9.6706 | R | 2 | A137.8 | 0.4 | 0.0498 | 0.6 | 0.1 | ||||||
| 210410549 | MCA 66 Aa,Ab | HIP 103981 | 9.6706 | I | 2 | 62.1 | 0.8 | 0.2705 | 0.7 | 3.4 | |||
| 210410549 | STF 2745 AB | HIP 103981 | 9.6706 | I | 2 | 196.5 | 3.4 | 2.4603 | 10.1 | 5.3 | |||
| 210441951 | FIN 328 | HIP 104019 | 9.6707 | I | 2 | 338.6 | 0.1 | 0.3098 | 0.1 | 1.9 | 176.5 | 0.009 | Msn1999a |
| 9.6707 | y | 2 | 338.6 | 0.3 | 0.3095 | 0.5 | 2.3 | 176.5 | 0.009 | Msn1999a | |||
| 210740814 | BU 368 AB | HIP 104272 | 9.6706 | I | 2 | 284.8 | 0.5 | 0.1136 | 0.9 | 0.9 | 0.4 | 0.049 | Pal2005b |
| 9.6707 | R | 2 | 286.5 | 0.8 | 0.1149 | 2.0 | 0.9 | 2.1 | 0.050 | Pal2005b | |||
| 211145220 | HU 1626 | HIP 104604 | 9.6678 | y | 2 | 117.1 | 1.1 | 1.1015 | 1.0 | 1.5 * | 0.1 | 0.005 | Sey2002 |
| 9.6679 | R | 3 | 117.1 | 1.0 | 1.1027 | 1.2 | 1.3 * | 0.0 | 0.006 | Sey2002 | |||
| 211585316 | FIN 329 | HIP 104978 | 9.7552 | I | 2 | 236.7 | 0.9 | 0.1233 | 0.5 | 0.1 | 118.2 | 0.064 | Hei1973b |
| 9.7552 | H | 4 | 236.7 | 0.9 | 0.1242 | 0.5 | 0.4 : | 118.2 | 0.064 | Hei1973b | |||
| 212740701 | HDS 3053 | HIP 105947 | 9.6706 | I | 2 | A159.0 | 0.9 | 0.1951 | 2.4 | 1.5 : | 0.6 | 0.0000 | Msn2010 |
| 215526153 | HDO 296 | HIP 108195 | 9.7552 | I | 4 | 105.9 | 0.3 | 0.3322 | 0.2 | 0.2 | 8.1 | 0.042 | Fin1969c |
| 9.7552 | H | 1 | 105.8 | 0.4 | 0.3337 | 0.4 | 0.6 : | 8.2 | 0.044 | Fin1969c | |||
| 215795500 | FIN 307 | HIP 108431 | 9.6678 | y | 10 | 75.2 | 0.5 | 0.1189 | 1.0 | 0.6 | 0.5 | 0.018 | Chu1965 |
| 221163428 | BU 769 AB | HIP 109561 | 9.6679 | I | 7 | 355.1 | 0.2 | 0.8399 | 0.6 | 1.8 * | |||
| 9.6679 | R | 1 | 355.0 | 0.4 | 0.8427 | 0.4 | 1.4 * | ||||||
| 9.6679 | y | 2 | 355.2 | 0.5 | 0.8427 | 2.2 | 1.4 : | ||||||
| 221163428 | CHR 230 Aa,Ab | HIP 109561 | 9.6679 | y | 2 | 128.8 | 2.4 | 0.0284 | 0.9 | 2.3 : | |||
| 221520535 | A 2599 AB | HIP 109874 | 9.7553 | I | 2 | 279.6 | 2.4 | 0.6999 | 0.8 | 3.2 | |||
| 9.7553 | H | 2 | 279.9 | 3.1 | 0.6997 | 4.1 | 3.1 : | ||||||
| 221610705 | HDS 3158 | HIP 109951 | 9.7553 | I | 2 | 108.6 | 1.4 | 0.3985 | 0.6 | 1.3 : | |||
| 222410450 | BU 172 AB | HIP 110578 | 9.6707 | I | 3 | 39.5 | 0.3 | 0.4067 | 0.3 | 0.5 | 2.1 | 0.005 | Doc2007d |
| 9.7552 | I | 5 | 39.4 | 0.1 | 0.4076 | 0.1 | 0.3 | 2.1 | 0.005 | Doc2007d | |||
| 9.7552 | H | 2 | 39.6 | 2.9 | 0.4081 | 1.1 | 0.8 : | 1.9 | 0.005 | Doc2007d | |||
| 222661645 | SHJ 345 AB | HIP 110778 | 9.7556 | I | 4 | 38.8 | 0.7 | 1.3102 | 0.6 | 0.1 * | 0.9 | 0.010 | Hle1994 |
| 222880001 | Aqr Ba,Bb | HIP 110960 | 9.7552 | I | 2 | 191.8 | 11.3 | 0.4058 | 2.5 | 4.7 | |||
| 9.7552 | H | 2 | 187.8 | 5.9 | 0.4116 | 2.4 | 5.2 | ||||||
| 223840754 | A 2695 | HIP 111761 | 9.6707 | I | 2 | 254.7 | 2.4 | 0.1024 | 0.7 | 2.0 | 29.8 | 0.011 | Ole2004a |
| 9.6707 | y | 1 | 255.3 | 0.7 | 0.0972 | 0.7 | 1.8 : | 29.2 | 0.017 | Ole2004a | |||
| 224080333 | KUI 114 | HIP 111965 | 9.6707 | I | 4 | A291.7 | 0.3 | 0.0508 | 0.5 | 0.8 | 6.8 | 0.003 | Sod1999 |
| 225520459 | BU 178 | HIP 113184 | 9.6707 | I | 3 | 322.2 | 0.7 | 0.6466 | 0.7 | 2.5 | 1.1 | 0.129 | Baz1981b |
| 225534828 | I 22AB | HIP 113191 | 9.6679 | y | 2 | 174.4 | 2.8 | 0.4450 | 0.7 | 0.9 : | |||
| 9.6679 | I | 2 | 174.8 | 0.2 | 0.4443 | 0.3 | 0.2 | ||||||
| 225864531 | HU 1335 | HIP 113454 | 9.6679 | I | 6 | 174.6 | 1.2 | 0.1605 | 2.3 | 0.6 | 8.5 | 0.003 | Hei1984a |
| 230520742 | A 417 AB | HIP 113996 | 9.6708 | I | 2 | A41.0 | 0.1 | 0.2026 | 0.1 | 0.2 | 0.7 | 0.003 | Hrt1996a |
| 9.6708 | y | 2 | A40.9 | 0.2 | 0.2031 | 0.1 | 0.5 | 0.8 | 0.002 | Hrt1996a | |||
| 230992227 | RST 3320 | HIP 114375 | 9.6707 | y | 2 | 135.1 | 0.2 | 0.1843 | 0.1 | 1.1 | 43.2 | 0.079 | Sey2002 |
| 9.6708 | I | 3 | 135.1 | 0.8 | 0.1851 | 0.9 | 2.0 | 43.2 | 0.078 | Sey2002 | |||
| 231911328 | MCA 74 Aa,Ab | HIP 115126 | 9.6708 | I | 2 | A201.5 | 1.4 | 0.1834 | 0.6 | 2.9 | 9.7 | 0.016 | Msn1999c |
| 9.6708 | y | 1 | A201.9 | 1.3 | 0.1822 | 1.3 | 3.2 : | 9.4 | 0.014 | Msn1999c | |||
| 232271502 | HU 295 | HIP 115404 | 9.6707 | I | 2 | 281.0 | 0.3 | 0.3206 | 0.2 | 1.1 | 0.3 | 0.010 | Sey1999b |
| 9.6707 | y | 2 | 281.0 | 0.3 | 0.3203 | 0.3 | 1.4 : | 0.3 | 0.010 | Sey1999b | |||
| 9.6763 | I | 13 | 281.1 | 0.8 | 0.3215 | 1.5 | 1.1 | 0.3 | 0.009 | Sey1999b | |||
| 9.6763 | V | 2 | 281.0 | 0.7 | 0.3200 | 1.5 | 1.2 : | 0.4 | 0.010 | Sey1999b | |||
| 233572729 | SEE 492 | HIP 116436 | 9.6708 | I | 2 | 16.2 | 0.5 | 0.6355 | 0.2 | 1.6 | 2.9 | 0.053 | Hei1984a |
| 235290309 | FIN 359 | HIP 117761 | 9.6708 | I | 2 | A355.7 | 0.2 | 0.0551 | 0.1 | 0.3 | 5.3 | 0.006 | Msn2010 |
| 235861408 | RST 4136 AB | HIP 118205 | 9.6708 | I | 2 | A208.2 | 0.4 | 0.1511 | 0.4 | 0.9 : | 7.3 | 0.035 | Msn1999c |
| 235870333 | BU 730 | HIP 118209 | 9.7553 | I | 2 | 322.1 | 19.1 | 0.7571 | 8.4 | 4.7 | 1.0 | 0.129 | Sey2002 |
* The complete list of references may be found at http://ad.usno.navy.mil/Webtextfiles/wdsnewref.txt .