On the connection between shape and stellar population in early-type galaxies
Abstract
We report on the discovery of a relation between the stellar mass of early-type galaxies (hereafter ETGs), their shape, as parametrized by the Sersic index , and their stellar mass-to-light ratio . In a 3D log space defined by these variables the ETGs populate a plane surface with small scatter. This relation tells us that galaxy shape and stellar population are not independent physical variables, a result that must be accounted for by theories of galaxy formation and evolution.
1 Introduction
It has long been known that the shape of galaxies is connected with their stellar population properties. Morgan (1958) based his galaxy classification scheme of spiral galaxies on the relation between the central light concentration and spectral characteristics (see also Morgan & Mayall, 1957).
ETGs have been considered a homogeneous class within the Hubble sequence, manifesting a restricted range of shapes and a generic old stellar population. Their internal structure is usually described as differing by only a simple scale factor from galaxy to galaxy (structural homology). Observational support for this interpretation was based on the fact that all luminosity profiles appeared to follow the de Vaucouleurs’ law (de Vaucouleurs, 1948) . First, Michard (1985) and Schombert (1986) noted that residuals of the individual fits correlated with galaxy luminosity. Then, the first breakthrough in the previously outlined scenario came more than 20 years ago through the papers by Capaccioli (1987); de Carvalho & da Costa (1988); Capaccioli (1989); Burkert (1993). The final proof of structural non-homology came when better fits of the luminosity profiles were obtained using a Sersic’ law (Sersic, 1968), where is a free index that defines the shape of the light profile and correlates with the total luminosity of the galaxy: the relation (Caon et al., 1993; Young & Currie, 1994; Prugniel & Simien, 1997).
It is also well known that ETGs share a 3D planar distribution with a small scatter, the so-called Fundamental Plane (hereafter FP, Djorgovski & Davis, 1987; Dressler et al., 1987), defined by the effective radius , the effective surface brightness , and the central velocity dispersion . The observed tilt of the FP relative to the virial theorem expectation, and the small scatter around the plane, are still matters of debate. Many researchers believe that the tilt is likely a consequence of stellar population effects which manifest themselves through the observational evidence that low-mass ETGs tend to be younger and to show lower stellar mass-to-light ratios with respect to the massive ones (the relation; see e.g. Faber et al., 1987; Gerhard et al., 2001; Treu et al., 2005). Actually, the observations reveal that the tilt is still substantial in the band (, see e.g. Pahre et al., 1998), where the effect of the stellar mass-to-light ratio variation should be mild. Another possible explanation of the tilt is linked to the amount and distribution of dark matter (DM). According to Ciotti, Lanzoni & Renzini (1996) the DM explanation requires a peculiar fine-tuning to reproduce the observed properties of the FP. More recently Tortora et al. (2009), estimating the total from simple Jeans dynamical models, found that an important role should be played by DM, since its fraction within seems to be roughly constant for galaxies fainter than , while it increases for brighter galaxies. Padmanabhan et al. (2004) and Hyde & Bernardi (2009) also found evidence that the ratio increases with mass, a fact that may imply a dark-to-bright matter ratio increasing along the FP.
Another popular explanation of the FP tilt, alternative (or complementary) to the previous ones, rests upon the already mentioned evidence of structural non-homology of ETGs, parametrized by the Sersic index (Bertin, Ciotti & Del Principe, 2002; Trujillo, Burkert, & Bell, 2004).
Here we report one of the results of a work in progress (D’Onofrio et al., 2010), indicating that a connection between galaxy shape and stellar population that was found by Morgan (1958) for spiral galaxies, is also present in ETGs. We suggest that such a relationship is likely connected to the properties of the FP, in particular with its scatter, and is therefore one of the fundamental physical relations that underpins its origin.
2 Our galaxy sample selection
The present work is based on the data of the Wide-field Nearby Galaxy-clusters Survey (WINGS, see e.g. Fasano et al., 2006; Varela et al., 2009; Cava et al., 2009; Valentinuzzi et al., 2009; D’Onofrio et al., 2008). Our sample comes from the cross-match of the and band surface photometry. Total luminosities, effective radii and Sersic indices were measured with the automatic software GASPHOT (Pignatelli, Fasano & Cassata, 2006). The quality of the GASPHOT photometry (magnitudes, radii, surface brightness and flattening) is discussed in detail in several WINGS papers (Fasano et al., 2006; Varela et al., 2009; Cava et al., 2009; Valentinuzzi et al., 2009; D’Onofrio et al., 2008; Fritz et al., 2007, 2010).
Galaxy masses have been derived by Fritz et al. (2010) fitting the observed (optical) spectra of the WINGS survey (Cava et al., 2009) with theoretical spectra, obtained summing up Simple Stellar Populations (SSP) spectra of different ages, each one properly extinguished according to the SSP’s age itself (Fritz et al., 2007). Details about the models and the fitting procedure (evolutionary tracks, mass range and evolutionary stages of stars, IMF, SFH, etc.) can be found in Fritz et al. (2007, 2010). Here we just mention that the equivalent widths of the main lines and the flux emitted in significant ranges of the spectral continuum have been used to find the best fit of the observed spectra, at varying the mass fractions of the SSPs, as well as the ”selective extinction” and the metallicity. The masses obtained in this way have been found in fair agreement with those obtained from our GASPHOT photometry, following the prescriptions of Bell & de Jong (2002).
All galaxies were classified as early-types (pure ellipticals or S0s) using MORPHOT, an automatic morphological classification package purposely devised for the WINGS project (Fasano & Vanzella, 2007; Fasano et al., 2010).
Galaxy magnitudes, effective radii and Sersic indices have been found in good agreement both with the SDSS data (Valentinuzzi et al., 2010) and with the values we obtained (for comparison) using the GALFIT (Peng et al., 2002) and GIM2D (Simard et al., 2002) packages.
From an initial sample of 2613 (848) galaxies with () band data, we extracted a second ”high quality sample” consisting of 240 ETGs with good photometry in both bands, well defined morphological types, optimum Sersic light profile fits and robust stellar mass measurements. The selected galaxies are all spectroscopically confirmed cluster members.
3 The relation
The and scaling relations mentioned in the introduction have been extensively discussed in the literature (Caon et al., 1993; Prugniel & Simien, 1997; Ciotti, 1991; Busarello et al., 1997; Trujillo, Burkert, & Bell, 2004; Graham & Colless, 1997; Bertin, Ciotti & Del Principe, 2002; Faber et al., 1987; Gerhard et al., 2001; Treu et al., 2005). They provide evidences that faint ETGs are characterized by small values of and with respect to bright objects. The origin of such behaviour is still a matter of debate.
In this letter we highlight the connection between (i.e. the shape of the light profiles) and (i.e. the stellar populations) which is hidden in the relation. The link between these two fundamental variables that characterize ETGs was indeed poorly analyzed in the literature, since the two variables do not correlate directly.
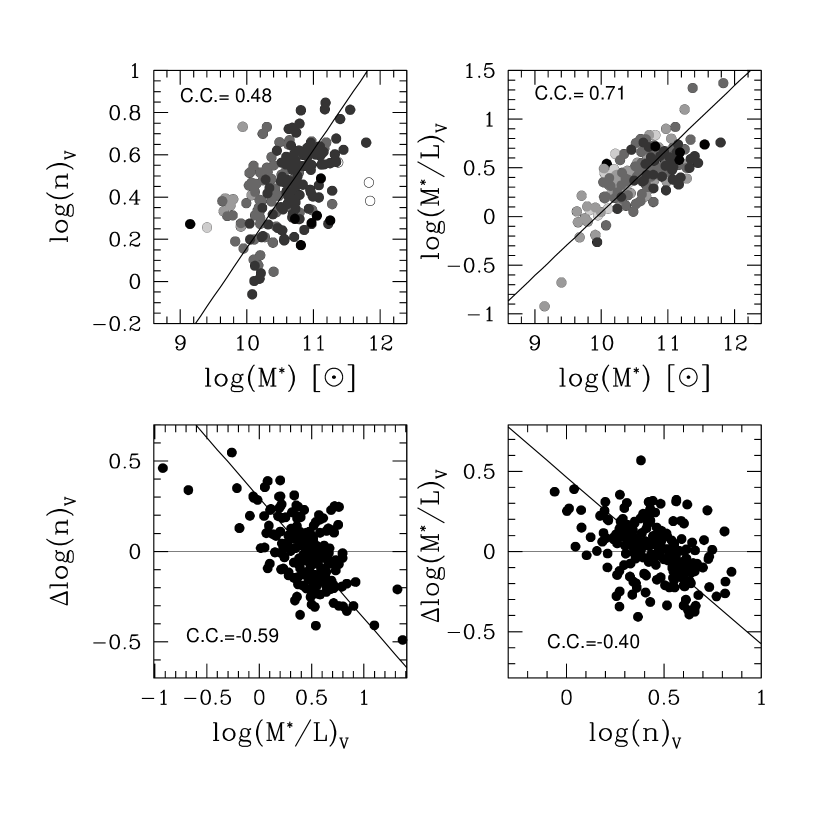
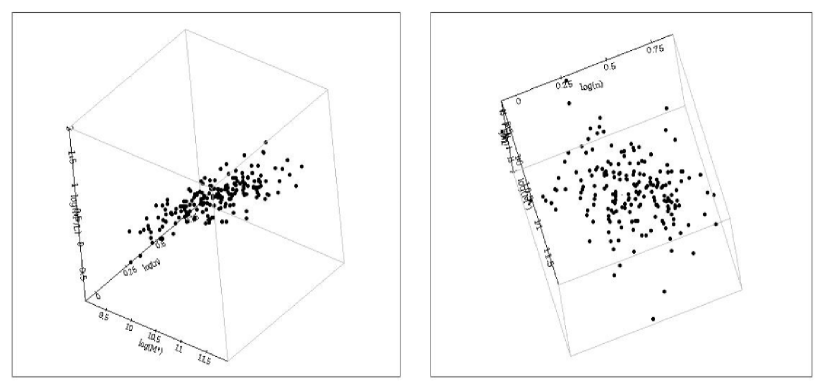
The upper panels of Fig. 1 show the and relations for the ”high quality sample”. The lines mark the bilinear least-square fits to the data obtained using the SLOPE program (Feigelson & Babu, 1992). The lower panels of the same figure show the orthogonal residuals of the two relations versus and , respectively. Note that the same trend of the residuals is observed when the classical least-square fit is adopted and the residuals are evaluated along the Y axis. It is clear from the plots that the residuals of the and relations depend, respectively, upon and . These two variables are independent of each other, but are connected through their residuals. The same mass-to-light ratio is achieved by galaxies with a low/high mass when their Sersic index () is high/low, while the same value of is achieved by galaxies of low/high masses when is high/low. Despite the well known difficulties in measuring the Sersic index (variance ), the observed trends reveal a clear interplay between galaxy shape, mass and mass-to-light ratio. This behavior of the residuals implies that ETGs are distributed on a plane in a 3D space whose axes are , and (see Fig. 2). This relationship is observed in both and bands and for both the ”high quality” and the total samples. In particular, for the ”high quality” sample the equations of the planes which minimize the sum of the distance from the fit are:
| (1) | |||||
| (2) | |||||
for the () and () bands, respectively. The Principal Component Analysis (PCA) confirms that we have a planar distribution. The first two eigenvectors for the band are:
| (3) | |||||
| (4) | |||||
They are built with the three variables, and together support up to of the total variance (respectively and ). The same is true for the band with small differences in the PCA coefficients.
As far as we know, the relation for ETGs is explicitly presented here for the first time, at least for ETGs. Actually, Dutton (2009) published the relation for disk galaxies in the redshift range using the data of the New York University Value Added Catalog (NYU-VAGC, Blanton et al., 2005). Their slope is a bit lower than our, likely because of the limited range of values of for disk objects (from 0.2 to 0.6 in log scale). However, remarkably enough, their Fig. 5 clearly shows that the residuals with respect to a straight line fit depend on colors, i.e. on the ratio. This suggest that the relation might be valid over the whole Hubble sequence.
We can compare our and relations with that of Caon et al. (1993), based on the Virgo and Fornax ETGs. For the band we have: with a correlation coefficient and with a . Both relations are in agreement (within ) with the previous determinations by Caon et al. (1993). Actually, in the case of the relation our slope is larger than in Caon et al. (1993, 0.6 vs. 0.45). However, we must consider that the slope value depends on the adopted fitting strategy. In fact, using a simple least-square fit, we get the relation , quite different from that obtained when a bilinear LSQ is used. The data of Caon et al. (1993) are based on 40 ETGs against the 240 of the WINGS database. Since the errors are approximately of the same order for both variables, we believe that the bilinear LSQ fit is more appropriate for determining the correct slope of the relation. Therefore we estimate that the true slope of the relation is in the interval .
In the band our relation has a slope of (again the slope depends on the fitting strategy adopted, varying from (for the classic LSQ fit) to (for the bilinear fit)), while the relation has a slope of (with a C.C.), in agreement with the recent determination by Tortora et al. (2009). Note that, given the slope of our relation (0.6), some trivial algebra would imply that , largely at variance with the formal value we found (2.0 vs. 0.03). However, it is easy to recognize the origin of this apparent discrepancy in the lack of correlation between and (C.C.), which makes practically undefined the slope of the best fitting straight line. Such lack of correlation is also the reason why there is a 3D planar distribution of ETGs in the log space, while it is not present in the corresponding space.
Since we were not able to find in the literature any estimate of the slope of the relation, we tried to get an ’indirect’ check of our value combining the slopes of the and relations. Our data give , depending on the adopted fitting tool (these values are within the range of slopes given by Graves & Faber 2010), and . The combination of these equations provides , in agreement with our ’direct’ finding. In any case, it is worth stressing again that the existence of the 3D relation does not depend on the final slopes adopted for the and relations.
4 Consequences for theories of galaxy formation and evolution
Before the discovery of the FP (Djorgovski & Davis, 1987; Dressler et al., 1987), the , and relations (Faber & Jackson, 1976; Kormendy, 1977) were well known scaling relations of ETGs. When Terlevich et al. (1981) found that the residuals of the Faber-Jackson relation were connected with the effective surface brightness , the existence of a 3D relationship between (i.e. the FP) was soon revealed. Similarly, we report here on the existence of a plane preferentially shared by ETGs in the 3D space defined by the quantities , and , which are already known to be linked by mutual independent correlations. We define this plane and claim that its very existence implies that stellar populations and shapes of ETGs are not independent quantities. Why this occurs is presently unknown, but this mutual dependence recalls the correlation found by Morgan (1958) for spiral galaxies and could be an important ingredient for theories of galaxy formation and evolution. A ’natural’ guess one can make is that such a relation is connected to the FP of ETGs, i.e. with the process of virialization that produced, after the gas collapse phase, the final stellar structure in dynamical equilibrium. How can this finding be reconciled with the hierarchical merging scenario of galaxy formation where ETGs are the final output of a series of merging events? How is this relationship connected with the well known correlations of galaxy mass and mass-to-light ratio with age and metallicity? How it is connected with the FP? We are presently investigating the implications of our finding. Preliminary analyses based on FP simulations in which the Sersic indices of the mock galaxies randomly share the observed distribution, or (alternatively) are forced to obey (with the proper scatter) the relation (1), suggest that it might act as a sort of ’fine-tuning’ effect that keeps small the scatter around the FP (D’Onofrio et al., 2010).
References
- Bell & de Jong (2002) Bell, E.F., & de Jong, R.S. 2001, ApJ 550, 212
- Bertelli et al. (1994) Bertelli, G., Bressan, A., Chiosi, C., Fagotto, F., & Nasi, E. 1994, A&AS, 106, 275
- Bertin, Ciotti & Del Principe (2002) Bertin G., Ciotti L., & Del Principe M. 2002, A&A 386, 149
- Blanton et al. (2005) Blanton M.R. et al. 2005, AJ 129, 2562
- Burkert (1993) Burkert A. 1993, A&A 278, 23
- Busarello et al. (1997) Busarello G., Capaccioli M., Longo G., & Puddu E. 1997, in: The Second Stromlo Symposium “The nature of Elliptical Galaxies”, ASP Conference Series, 166, 184
- Caon et al. (1993) Caon N., Capaccioli M., & D’Onofrio M. 1993, MNRAS 265, 1013
- Capaccioli (1987) Capaccioli M. 1987, The Structure and Dynamics of Elliptical Galaxies, P.T. De Zeew ed. (Reidel, Dordrecht), 127, 47
- Capaccioli (1989) Capaccioli M. 1989, The World of Galaxies, H.G. Corwin, L. Bottinelli eds. (Springer-Verlag, Berlin), 208
- Cava et al. (2009) Cava A. et al. 2009, A&A 495, 707
- Ciotti (1991) Ciotti L. 1991, A&A 249, 99
- Ciotti, Lanzoni & Renzini (1996) Ciotti L., Lanzoni B., & Renzini A. 1996, MNRAS 282, 1
- de Carvalho & da Costa (1988) de Carvalho R.R., & da Costa L.N. 1988, ApJS 68, 173
- de Vaucouleurs (1948) de Vaucouleurs G. 1948, Ann. d’Astrophys. 11, 247
- Djorgovski & Davis (1987) Djorgovski S., & Davis M. 1987, ApJ 313, 59
- D’Onofrio et al. (2008) D’Onofrio M. et al. 2008, ApJ 685, 875
- D’Onofrio et al. (2010) D’Onofrio M. et al. 2010, MNRAS in preparation
- Dressler et al. (1987) Dressler A. et al. 1987, ApJ 313, 42
- Dutton (2009) Dutton A.A. 2009, MNRAS 396, 121
- Faber et al. (1987) Faber S.M., Dressler A., Davies R., Burstein D., & Lynden-Bell D. 1987, in: Nearly normal galaxies: From the Planck time to the present; Proceedings of the Eighth Santa Cruz Summer Workshop in Astronomy and Astrophysics, Santa Cruz, CA, July 21-Aug. 1, 1986 (A88-18401 05-90). New York, Springer-Verlag, 1987, p. 175-183
- Faber & Jackson (1976) Faber S.M., Jackson R.E. 1976, ApJ 204, 668
- Fasano & Vanzella (2007) Fasano G., & Vanzella E. 2007, From Stars to Galaxies: Building the Pieces to Build Up the Universe”. ASP Conference Series, 374, 495
- Fasano et al. (2006) Fasano G. et al. 2006, A&A 445, 805
- Fasano et al. (2010) Fasano G. et al. 2010, A&A in preparation
- Feigelson & Babu (1992) Feigelson E.D., & Babu G.J. 1992, ApJ 397, 55
- Fritz et al. (2007) Fritz J. et al. 2007, A&A 470, 137
- Fritz et al. (2010) Fritz J. et al. 2010, A&A accepted [arXiv:1010.2214]
- Gerhard et al. (2001) Gerhard O., Kronawitter A., Saglia R.P., & Bender R. 2001, AJ 121, 1936
- Graham & Colless (1997) Graham A., & Colless M. 1997, MNRAS 287, 221
- Graves & Faber (2010) Graves G.J., & Faber S.M. 2010, arXiv:1005.0014v1
- Hyde & Bernardi (2009) Hyde J.B., & Bernardi M. 2009, MNRAS 396, 1171
- Kormendy (1977) Kormendy J. 1977, ApJ218, 333
- Michard (1985) Michard R. 1985, A&AS 59, 205
- Morgan (1958) Morgan W.W. 1958 PASP 70, 364
- Morgan & Mayall (1957) Morgan W.W., & Mayall N.U. 1957, PASP 69, 291
- Padmanabhan et al. (2004) Padmanabhan N., et al. 2004, New Astronomy, 9, 329
- Pahre et al. (1998) Pahre M.A., De Carvalho R.R., & Djorgovski S.G. 1998, AJ 116, 1606
- Peng et al. (2002) Peng C.Y. et al. 2002, AJ 124, 266
- Pignatelli, Fasano & Cassata (2006) Pignatelli E., Fasano G., & Cassata P. 2006, A&A 446, 373
- Prugniel & Simien (1997) Prugniel Ph., & Simien F. 1997, A&A 321, 111
- Salpeter (1955) Salpeter, E.E. 1955, ApJ 121, 161
- Schombert (1986) Schombert J.M. 1986, ApJS 60, 603
- Sersic (1968) Sersic J.L. 1968, Atlas de Galaxias Australes, Observatorio Astronomico de Cordoba
- Simard et al. (2002) Simard L., et al. 2002, ApJS 142, 1
- Terlevich et al. (1981) Terlevich R., et al. 1981, MNRAS 196, 381
- Tortora et al. (2009) Tortora C., et al. 2009, MNRAS 396, 1132
- Treu et al. (2005) Treu T., Ellis R.K., Liao T.X., & van Dokkum P.G. 2005, ApJ 622, L5
- Trujillo, Burkert, & Bell (2004) Trujillo I., Burkert A., & Bell E.F. 2004, ApJ 600, 39
- Valentinuzzi et al. (2009) Valentinuzzi T. et al. 2009, A&A 501, 851
- Valentinuzzi et al. (2010) Valentinuzzi T. et al. 2010, ApJ 721, L19
- Varela et al. (2009) Varela J. et al. 2009, A&A 497, 667
- Young & Currie (1994) Young C.K., & Currie M.J. 1994, MNRAS 268, 11