CESEM - UMR8194 - CNRS - Université Paris Descartes
Voltage clamp analysis of nonlinear dendritic properties in prepositus hypoglossi neurons
Abstract
The nonlinear properties of the dendrites in prepositus hypoglossi neurons are involved in maintenance of eye position. The biophysical properties of these neurons are essential for the operation of the vestibular neural integrator that converts a head velocity signal to one that controls eye position. A novel method named QSA (quadratic sinusoidal analysis) for voltage clamped neurons was used to quantify nonlinear responses that are dominated by dendrites. The voltage clamp currents were measured at harmonic and interactive frequencies using specific stimulation frequencies, which act as frequency probes of the intrinsic nonlinear neuronal behavior. These responses to paired frequencies form a matrix that can be reduced by eigendecomposition to provide a very compact piecewise quadratic analysis at different membrane potentials that otherwise is usually described by complex differential equations involving a large numbers of parameters and dendritic compartments. Moreover, the QSA matrix can be interpolated to capture most of the nonlinear neuronal behavior like a Volterra kernel. The interpolated quadratic functions of the two major prepositus hypoglossi neurons, namely type B and D, are strikingly different. A major part of the nonlinear responses is due to the persistent sodium conductance, which appears to be essential for sustained nonlinear effects induced by NMDA activation and thus would be critical for the operation of the neural integrator. Finally, the dominance of the nonlinear responses by the dendrites supports the hypothesis that persistent sodium conductance channels and NMDA receptors act synergistically to dynamically control the influence of individual synaptic inputs on network behavior.
keywords:
Electrophysiology; Vestibular neural integrator; Membrane potential; Impedance; Quadratic analysis; Persistent sodium conductance; NMDA receptorsAddress : 45 rue des Saints-Pères, 75270 PARIS, FRANCE - Tel.:33-(0)142863398, Fax:33-(0)142863399
*Corresponding author
Introduction
Mathematical models based on the experimentally measured biophysical properties of neurons generally consist of complicated sets of differential equations derived from the historical Hodgkin and Huxley (1952) model. Extending the HH formalism to branching neurons requires a large number of parameters that must be determined to obtain a realistic neuronal model. The techniques previously employed to measure these parameters involve either linear admittance (or impedance) measurements or ad hoc extrapolations from voltage clamp experiments with poor space clamp control. Thus, it is important to consider more refined theories from nonlinear analysis, such as nonlinear dynamics of neurons (Gutkin and Ermentrout, 1998; Izhikevich, 2002) or nonlinear system identification (Marmarelis and Naka, 1973; French, 1976; Victor and Shapley, 1980; Boyd et al., 1983; Schetzen, 2006). A goal of nonlinear analysis is not just a refinement of the linear systems approach, but the development of a fundamental insight into how neurons process information.
In a seminal paper, Fitzhugh derived the equations of the nonlinear response for a single sinusoidal voltage clamp (FitzHugh, 1983). This approach has been extended to the quadratic response for a multi-sinusoidal voltage clamp and been developed as a matrix theory termed quadratic sinusoidal analysis (QSA) (Magnani and Moore, 2010). The proposed experimental approach is essentially based on QSA, requiring that the stimulus amplitudes evoke mainly linear and quadratic responses. In addition, QSA provides the mathematical tools for a model independent analysis of quadratic nonlinearities and provides an innovative way to quantitatively describe real neurons and their models. The measurement of nonlinearities in neurons under normal physiological conditions is clearly important in order to understand how they process synaptic inputs, which typically evoke 5-10 mV post-synaptic nonlinear responses.
Two types of neurons of the rat prepositus hypoglossi nucleus (PHN) were investigated. Both types clearly manifest nonlinearities at multiple subthreshold step levels. The type D neurons are known to show marked spontaneous, voltage dependent and irregular oscillatory properties. By contrast, type B neurons, the majority in this nucleus, are non-oscillatory and have regular spontaneous activity that is highly dependent on a significant persistent sodium (gNaP) conductance (Vervaeke et al., 2006). In this paper, the novel QSA method has been used to investigate the quadratic response to time varying voltage clamped stimuli and establish a quantitative characterization of the nonlinear behavior in order to understand neuronal responses elicited by normal physiological synaptic inputs.
It will be shown that at physiological levels of stimulation, neurons and their models can generate significant responses at harmonic and interactive frequencies that are not present in the input signal. Thus, the nonlinear frequency responses contain more frequencies over a wider frequency band than the input signal. As a consequence they provide significant amplification at dynamically changing membrane potentials. The use of stimuli with multiple input frequencies allows one to probe neuronal function and characterize it by a matrix of quadratic interactions, namely the QSA matrix. It is then possible to extract information about active membrane properties from this matrix by eigendecomposition. Finally, biologically realistic simulations have been implemented using neuronal models based on vestibular neuronal experimental data. These simulations suggest that the nonlinear responses in voltage clamp are dominated by active dendritic structures.
Materials and Methods
Whole-cell patch-clamp recordings and statistical analysis
This paper is both a theoretical and experimental nonlinear approach to neuronal function that adds to previous steady state linear analyses (Fishman et al., 1977; Murphey et al., 1995). It provides a quantitative assessment of quadratic responses of both data recorded from individual neurons and their corresponding biophysical models. Experiments were carried out on male Wistar rats (25- to 52-days-old) supplied by Centre d’Elevage Roger Janvier (Le Genest Saint Isle, France). All efforts were made to minimize animal suffering as well as the number of animals used. All experiments followed the guidelines on the ethical use of animals from the European Communities Council Directive of 24 November 1986 (86/609/EEC). Brain dissections were performed as described elsewhere (Idoux et al., 2008). Briefly, after decapitation under deep anesthesia, the brain was quickly removed and placed in ice-cold, phosphate/bicarbonate-buffered artificial cerebro-spinal fluid (ACSF), which included (in mM) 225 sucrose, 5 KCl, 1 NaHPO, 26 NaHCO, 0.25 CaCl, 1.3 MgCl, 11 glucose and was bubbled with 95% O2-5% CO (pH 7.4). Four or five 250 µm thick, coronal slices containing the PHN were cut from the brainstem with a microslicer (Leica, Rueil-Malmaison, France) and transferred into an incubating vial filled with a regular ACSF containing (in mM) 124 NaCl, 5 KCl, 1 NaHPO4, 26 NaHCO, 2.5 CaCl2, 1.3 MgCl, 11 glucose and bubbled with 95% O and 5% CO (pH 7.4). Slices were then placed one at a time in the recording chamber maintained at 32-34°C, where the slice was superfused with regular ACSF at a constant flow rate of 3 mL min-1.
Patch-clamp pipettes were pulled from borosilicate glass tubing to a resistance of 5-8 M. The control internal solution contained (in mM) 140 K-gluconate, 2 MgCl, 10 HEPES, 0.1 EGTA, 4 NaATP, and 0.4 NaGTP (adjusted to pH 7.3 with KOH). The junction potential for this internal solution was not subtracted for the potential measurements or the model simulations. PHN neurons were visualized with a Nomarski optic microscope under infrared illumination. Recordings were made with an Axoclamp 2B amplifier (Axon Instruments, Union City, CA, USA) or a Multiclamp 700B (Molecular Devices, Sunnyvale, CA, USA). The spontaneous discharge was first recorded in the current-clamp mode for 8 to 10 minutes once a stable level had been reached and the recorded PHN neuron was determined as B or D type (see Idoux et al., 2008). PHN neurons that had resting membrane potential more negative than -50 mV and a spike amplitude > 45 mV were selected for the voltage clamp experiments. Types D and B neurons from the prepositus hypoglossi nucleus were measured for different stimulus amplitudes and membrane potentials. Based on the criteria for time invariance discussed in the Rationale section, five type D and six type B neurons were selected for detailed analysis. All measurements were made with stimuli applied for twice the duration used in the analysis. Only the last half of the record was used to assure that a steady state condition was reached. At voltage clamp potentials near threshold, transient currents due to uncontrolled action potentials occasionally occurred in the non-analyzed initial part of the recording, however they were completely inactivated by the maintained depolarization with no firing during the latter analyzed part of the record. In some experiments 25-50 M NMDA (Sigma, St Quentin Fallavier, France) was applied in the presence or absence of 2 µM TTX (Tocris, Bristol, UK).
The data acquisition was done with a PC-compatible computer running Windows XP, using MATLAB scripts (MATLAB 7.0, MathWorks, Natick, MA, USA). Recordings were low-pass filtered at 2 kHz and digitized at 5 kHz (BNC-2090 + PCI-6052E, National Instruments, Austin, TX, USA). The OneSidedPValue (p-value) of MeanTest[x-y] for paired differences, mean values and standard deviations (±SD) were calculated with the HypothesisTesting package of MATHEMATICA 7.0, (Wolfram Research, Champain, IL, USA).
Rationale
PHN neurons were analyzed with QSA, which specifically selects harmonic and intermodulation frequencies, described as follows. If a double sinusoidal input has frequencies and then the linear response will have exactly the same frequencies and . However, the quadratic response will include additional harmonics and as well as intermodulation products and . This principle can be generalized to a multi-sinusoidal input in which case the quadratic response will include double of each input frequency as well as sum and difference of each pair of distinct input frequencies. A quadratic response can generate frequency overlaps when distinct combinations of input frequencies generate the same output frequency. For instance, a multi-sinusoidal input with frequencies 1, 2, 3, 4 (in Hertz) would generate many frequency overlaps such as or and so on. In presence of frequency overlaps, it is not possible to unambiguously measure the nonlinear frequency interactions. In the previous example, the measurement at 5 Hz is ambiguous because one is unable to distinguish between the contributions of and . In order to avoid this problem, the QSA was used with a flexible algorithm generating incommensurable frequencies. This approach is based on a practical measurement technique, namely harmonic probing on Volterra kernels (Boyd et al., 1983; Victor and Shapley, 1980).
Since harmonic and intermodulation responses also exist for nonlinearities of higher degrees, for example third order intermodulation products , it is important to ensure that the neurons mainly manifest quadratic nonlinearities, otherwise the results would be significantly contaminated. For this, a necessary, but not sufficient condition, consists of using relatively small stimulus amplitudes in such a way that only linear and quadratic responses are significant. This approach was used in our previous piecewise linear analysis (Murphey et al., 1995), hence the term piecewise quadratic analysis can be used to describe the QSA extension. The influence of the input amplitude on the harmonic response has been investigated previously (see Moore et al., 1980; FitzHugh, 1983). In order to ensure that the stimulus amplitudes were sufficient to overcome spontaneous noise and avoid significant higher order responses, several algorithms described elsewhere (Magnani and Moore, 2010) have been implemented in MATLAB to verify that the experimental traces are time invariant for both linear and quadratic outputs, and that the signal can be adequately reconstructed by quadratic analysis.
It will be shown that the oscillatory type D neurons of the PHN have quadratic responses over a range of subthreshold membrane potentials, namely they convert limited amplitude and bandwidth input signals to wider bandwidth and more complex output responses as mentioned above for nonlinear responses. Under normal physiological conditions of current clamp, a depolarization activates gNaP conductance that in turn increases the impedance and consequently reduces the electrotonic length. Type B neurons show similar effects and in addition, they have a significant increase in the electrotonic length at hyperpolarized membrane potentials because of the activation of a hyperpolarization activated conductance (Erchova et al., 2004).
Voltage clamp experiments were done to partially control the oscillatory and bistable responses of PHN neurons in order to analyze the nonlinear membrane properties of both the somatic and dendritic regions of these neurons. Indeed, an important advantage of a quantitative voltage clamp analysis of central neurons is the exploitation of the space clamp problem as a way to separate somatic and dendritic responses, namely the voltage clamp current measured from the voltage controlled soma is generally dominated by the unclamped voltage responses of the dendrites (Moore et al., 1999). Thus, this current can be used as a measure of both linear and nonlinear dendritic potential responses while the somatic membrane potential is voltage clamped. These additional currents can flow because of a potential difference between the soma and the rest of the dendrite. In fact, these additional currents reflect the behavior of the dendritic membrane potential that can be taken into account with multi-compartmental models.
Previous voltage clamp measurements have been done using signals of small amplitude to obtain steady state linear responses at different membrane potentials. These measurements were done over a potential range to obtain a quantitative description of the voltage dependent conductances and have allowed the construction of neuronal multi-compartmental models of both type B and D PHN neurons (Idoux et al., 2008). These models allow an estimation of both somatic and dendritic membrane properties from somatic voltage clamp experiments that probe the soma and all regions of the dendritic structure.
When the stimulus amplitudes are sufficiently small to elicit linear responses, both the voltage clamp and the current clamp generate equivalent linear results, however this is not the case for nonlinear responses. The present series of voltage clamp experiments is a quadratic extension of the steady state linear analysis. Voltage clamped neurons show two kinds of nonlinearities : first, space clamped somatic ionic currents, and second, ionic currents in the soma due to an unclamped dendritic membrane. However, in a similar current clamp experiment, the nonlinear behaviors measured from the soma are caused by the voltage responses of both the somatic and the dendritic membranes. Due to this asymmetry between voltage clamp and current clamp, there is no obvious way to predict the voltage clamp nonlinear response from the current clamp nonlinear response nor the converse. It is well known in the linear case that the admittance from voltage clamp, , is the inverse of the impedance from current clamp , that is where or refers to Fourier transforms of I and V, respectively. In the nonlinear case, with nonoverlapping frequencies, the quadratic response for the voltage clamp is defined by QSA as and for the current clamp by , where is a symmetry factor (Magnani and Moore, 2010). In general and are not reciprocally equivalent because of the asymmetry discussed above. Hence, this is an important conceptual difference between linear and nonlinear analysis, which also plays a role in interpretation of current versus voltage clamp experiments.
The terms, and where and are either positive or negative frequencies refer to all complex values of and at the interactive and harmonic quadratic frequencies. The quadratic response function can then be represented as magnitude and phase plots versus and .
Matrix reduction
Since is difficult to interpret, it is convenient to reduce it to a diagonal matrix through eigendecomposition methods. Similar methods have been used in quantitative neuronal analyses, for example singular value decomposition (Lewis et al., 2002) or principal component analysis (Haas et al., 2007). To make this reduction, it is important to note that the matrix obtained by row flipping is actually Hermitian. As a consequence, can be reduced to a diagonal matrix such that where is a unitary matrix and its complex conjugate transpose. The unitary matrix contains no information about the magnitude and can be viewed as a kind of generalization of the phase. The magnitude is entirely encoded in the diagonal matrix . The elements of are called eigenvalues. Each column of the matrix is a special vector called an eigenvector, whose coordinates are expressed relatively to the stimulus frequencies. The amplitude of each eigenvalue indicates the relative contribution of the corresponding eigenvector to the quadratic response. Practically, the eigendecomposition can be interpreted as a reduction of the quadratic neuronal function to a set of quadratic filters in which eigenvalues play the role of amplitudes.
The responses at the stimulus frequencies are shown in Figure 1A as interpolated black points. The color coded points illustrate the smaller amplitude current responses at the quadratic frequencies. At low frequencies both the linear and nonlinear responses are quite comparable despite the fact that the standard deviation of the imposed voltage clamp stimulus was only 2.85 mV. In Figure 1B, each cell of the QSA matrix encodes the magnitude of the corresponding quadratic interaction . Informally, the QSA matrix can be viewed as a quadratic generalization of the admittance, thus it is an intrinsic characterization of the measured neuronal response. The interpolations were performed by the MATLAB command GRIDDATA (linear method) in order to represent the responses in 3D color plots over a continuous range of frequencies. As a characteristic function, the QSA matrix is independent of the stimulus amplitude, however the current responses become proportionally insignificant as the stimulus approaches zero. The responses of higher orders are insignificant for stimulation amplitudes below ±3 mV.
The QSA matrix, , is the core mathematical object which encodes the total effect of the pairwise interactions at the interactive frequencies. Each matrix cell is located at the intersection of two input frequencies. In this way, the one dimensional admittance function is generalized to a two dimensional quadratic function . The QSA along with linear analysis can be used to reconstruct the signal using and . Figure 1B shows that the maximum amplitude for the interactive frequencies occurs at the intersection of 2 Hz and 10.4 Hz ( ).
The eigendecomposition of these data strongly suggests that depolarized type D neurons are dominated by a single eigenvalue as illustrated in Figure 1C. Even when two eigenvalues are required to adequately describe the response, the eigendecomposition provides a remarkably compact representation of the nonlinear response that otherwise can only be quantitatively described by complex differential equations involving large numbers of dendritic compartments. It would appear that the neuronal function becomes more complex, in the sense of information processing, as the number of significant eigenvalues increases.
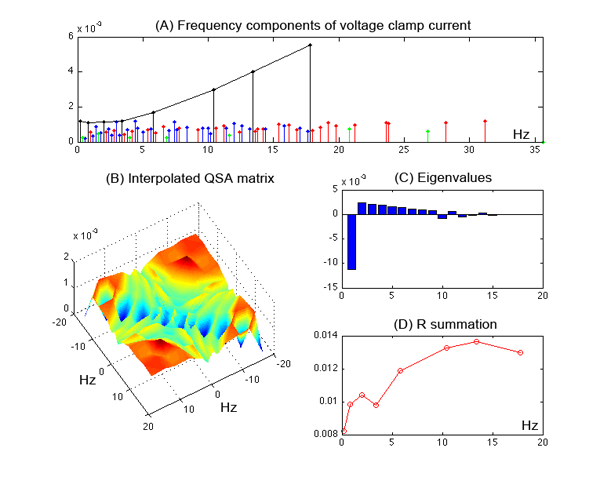
(A) Amplitude of the evoked linear current responses (black points with interpolation line) and nonlinear frequency components (colored points). The stimulation show an increasing amplitude as the frequency increases. The nonlinear interactions are shown as individual points for in red, in blue, in green where and are positive.
(B) Three dimensional plot of the magnitudes of the interpolated QSA matrix for a continuous range of frequencies. Each axis is indexed by 8 negative followed by 8 positive frequencies, which are shown as a 16x16 square matrix.
(C) Eigenvalues of the QSA matrix, illustrating the dominance of one eigenvalue. The abscissa is shown with numbers indicating each of the 2N eigenvalues by decreasing magnitudes.
(D) Summation showing the influence of each stimulation frequency in the quadratic responses.
The voltage command was a multsinusoidal stimulation, which had a standard deviation of 2.85 mV. For all plots, the frequency components were computed with the MATLAB command FFT divided by the number of points. The current was measured in nA and the voltage in mV. The stimulation was constructed from the nonoverlapping set (0.2, 0.8, 2, 3.4, 5.8, 10.4, 13.4, 17.8) in Hz.
Matrix summation
The previous matrix reduction has the great advantage of being reversible, such that from and one can exactly recover . There exists a coarser simplification by summing the QSA matrix by columns to obtain a vector indexed by the stimulation frequencies. The summation is defined as follows :
The values of R are illustrated in Figure 1D. The advantage of the R functions is that they can be presented as classical Bode plots. Moreover, each R function can be intuitively interpreted as a measure of the influence of each individual stimulation frequency on the nonlinear responses involving its interaction with all other stimulation frequencies. Hence, matrix summation is especially well suited to superimpose and compare with the piecewise quadratic analysis for different steady state responses.
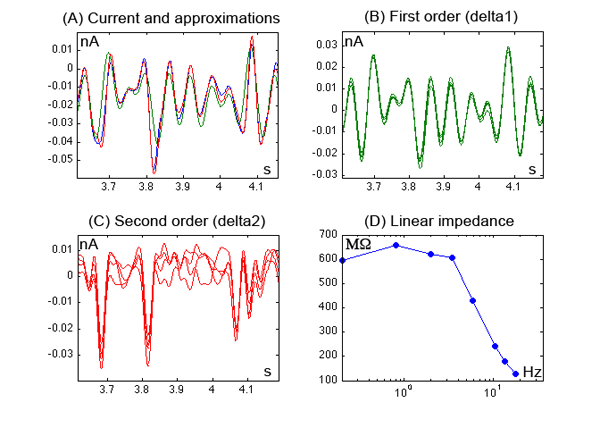
(A) Superposition of the averaged data with the first (green) and second order (red) responses to describe the total neuronal response (blue).
(B) Superposition of only first order responses for four traces.
(C) Superposition of only second order responses for four traces which provides an indication of the synchrony and reproducibility of the second order components in the data for significantly large amplitudes.
(D) Linear impedance interpolated from the stimulating frequencies.
Figure 2A shows a reconstruction of the measured currents with the first and second order responses. The contribution of the nonlinear frequencies can be quantitatively expressed by comparing the ratios of the spectral energy of the linear versus linear + quadratic responses to the total spectral energy for the entire range of frequencies. Since the maximum stimulus frequency was 17.8 Hz, a frequency range of 36 Hz > 2 x 17.8 was selected for the total sum. Clearly, the quadratic reconstruction is much more accurate than the linear one, which is confirmed by evaluating the signal energy, 61% for the linear analysis against 96% for the quadratic analysis. The discrepancy between the second order ratio and 100% shows how well a second order approximation fits the total response, as well as an indication of the presence of other higher order responses for the frequency range selected. Higher order responses clearly are more prominent with a depolarization due to the augmentation of the nonlinear behavior of both second and higher order responses.
Since the second order responses have relatively low amplitudes it is essential to ensure that the contributions of other noise sources, such as synaptic events or membrane ion channel fluctuations, do not significantly contribute to the observed responses at the harmonic and interacting frequencies. The synchrony and reproducibility of the data is shown by superimposing first order (Figure 2B, delta1) and second order (Figure 2C, delta2) computed responses for four sequential measurements. A time invariance correlation function was used to determine an optimal stimulus amplitude, which is large enough to overcome the spontaneous noise of the neuron and not too great to evoke significant higher order responses (Magnani and Moore, 2010). Finally, the usual linear impedance, , is shown in Figure 2D.
Results
Type D neurons
It is difficult to get accurate measurements of the quadratic responses in current clamp for the type D neurons, mainly due to uncontrolled spontaneous oscillations. Thus, voltage clamp experiments were done to control the oscillations and measure the negative current associated with the persistent sodium conductance gNaP. The nonlinear responses evoked by 5-10 mV voltage clamp stimuli can also be blocked (not shown) by riluzole as described in an earlier steady state piecewise linear analysis of gNaP (Idoux et al., 2008).
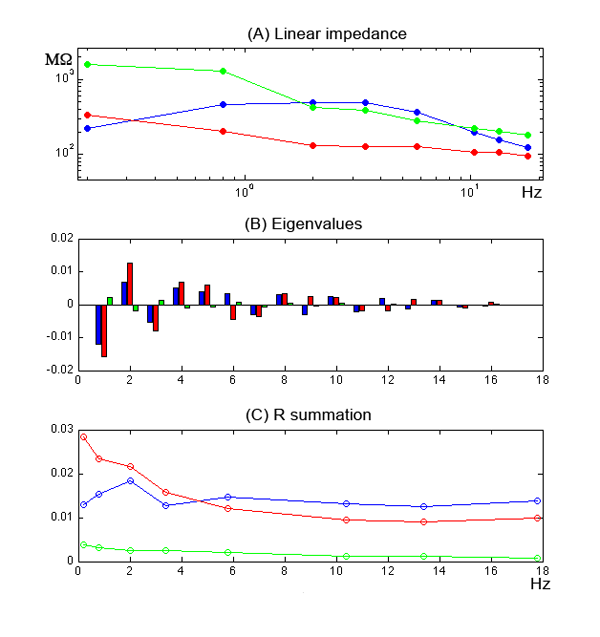
Figure 3A shows the increased linear impedance magnitude evoked by progressive depolarizations. Since gNaP can be seen as a negative conductance, its activation by depolarized membrane potentials reduces the total conductance of the cell, which leads to an increase of impedance. The nonlinear responses are indicated by eigenvalues (Figure 3B) and R summation (Figure 3C), whose magnitudes clearly increase with depolarization. For this neuron, the spectral energy analysis led to ratios 99% and 100% at -60 mV, and 77% and 98% at -50 mV for the linear versus linear + quadratic responses, respectively.
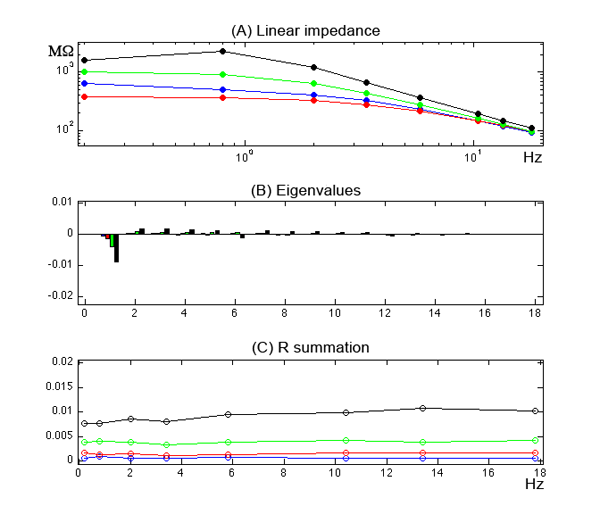
(A) Linear impedance, however it should be noted that the stimulus is a controlled voltage that leads to a current response. The depolarization markedly increases the impedance.
(B) Eigenvalues of the QSA matrix. The abscissa is shown with numbers indicating each of the 2N eigenvalues by decreasing magnitudes.
(C) Magnitude of R summations of the corresponding QSA matrix. They also increase during a depolarization.
Statistically in five neurons the maximum eigenvalue increased for a change of membrane potential of -60 to -50 mV from 0.002±0.001 to 0.010±0.001 with p-value=0.00004. The mean value of R±SD increased from 0.005±0.003 to 0.023±0.004 with p-value=0.0003.
Type B neurons
It has been shown previously that type B neurons have a prominent gNaP, which often leads to net inward current carried by Na+ for a limited range of voltage clamped depolarized membrane potentials (Idoux et al., 2008). Voltage clamped data in Figure 4 illustrate that type B nonlinear responses are significantly enhanced by depolarization and in addition, often show a resonant enhancement of the impedance. The impedance shows a maximum at an intermediate depolarization and a shift to a higher resonance frequency with further depolarization. In contrast, Figures 4B and C show that both the eigenvalues and the R summation values increase monotonically with depolarized membrane potentials. Interestingly, the number of significant eigenvalues required to describe the nonlinear response is generally two or more, unlike the single eigenvalue usually needed for type D neurons. For this neuron, the spectral energy analysis led to ratios 99% and 100% at -60 mV, and 82% and 96% at -41 mV for the linear versus linear + quadratic responses, respectively.
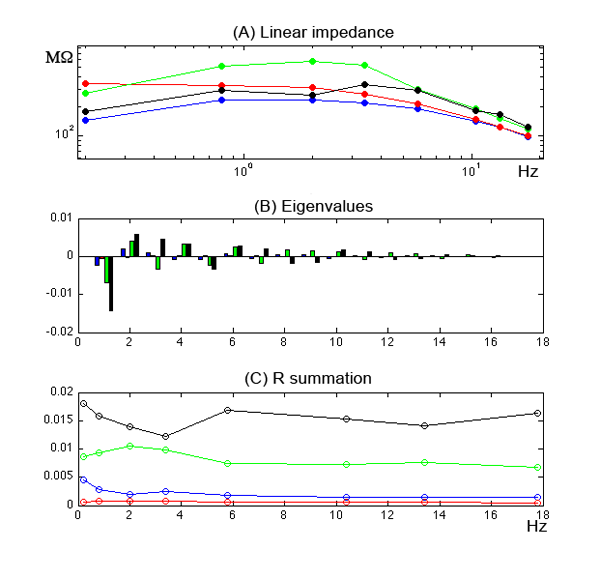
(A) Linear impedance showing resonance induced by the depolarization.
(B) Multiple eigenvalues increasing with depolarization in contrast to a single dominant eigenvalue observed for type D neurons. The abscissa numerically labels the eigenvalues by decreasing magnitude.
(C) Magnitude of R summations.
These plots show that nonlinear responses are present at both hyperpolarized and depolarized membrane potentials.
Statistically in six neurons, for a positive membrane potential change of 5 mV in the range -60 to -40 mV, the maximum value of the eigenvalue increased from 0.004±0.003 to 0.014±0.009 with p-value=0.008 and the mean value of R±SD increased from 0.009±0.006 to 0.03±0.02 with p-value=0.01.
Effect of gNaP and NMDA activation
Nonlinear responses are likely to be enhanced by the activation of dendritic NMDA receptors, which would occur during synaptic activity of the neural integrator network. NMDA activation could trigger dendritic bistable responses that contributes to maintaining a particular firing rate after an input impulse. Figures 5B and C show that the addition of NMDA clearly enhances nonlinear response of a type D neuron consistent with the trigger hypothesis. The mean value of R and the maximum eigenvalue for all neuronal types increased significantly with the addition of NMDA. TTX reduces the nonlinear effects of NMDA to control values or less, however it is still capable of inducing potential oscillations in current clamp (not shown). Control (with gNaP, without NMDA) versus NMDA + TTX treated neurons (without gNaP, with NMDA) did not show a significant p-value. Thus, NMDA and gNaP are synergistic in their action, where the combined effects are generally greater than either alone. Since the normal physiological activation of NMDA receptors is due to transient synaptic currents, the non-inactivation of gNaP and membrane potential bistability contribute to the maintenance of a depolarized potential. In conclusion gNaP appears to be essential for sustained nonlinear effects induced by NMDA activation and thus would be critical for the operation of the neural integrator.
(A) Effect of 25 M NMDA on linear impedance. The impedance decreases with NMDA (red) and increases with 2 M TTX (green) compared to the control (blue)
(B) The NMDA plots (red) illustrate that the nonlinear responses are increased by the presence of NMDA. Moreover, TTX (green), which blocks gNaP, when added to NMDA shows decreased eigenvalues. The abscissa numerically labels the eigenvalues by decreasing magnitude.
(C) Effect of NMDA and NMDA+TTX on R summation. The R values are in inverse order to the impedance magnitudes.
Statistically, pooled data from five neurons (three of type B and two of type D) in the presence versus absence of 25-50 M NMDA over the range -66 to -40 mV, showed a significant difference in the mean values of R summation (p-value = 0.026). Similarly the maximum eigenvalues were significantly different with a p-value of 0.035. TTX reduces the nonlinear effects of NMDA to control values or less (p-value = 0.09). An insignificant p-value of 0.2 was found comparing control with NMDA + TTX treated neurons.
Type D and B neuronal model simulations
In order to provide an interpretation of these experimental results, numerical simulations have been done using previously published models of types D and B for rat PHN neurons (Idoux et al., 2008). These models have been constructed from a piecewise linear analysis to fit parameters of nonlinear differential equations in voltage clamp. Unless otherwise indicated, both models had three uniformly distributed voltage dependent conductances, gK, gNaP and gH with a soma and eight dendritic compartments. Typically the gH of type D neurons is quite small and could be neglected.
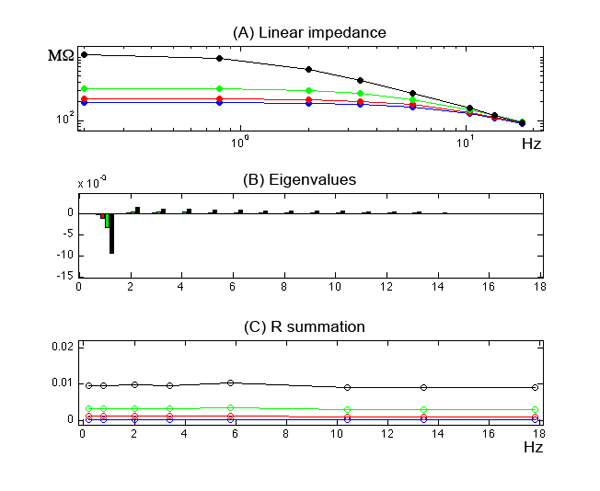
(A) Linear impedance. The depolarization markedly increases the linear impedance.
(B) Eigenvalues of the QSA matrix. The abscissa numerically labels the eigenvalues by decreasing magnitude.
(C) Magnitude of R summations of the corresponding QSA matrix.
The following parameter values were used: csoma = 20.5 pF; aratio = 3.77; elength = 0.54; gleak = 1.2 nS(1.37 nS); vleak = -53 mV; gk = 1.18 nS; vn = -32 mV; sn = 0.06(mV)-1 (0.05 (mV)-1); tn = 10 msec; vk = -87 mV; gH = 0; sm = 0.06 (mV)-1; tm = 150 sec; vNa = 77 mV; vm = -38 mV (-35 mV); gNaP= 0.9 nS (0.6 nS). Parameter values shown in parentheses are default values defined in Idoux et al., 2008.
Simulations done with the published average parameter values were consistent with the voltage clamp data, however some appropriate modifications of the average parameters were done for the comparison with the data for the individual neurons of Figures 3 and 4. Four potentials are shown to cover the range observed in the experiments. The type D data and model generally show a dominant eigenvalue (see -50 mV in Table 1 and Figure 6).
The simulations of the type B model in Figure 7 show behavior similar to the data of Figure 4, showing two or more significant eigenvalues compared to an essentially single dominant eigenvalue for the type D model (Figure 6). However Tables 1 and 2 indicate that the number of significant eigenvalues for both neuronal types is dependent on both the membrane potential and specific parameter values. For example, at -40 mV with or without NMDA, Figure 5 B shows a type D neuron with multiple significant eigenvalues (also, see Table 1).
In addition, the monotonic increase in the R summation of the type B model nonlinear responses with depolarization contrasts with the peaking of linear impedance increase similar to that observed in the type B neuron of Figure 4. In general the impedance increase with depolarization is caused by the activation of the gNaP negative conductance that balances the other positive conductances. An impedance maximum, often with a resonance, occurs because the impedance decreases with further depolarization due to an increased gK.
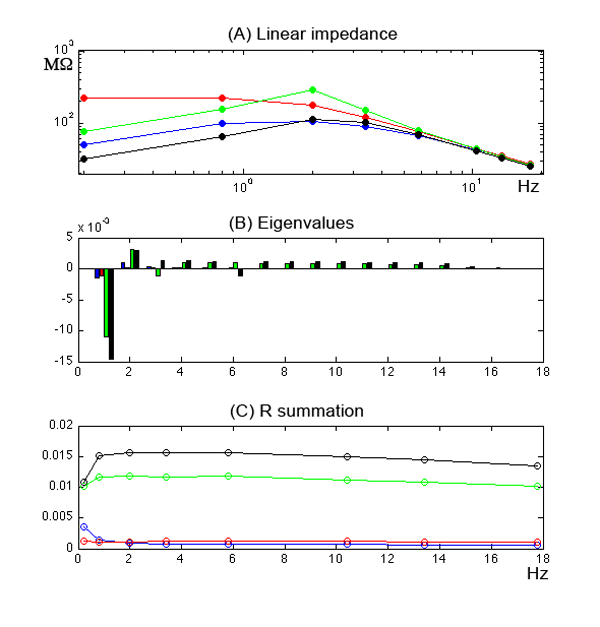
(A) Linear impedance. The magnitude shows a resonant maximum at -46 mV.
(B) Eigenvalues of the QSA matrix. The abscissa numerically labels the eigenvalues by decreasing magnitude.
(C) Magnitude of R summations of the corresponding QSA matrix.
The parameter values were as follows: csoma = 0.0000995 F (0.0000265); aratio = 2.6 (2.85); elength = 0.31 (0.37); gleak = 0.001297 S (0.000878); vleak = -56.61 S (-54.9); gk = 0.005555 S (0.0024); vn = -38.7 mV (-35); sn = 0.07715/mV (0.05); tn = 0.66 sec (.09); vk = -87 mV; gH = 0.00644 S (0.00591); vq = -79.7 mV (-63.9); sq = -0.0667/mV (-0.0647); tq = 1.75 sec (8.43); vk2 = -43 mV; gNaP = 0.00147 S (0.00131); vm = -35 mV; sm = 0.05/mV (.056); tm = 0.00015 sec; vnmda = 77 mV; Parameter values shown in parentheses are default values from Idoux et al., 2008.
The nonlinear responses of type B model simulations, in contrast to type D, show that the quadratic response is greatly reduced in magnitude at -60 mV, in part because the type B model has a greater density of voltage dependent gNaP conductances on a relatively more compact dendritic structure than found for type D neurons. In addition, the nonlinear responses in the type B model, as in the data of Figure 4, are enhanced at hyperpolarized potentials directly due to the gH conductance.
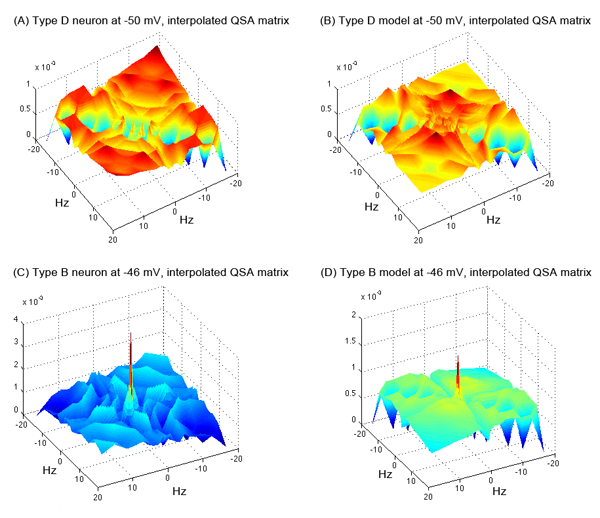
The use of nonoverlapping frequencies is required for the construction of QSA matrices from experimental measurements. Nevertheless, it is possible to do a coarse interpolation for other frequencies as plotted in Figure 8. The interpolated QSA matrices for type D and B neurons show striking differences, which also occur in their mathematical models. Figures 8A and 1B show local peaks in the QSA plots at two membrane potentials for the same type D neuron, which are comparable to the type D model simulation in Figure 8B. By contrast the type B neuron and model (Figure 8C, D) show a prominent low frequency peak distinctly different than observed in type D neurons. The QSA matrix clearly provides significantly more information about the neuronal behavior than linear parameters and has the possiblilty of being extended to all frequencies of interest.
In order to test the hypothesis that the dendritic conductances are mainly responsible for the nonlinear responses, simulations were done with gNaP reduced in the soma and unchanged in the dendrite or the converse as indicated in Tables 1 and 2. In type D neurons, decreasing the soma gNaP has a lesser effect (79%) on the R summation compared with decreasing the dendritic gNaP (13%). Simulations of type B model neurons showed a lesser effect for a gNap reduction in the more compact dendrite (34%). Such simulations support the hypothesis that the nonlinear responses measured under voltage clamp conditions are dominated by dendritic responses, while the linear responses are determined by both the soma and dendrite. Since the somatic region has good voltage space clamp control, one would expect a dominant linear current response from the somatic conductances at all membrane potentials, however the significantly larger dendritic membrane area is not space clamped leading to uncontrolled voltage excursions and greater nonlinearites. In conclusion, these simulations suggest that nonlinear responses in voltage clamped neurons are dominated by active dendritic structures, when their electrotonic lengths are above 0.3.
| soma-Na | dendrite-Na | Vm | Rmean | 1 | 2 | 2/1(%) |
|---|---|---|---|---|---|---|
| 1 | 1 | -40 | 0.0162 | +0.0160 | -0.0049 | 31 |
| 1 | 1 | -50 | 0.0095 | -0.0095 | +0.0015 | 16 |
| 0 | 0 | -50 | 0.0011 | +0.0011 | -0.0002 | 18 |
| 0.01 | 1 | -50 | 0.0075 | -0.0074 | +0.0012 | 16 |
| 1 | 0.01 | -50 | 0.0012 | -0.0012 | +0.0003 | 25 |
| soma-Na | dendrite-Na | Vm | Rmean | 1 | 2 | 2/1(%) |
| 1 | 1 | -40 | 0.0140 | -0.0141 | +0.0027 | 19 |
| 1 | 1 | -50 | 0.00652 | -0.0063 | +0.0018 | 29 |
| 0 | 0 | -50 | 0.00104 | +0.0018 | -0.0008 | 44 |
| 0.01 | 1 | -50 | 0.00467 | -0.0044 | +0.0020 | 45 |
| 1 | 0.01 | -50 | 0.00221 | -0.0019 | +0.0015 | 79 |
Discussion
The neurons of the prepositus hypoglossi nucleus (PHN) provide a useful system to investigate nonlinear behavior, such as persistent activity to maintain eye position. The oscillatory character of some of these neurons is similar to that observed in the stellate neurons in layer IV of entorhinal cortex (Haas and White, 2002; Schreiber et al., 2004), which are also involved in the processing of orientational information. PHN neurons are part of the brainstem that receives head velocity signals and integrates them to control eye position for the stabilization of an image at the center of the visual field during head rotation. This specific processing is called neural integration (Aksay et al., 2007) due to an analogy with integration in mathematical calculus.
In order to understand how the PHN neural network can perform neural integration, it is important to understand the biophysical properties of individual neurons involved in the circuitry. Single neurons of the PHN show oscillatory and bistable nonlinear properties that are likely to be involved in the operation of the neural integrator. Since models based on recurrent excitation, even including lateral inhibition, are not sufficiently robust, a number of theoretical papers have suggested that the nonlinear properties of individual neurons are essential for the network behavior of the neural integrator (Koulakov et al., 2002; Goldman et al., 2003). Thus, the finding that oscillatory nonlinear behavior is clearly present in the neurons involved in the eye movement circuitry (Idoux et al., 2006) lends strong support to these theoretical notions. Dendritic characteristics (Johnston and Narayanan, 2008) are potentially critical for the function of these neurons, which in addition have also shown to be different for the two main classes of PHN neurons (Idoux et al., 2008).
Thus, type D oscillatory neurons have bistability properties, which are consistent with neural integrator models that rely on remote dendritic processing (Goldman et al., 2003; Idoux et al., 2008). The experiments and analysis in this paper strongly support the hypothesis that type D neurons have persistent sodium channels in their dendrites, which would promote remote bistable potentials shifts leading to persistent activity. Type B neurons have an even higher density of persistent sodium channels and their passive electrotonic length is less than type D. As a consequence, the type B neurons at moderate depolarizations would have a more uniform potential throughout the less isolated dendritic tree.
The gNaP conductance in the dendrites can easily be activated by the synaptic stimulation of the NMDA receptors likely to occur during normal physiological activity. In addition, NMDA activation enhances total nonlinearities, which are shown for a type D neuron and also observed in type B neurons (see Figure 5). In current clamp conditions, both types of neurons show marked potential oscillations in the presence of 25-50 M NMDA (Idoux et al., 2006). Clearly the level of NMDA activation expected during synaptic activation would be much less, however it is likely to be sufficient to evoke significant nonlinear responses due to the gNaP in both type B and D neurons. In this regard, the neural integrator model of Koulakov et al. (2002), depends on NMDA synapses that activate gNaP dependent bistable states in dendritic compartments.
The quantitative measurement of the biophysical properties of intact neurons is seriously compromised by the inherent inability to voltage clamp the electrotonic structure of the dendritic tree. In general whole cell measurements are restricted to patch clamp electrodes placed in the soma, which makes it difficult to infer the remote properties of the dendrites. Previous piecewise linear analyses have permitted the development of realistic neuronal models, however it has been difficult to separate the properties of the dendrites from the soma unless patch clamp electrodes can be placed in the dendrites. The new approach described in this paper takes advantage of the space clamp problem associated with voltage clamping neurons. The quadratic analysis has shown that it is possible to characterize the nonlinear behavior of the uncontrolled dendritic membrane voltage responses while maintaining voltage clamp control of the somatic membrane. When the dendritic electrotonic structure is remote with relatively large surface areas compared to the soma, the nonlinear behavior of the dendritic membrane dominates the soma. This is especially the case in a voltage clamp experiment because of the lack of dendritic potential control.
It was found that responses in the range of ±(5-10) mV could be well described by quadratic nonlinearities suggesting that nonlinearities of higher degrees only add marginal improvement. Thus, the quadratic response is likely to sufficiently capture most of the nonlinear behavior of neuronal systems except for extremely large synaptic inputs. The quadratic functions are quite sensitive to the mean membrane potential and appear to be valid for a range of sinusoidal inputs. This behavior extends significantly the validity of the quantitative quadratic description.
The quadratic functions are computed on particular sets of nonoverlapping frequencies, which can be interpolated over a continuous range of frequencies as illustrated in Figures 1B and 8. Thus, they provide a significantly concise description of the neuronal behavior and could potentially be used as computational devices that would be independent of nonlinear differential equations. Practically, this could be an alternative approach to large scale neural network simulations.
The estimation of the parameters of both the voltage dependent conductances and the electrotonic structure have shown quantitative differences between type B and D neurons (Idoux et al., 2008). In addition, the nonlinear analysis in this paper suggests that the number of significant eigenvalues is greater for the type B versus the type D neurons and their individual models. Thus, the measured nonlinearities seems to be structurally different between type B and D, namely the two corresponding types of quadratic functions are intrinsically different (Figure 8). In general the dominant eigenvalue was negative, which is related to the negative slope conductance due to gNaP. Type D model simulations at large depolarizations (see Table 1 at -40 mV) show that the maximum eigenvalue (1) is positive, consistent with a positive slope conductance due to an increased outward potassium current. In contrast, the greater gNaP of the type B model maintains a negative 1 at -40 mV (Table 2). Both type D and B models show positive 1 values if gNaP is totally removed from the soma and dendrite.
In conclusion, the work described in this paper provides a novel way to concisely quantify the fundamental nonlinearities underlying of individual neurons. By allowing rigorous comparison of any neuronal model with the behavior of real neurons, it makes possible to show that nonlinear responses in voltage clamp are dominated by the active dendritic structure. A determination of the molecular basis of the eigenvalue analysis should provide a better understanding of how neurons use their remarkable nonlinear properties in information processing.
References
- Aksay et al. (2007) Aksay E, Olasagasti I, Mensh BD, Baker R, Goldman MS, Tank DW (2007) Functional dissection of circuitry in a neural integrator. Nat Neurosci 10:494–504.
- Boyd et al. (1983) Boyd S, Tang Y, Chua L (1983) Measuring volterra kernels. IEEE Transactions on Circuits and Systems 30:571–577.
- Erchova et al. (2004) Erchova I, Kreck G, Heinemann U, Herz AVM (2004) Dynamics of rat entorhinal cortex layer ii and iii cells: characteristics of membrane potential resonance at rest predict oscillation properties near threshold. J Physiol 560:89–110.
- Fishman et al. (1977) Fishman HM, Poussart DJ, Moore LE, Siebenga E (1977) K+ conduction description from the low frequency impedance and admittance of squid axon. J Membr Biol 32:255–290.
- FitzHugh (1983) FitzHugh R (1983) Sinusoidal voltage clamp of the hodgkin-huxley model. Biophys J 42:11–16.
- French (1976) French AS (1976) Practical nonlinear system analysis by wiener kernel estimation in the frequency domain. Biological Cybernetics 24:111–119.
- Goldman et al. (2003) Goldman MS, Levine JH, Major G, Tank DW, Seung HS (2003) Robust persistent neural activity in a model integrator with multiple hysteretic dendrites per neuron. Cereb Cortex 13:1185–1195.
- Gutkin and Ermentrout (1998) Gutkin BS, Ermentrout GB (1998) Dynamics of membrane excitability determine interspike interval variability: a link between spike generation mechanisms and cortical spike train statistics. Neural Comput 10:1047–1065.
- Haas et al. (2007) Haas JS, Dorval AD, White JA (2007) Contributions of ih to feature selectivity in layer ii stellate cells of the entorhinal cortex. J Comput Neurosci 22:161–171.
- Haas and White (2002) Haas JS, White JA (2002) Frequency selectivity of layer ii stellate cells in the medial entorhinal cortex. J Neurophysiol 88:2422–2429.
- Hodgkin and Huxley (1952) Hodgkin AL, Huxley AF (1952) A quantitative description of membrane current and its application to conduction and excitation in nerve. J Physiol 117:500–544.
- Idoux et al. (2008) Idoux E, Eugene D, Chambaz A, Magnani C, White JA, Moore LE (2008) Control of neuronal persistent activity by voltage-dependent dendritic properties. J Neurophysiol 100:1278–1286.
- Idoux et al. (2006) Idoux E, Serafin M, Fort P, Vidal PP, Beraneck M, Vibert N, Muehlethaler M, Moore L (2006) Oscillatory and intrinsic membrane properties of guinea pig nucleus prepositus hypoglossi neurons in vitro. J Neurophysiol 96:175–196.
- Izhikevich (2002) Izhikevich EM (2002) Resonance and selective communication via bursts in neurons having subthreshold oscillations. Biosystems 67:95–102.
- Johnston and Narayanan (2008) Johnston D, Narayanan R (2008) Active dendrites: colorful wings of the mysterious butterflies. Trends Neurosci 31:309–316.
- Koulakov et al. (2002) Koulakov AA, Raghavachari S, Kepecs A, Lisman JE (2002) Model for a robust neural integrator. Nat Neurosci 5:775–782.
- Lewis et al. (2002) Lewis ER, Henry KR, Yamada WM (2002) Tuning and timing of excitation and inhibition in primary auditory nerve fibers. Hear Res 171:13–31.
- Magnani and Moore (2010) Magnani C, Moore LE (2010) Quadratic sinusoidal analysis of voltage clamped neurons. arXiv:1007.0858v1.
- Marmarelis and Naka (1973) Marmarelis PZ, Naka KI (1973) Nonlinear analysis and synthesis of receptive-field responses in the catfish retina. i. horizontal cell leads to ganglion cell chain. J Neurophysiol 36:605–618.
- Moore et al. (1999) Moore LE, Chub N, Tabak J, O’Donovan M (1999) Nmda-induced dendritic oscillations during a soma voltage clamp of chick spinal neurons. J Neurosci 19:8271–8280.
- Moore et al. (1980) Moore LE, Fishman HM, Poussart DJ (1980) Small-signal analysis of k+ conduction in squid axons. J Membr Biol 54:157–164.
- Murphey et al. (1995) Murphey CR, Moore LE, Buchanan JT (1995) Quantitative analysis of electrotonic structure and membrane properties of nmda-activated lamprey spinal neurons. Neural Comput 7:486–506.
- Schetzen (2006) Schetzen M (2006) The Volterra and Wiener Theories of Nonlinear Systems Krieger Publishing Company.
- Schreiber et al. (2004) Schreiber S, Erchova I, Heinemann U, Herz AVM (2004) Subthreshold resonance explains the frequency-dependent integration of periodic as well as random stimuli in the entorhinal cortex. J Neurophysiol 92:408–415.
- Vervaeke et al. (2006) Vervaeke K, Hu H, Graham LJ, Storm JF (2006) Contrasting effects of the persistent na+ current on neuronal excitability and spike timing. Neuron 49:257–270.
- Victor and Shapley (1980) Victor J, Shapley R (1980) A method of nonlinear analysis in the frequency domain. Biophys J 29:459–483.