X-QUEST: A Comprehensive X-ray Study of Local ULIRGs and QSOs
Abstract
We present results from the X-ray portion of a multi-wavelength study of local ULIRGs and QSOs called QUEST (Quasar-ULIRG Evolution STudy). The data consist of new and archival X-ray data on 40 ULIRGs and 26 PG QSOs taken with Chandra and XMM-Newton. A combination of traditional and hardness ratio spectral fitting methods is used to characterize the X-ray properties of these objects. The absorption-corrected 2-10 keV to bolometric luminosity ratios of the ULIRGs and PG QSOs suggest that the likelihood for dominant nuclear activity increases along the merger sequence from “cool” ULIRGs, “warm” ULIRGs, infrared-bright QSOs, and infrared-faint QSOs. The starburst dominates the total power in ULIRGs prior to the merger, and this is followed by rapid black hole growth during and after coalescence. These results are in general agreement with those obtained in the mid-infrared with Spitzer and recent numerical simulations.
1 Introduction
Since their wide-spread detection by the IRAS satellite over 20 years ago, the energy source in luminous () and ultraluminous () infrared galaxies (U/LIRGs) has been under debate. It is thought that reprocessed starlight and/or active galactic nuclei (AGNs) are responsible for the enormous luminosities these objects exhibit in the infrared, but the exact contribution from each component is hard to determine. Sanders et al. (1988) proposed that U/LIRGs and quasars are linked through galaxy mergers and ULIRGs are simply the dust-enshrouded phase in the merging process. The authors suggested that the energy source evolves along the merger sequence from starburst-dominated LIRGs to AGN-dominated ULIRGs and ultimately quasars. The question of the energy source in U/LIRGs has cosmological implications. At higher redshifts (), U/LIRGs are a significant population, contributing in large part to the cosmic star formation (e.g., Sanders & Mirabel, 1996; Blain et al., 2002). About a third of the high- ULIRGs are ongoing gas-rich mergers (e.g., Daddi et al., 2007; Shapiro et al., 2008; Förster Schreiber et al., 2009). The fraction of high- ULIRGs which are mergers increases with luminosity (e.g., Tacconi et al., 2008). Merger simulations by Li et al. (2007) suggest that vigorous star formation is needed to reproduce the observed dust properties of high redshift quasars. Li et al. (2008) were able to reproduce the observed spectral energy distribution of SDSS J1148+5251, a quasar at using these merger simulations. Their work support the starburst-to-quasar evolutionary scenario for some luminous quasars at high redshifts. However, at high redshifts, secular processes may play a more dominant role than in the local universe and the merger scenario may not be necessary for the formation of some quasars (e.g., Dekel & Birnboim, 2006). If the generalized merger scenario holds true, then a large fraction of the high- ULIRGs may be the progenitors of some of the present-day quasars.
Higher redshift objects are difficult to study, so as a first step in understanding the role U/LIRGs play in the formation of some quasars and elliptical galaxies, we utilize local U/LIRGs and quasars as laboratories for studying merger physics. Past ground-based optical and near-infrared photometry have shown that essentially all ULIRGs show signs of interaction, indicating that they are ongoing mergers (e.g., Kim et al., 2002; Veilleux et al., 2002). Recent simulations support the scenario that quasars can indeed be formed through gas-rich galaxy mergers (e.g., Hopkins et al., 2005, 2006, 2008). Therefore, the two populations may be linked.
To further study this relationship, we are conducting a comprehensive, multi-wavelength imaging and spectroscopic survey of local ULIRG and QSO mergers called QUEST — Quasar/ULIRG Evolution STudy. The goal of the project is to investigate the evolutionary link between the two groups of luminous objects in the nearby universe. The sample consists of 1-Jy ULIRGs and Palomar Green (PG) quasars. The 1-Jy sample of ULIRGs is a group of very well studied objects in the infrared and optical (e.g., Veilleux et al., 2002; Kim et al., 2002). We pair the ULIRGs with another group of objects with a wealth of ground- and space-based data — the PG QSOs. At luminosities above L⊙, ULIRGs and PG QSOs are the only two types of extragalactic sources with similar space densities and bolometric luminosities in the local universe (Sanders & Mirabel, 1996). While in some respect the PG QSOs are not representative of all quasars as a group, Jester et al. (2005) have shown that for PG QSOs with redshifts below 0.5, the selection biases are minimal. The detailed QUEST sample selection is described in Veilleux et al. (2009a) (hereafter V09a) and references therein.
To date, optical and infrared portions of QUEST have found that ULIRGs and PG QSOs have similar galactic structure and stellar host dynamics. Results from an HST NICMOS imaging study by Veilleux et al. (2006, 2009b) suggest that AGN-like objects, including the QSOs, are generally of early morphological type and have less pronounced merger-induced morphological anomalies than systems with LINER-like or HII region-like spectral types and cooler infrared colors ( 0.2). Infrared-bright QSOs generally have more pronounced merger-induced morphological anomalies than infrared-faint QSOs. The velocity dispersion distributions in ULIRGs resemble those in intermediate mass ellipicals/lenticulars with moderate rotation and the black hole masses of these ULIRGs are estimated to be of the order , as demonstrated by Dasyra et al. (2006a, b) using VLT spectroscopic data and the M relationship of Tremaine et al. (2002). The black hole masses derived from similar data on a dozen PG QSOs agree with those of coalesced ULIRGs (Dasyra et al., 2007), suggesting that the bulk of the black hole growth takes place in the ULIRG phase of the merger.
Ultimately, if ULIRGs and PG QSOs are linked through mergers, then we should see an evolution of the energy production mechanism along the merger sequence. As the merger ages, the dominant source of infrared radiation should change from starburst (triggered by the interaction) to nuclear activity. As part of QUEST, we performed Spitzer IRS observations of PG QSOs which showed that starbursts are responsible for at least 30%, but likely most, of the far-infrared (FIR) luminosity of the quasars (Schweitzer et al., 2006). V09a found that, on average, AGN contribute % of the bolometric luminosity in the QUEST ULIRGs. The AGN contribution ranges from 15% – 35% among cool optically classified H II-like and LINER ULIRGs, and 50 and 75% among warm Seyfert 2 and Seyfert 1 ULIRGs, respectively. This number exceeds 80% in PG QSOs. Thus, a trend of increasing AGN contribution is seen along the merger sequence, in general agreement with the standard ULIRG-QSO evolution scenario.
As ULIRGs are the results of the merging of gas-rich disk galaxies, obscuration may be an issue for optical and infrared observations. While radio emission is less affected by intervening material, the bolometric luminosity in the radio band is insignificant to prove that accretion onto supermassive black holes is the dominant energetic process. X-ray emission, on the other hand, generally contributes more significantly than the radio emission to the bolometric luminosity of an AGN and is also less affected by obscuration than the optical and infrared emission. X-ray observations therefore have the potential to isolate the AGN contribution from that of the starburst, assuming the former arises from a compact region associated with the accretion disk. Chandra and XMM-Newton are excellent complementary instruments for this purpose. The high spatial resolution of Chandra is ideally suited to search for unresolved hard X-ray (2–10 keV) nuclei indicative of AGNs. However, the absence of such a nucleus does not necessarily imply a starburst origin since a large gas column ( cm-2) in the line of sight (possibly due to a torus) could strongly attenuate the hard X-rays. In this case, X-rays emitted along the polar axis may be electron scattered into the line of sight, with the signature of an Fe K line of large equivalent width (1 keV; e.g., Ghisellini et al., 1994; Krolik et al., 1994). This is where the excellent sensitivity and spectral resolution of XMM-Newton near the Fe K complex become most useful for AGN diagnostics.
In the present paper, we focus on the X-ray properties of the QUEST ULIRGs and PG QSOs. There have been previous X-ray snapshot studies of U/LIRGs (e.g., Franceschini et al., 2003; Ptak et al., 2003; Teng et al., 2005), but the sample selection criteria for these surveys differed, making systematic comparisons difficult. The analyses of the X-ray data presented in this paper are performed in an uniform manner with an unprecedented large number of ULIRGs and PG QSOs. It is hoped that the contributions of the starburst and the AGN to the bolometric luminosity in these objects can be quantified systematically and with statistical significance. Our current sample consists of 40 ULIRGs and 26 PG QSOs from the QUEST sample that have publicly available X-ray data from Chandra and/or XMM-Newton. These represent 51% of the ULIRGs and 79% of the PG QSOs in the full QUEST sample. Table X-QUEST: A Comprehensive X-ray Study of Local ULIRGs and QSOs lists the QUEST objects with X-ray data. 3C 273 and PG 0157+001 are both ULIRGs that are also PG QSOs. For the purpose of this paper, and to be consistent with the previous papers in this series (e.g., V09a), we consider these to be ULIRGs. To improve the statistics of our analysis and extend the range in infrared luminosity, we also add to the sample 26 non-QUEST U/LIRGs from the Chandra archive. These objects are part of the Revised Bright Galaxy Survey (RBGS; Sanders et al., 2003) and are discussed in more detail in Iwasawa et al. (2010, submitted).
The organization of this paper is as follows. The techniques used for taking and reducing the data are discussed in §2. The spectral fitting analyses for both ULIRGs and PG QSOs are described in §3. We address the origin of the soft excess seen in PG QSOs in §4. In §5, we comment on the possible evolutionary link between ULIRGs and quasars, combining the X-ray data with recent Spitzer and HST observations. The results are summarized in §6. In Appendix A, we examine the reliability of the hardness ratio (HR) method developed in Teng et al. (2005) for low-count X-ray sources. Throughout this paper, we adopt = 70 km s-1 Mpc-1, = 0.3, and = 0.7.
2 Observations and Data Reduction
The observations of ULIRGs and PG QSOs presented in this paper are selected from the Chandra and XMM-Newton archives as well as our own (PI: Veilleux) guest observer (GO) programs (Chandra cycle 10 and XMM-Newton cycle 7). Only ACIS-S data are considered for the Chandra analysis. Similarly, only EPIC data are considered for the XMM-Newton observations. Table 2 lists details on the available observations.
2.1 Data Calibration and Extraction
2.1.1 Chandra Observations
The reduction of the archived Chandra data was performed using CIAO version 4.1.1 and CALDB version 4.1. The cycle 10 GO data were reduced using CIAO version 4.1.2 and CALDB version 4.1.3. The Science Analysis Threads for ACIS data111http://cxc.harvard.edu/ciao4.1/index.html outline the procedure used to process and reduce the data. Table 2 lists the total exposure for each observation after the selection of good time intervals where the data are not affected by background flares.
The source spectra were extracted with circular regions centered on the source. For most observations, background spectra were selected from an annular source-free region that surrounds the nuclear extraction area. However, in particularly crowded fields, a nearby circular, source-free region was used. The sizes of the regions vary depending on the angular extent of the sources, especially in U/LIRGs where there are a lot of extended diffuse emission. The region sizes range between 15 to 50 arcseconds and were maximized to include all emission from the galaxies, unless limited by nearby sources or gaps in the CCD detectors.
2.1.2 XMM-Newton Observations
The archived XMM-Newton data were processed using the XMM-Newton Science Analysis System (SAS), version 7.1.0, released on 2007 July 8. The event lists were re-calibrated with the latest available calibration files as of 2008 July. The Cycle 7 GO data on PG 0838+770, PG 1435067, and B2 2201+31A were reduced using SAS version 8.0.1. The standard processing procedures outlined in § 4.13 of the XMM-Newton SAS User’s Guide (Issue 5.0) were followed for both archived and GO data. Times of high background flares were flagged and the total good time interval for each observation is listed in Table 2. The standard method of background screening involves discarding time intervals affected by background flares where the background count rates at energies above 10 keV are above the recommended thresholds of 0.35 counts s-1 and 1 counts s-1 for EPIC-MOS and EPIC-pn data, respectively. While the MaxSNR method introduced by Piconcelli et al. (2004) would maximize the total net exposure times of the data, this method is only appropriate to use for data of high-flux sources. X-ray observations of U/LIRGs (e.g., Franceschini et al., 2003; Ptak et al., 2003; Teng et al., 2005) have shown that these data have low signal-to-noise ratios (SNRs). Therefore, we have conservatively chosen to use the standard method of background screening for a consistent treatment of ULIRG and PG QSO data.
The cross-calibration between the EPIC-MOS and the EPIC-pn cameras has some time and energy dependencies222XMM-Newton Calibration Documentation: http://xmm2.esac.esa.int/docs/documents/CAL-TN-0052-5-0.ps.gz.. Complications to the fits may result if spectra from both detectors are modeled simultaneously. Therefore, we chose to model the spectra from only the EPIC-pn camera due to its high quantum efficiency and the inability to extract background spectra when the small window mode was used in many of the EPIC-MOS observations. The EPIC-MOS data were used only in the few cases where the EPIC-pn data were unavailable or have much lower SNRs than the EPIC-MOS data: PG 0838+770 has very low SNRs, PG 1244+026 has very few detected counts above 5 keV, PG 1613+658 and PG 1626+554 have data highly affected by background flares.
The SAS task EPATPLOT was used to determine whether the observations on the PG QSOs were affected by pile up. Only three sets of observations were found to be piled-up: PG 0844+349, the 17 December 2004 observation of PG 1116+215, and PG 1426+015. In these cases, the observations were re-extracted using annular regions to exclude the central part of the source which is the most susceptible to pile-up, as recommended by the SAS User’s Guide. This pile-up correction method is reliable and does not affect the shape of the output source spectrum333XMM-Newton Calibration Documentation: http://xmm2.esac.esa.int/docs/documents/CAL-TN-0036-1-0.ps.gz..
The XMM-Newton source spectra were also extracted with circular regions centered on the source ranging between 25 to 50 arcseconds depending on the angular sizes of the objects. For EPIC-pn data, the pointing center falls near a CCD gap. Thus, the background was selected from a nearby circular region in which no obvious background source resides. The background regions for EPIC-MOS data were selected in a similar fashion.
Where there are multiple observations of the same source with the same instrument and filters, an average spectrum is created using the FTOOLS task MATHPHA giving each input spectrum equal weight. The sources where this was performed are the EPIC-pn observations of PG 0050+124, PG 1116+215, PG 1440+356, and PG 1501+106.
3 Spectral Analysis
The spectral analysis was performed using XSPEC v12.5.0. All quoted errors are 90% limits on one parameter ( or c-stat = 2.706). The errors of the derived values in the rest of this paper are assumed to be at the 90% confidence level. Because of the differences in calibration, the effective energy range is 0.3–10.0 keV for EPIC-pn, 0.6-10.0 keV for EPIC-MOS, and 0.5–8.0 keV for ACIS. For consistency between the different detectors and with the literature, the soft X-ray band measurements are made between 0.5–2.0 keV while the hard X-ray band measurements are made between 2.0–10.0 keV where the best-fit models are used to extrapolate the 0.5–0.6 keV and 8.0–10.0 keV measurements from the EPIC-MOS and ACIS observations, respectively.
3.1 Results: PG QSOs
Depending on the number of detected counts, the extracted spectra of the PG QSOs are binned differently for spectral modeling. Their source spectra were binned to at least 50 counts per bin with the exception of those from fainter sources with relatively short integration times (PG 0838+770, PG 1001+054, PG 1004+130, PG 1126041, PG 1244+026, PG 1309+355, PG 1411+442, PG 1426+015, PG 1435067, PG 1613+658, PG 1626+554, and PG 2214+139) which were binned to at least 15 counts per bin so that statistics would be applicable.
In modeling the spectra, we take the same basic approach as in Teng et al. (2009): first, we assume a simple power-law distribution absorbed only by the Galactic column to describe the emission from the AGN. If the model is not a satisfactory fit to the data, then we consider adding a MEKAL component to describe the starburst, absorption by intervening material near the central source, and emission lines to model Fe K and lines of other elements, if applicable. The F-test is used to determine whether the additional components to the basic model are significant444Under certain conditions, such as testing for a spectral line, it is inappropriate to use the F-test for model selection. See Protassov et al. (2002) for caveats and details.. We assume P for significant additions. Hereafter, we refer to these models as the Power-Law (PL) models. Table 3 lists the best-fit parameters of the PL models to the PG QSOs and these are shown with the spectra in Figure 1. More complex models involving reflection and scattering such as those presented in Piconcelli et al. (2005) (hereafter P05 models), the blurred ionized reflection model presented in Crummy et al. (2006) (C06), and a constrained version of the C06 model with fewer free parameters (C06con, described below) were also considered.
The P05 model consists of a power law for the AGN plus four different continuum models to explain the soft excess often seen in AGN spectra (see § 4). These include a blackbody, multi-color blackbody, bremsstrahlung, and a second power law. Some of the sources also required additional absorption edge features between 0.6–0.8 keV. The best-fitting model varies for each source and according to their study, there does not seem to be an universal model for the quasar spectra. On the other hand, C06 selected a relativistically blurred reflection model as their universal model for the quasar continua. The model is a relativistic convolution (KDBLUR in XSPEC) of a photoionized disk reflection model (REFLION). The model assumes that a semi-infinite slab of optically thick cold gas of constant density is illuminated by emission from the corona. The reflected and the direct components are then convolved with a Laor line profile (Laor, 1991) to create the effect of blurring from a relativistic accretion disk. The blurred reflection model was invoked to explain the smooth soft excess features and the lack of strong iron lines seen in the PG QSOs. Unlike the P05 models, the C06 model is an universal model and can thus be applied to all the quasars in our sample. We first checked that we have applied the C06 model properly by ensuring that the best-fit values are consistent with those published in C06 for observations that overlap both samples. We then applied the C06 model more widely to all of our quasar spectra. The range of best-fit parameters derived from the C06 models require extreme values for the accretion disk. For example, the disk emissivity index (, the power law dependence of the emissivity, ) ranges from 1.3 to 10.0, the upper limit of allowable values. Therefore, we constrained the C06 model by fixing some of these parameters at their more widely accepted values to see if it would yield acceptable fits. In our constrained version (C06con), the emissivity index of the disk in the KDBLUR model component is fixed at the more commonly accepted value of 3.0. Since the iron abundance is less reliable, we conservatively fix the abundance of the REFLION component at solar. For the majority of objects, the inclination of the disk is also fixed at the default value of 30 degrees in order for the fit to converge so that . We find that the C06 models perform significantly better than the C06con models in only a few instances.
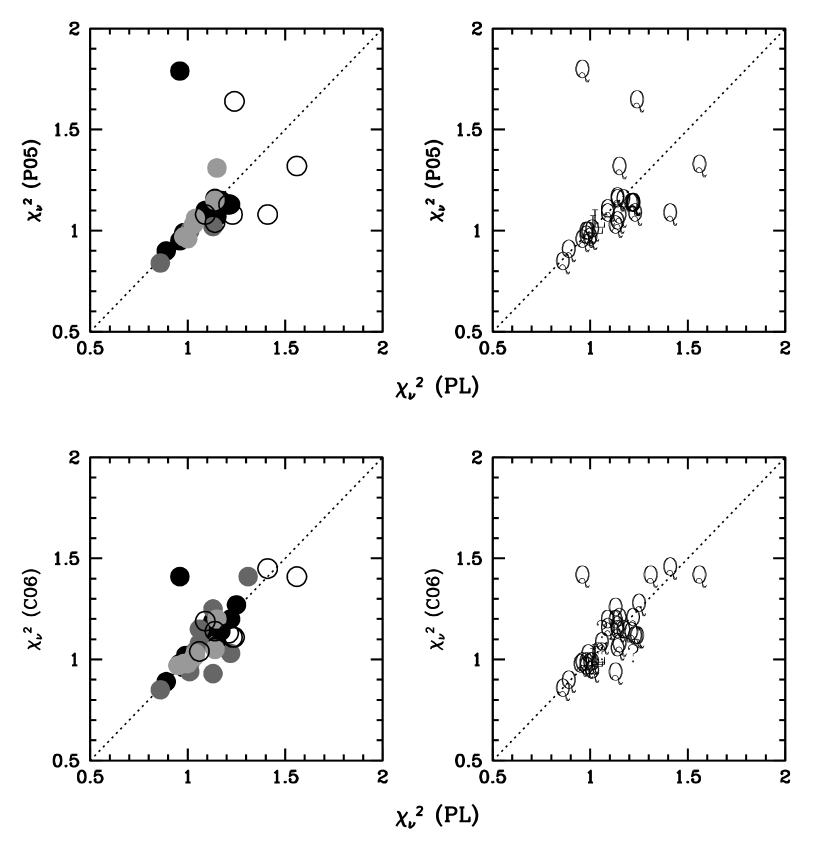
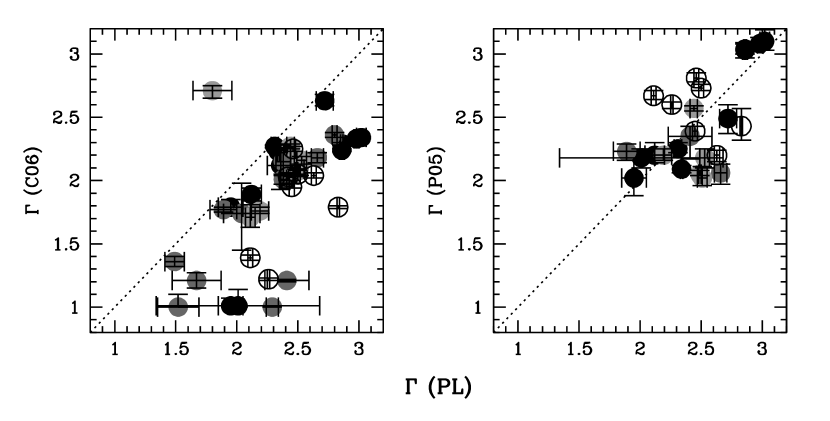
Tables 4, 5, and 6 list the best-fit parameters to the P05, C06, and C06con models to the PG QSO data, respectively. Figure 2 shows comparisons of the reduced values between the PL and the P05 and C06 models; the PL models appear to be as good as, or better than, the P05 and C06 models in fitting the data. In terms of the basic spectral properties, the PL models seem to be equally good in determining the photon index as both P05 and C06. Figure 3 is a comparison of the photon index as determined by the three methods. The P05 and PL models appear to be consistent with each other; however, the PL model requires softer spectra than the C06 models. Nevertheless, the photon indices as determined by all three methods are within the range previously measured in the PG QSOs by other authors (e.g., Porquet et al., 2004).
As the figures show, with the exception of a handful of observations, none of these models is statistically favored. However, variability in quasar spectra is well known, so the ideal model of the data should also naturally explain the observed variability seen in these objects. Thus, based on variability arguments, the C06 model appears to be the least likely explanation for the quasar spectra. C06 evaluated only single-epoch quasar spectra from XMM-Newton. They chose the longest available observation for objects with multiple data sets in the archive. The PL models can easily explain the variability by a change in the absorbing column (see Table 3); physically, this can be due to a clumpy torus viewed approximately edge on (see also Teng et al., 2009). In order for the C06 model to explain the variability (particularly the significant variability of PG 0050+124 and PG 1501+106), large changes in , the emissivity index, and the disk inclination are required (see Table 5). While it can be argued that the changes in and emissivity index are due to changes in the accretion flow of the black hole, the required change of about 30∘ in the observed inclination of the accretion disk over a the period of a few years is hard to justify.
3.2 Results: ULIRGs
As with previous U/LIRG surveys (e.g., Franceschini et al., 2003; Ptak et al., 2003; Teng et al., 2005), most ULIRGs in the present study were detected, but with many fewer counts than the average PG QSO. We separated them into three “brightness” categories: weak, moderate, and strong for the purpose of the analysis.
The “weak” sources are those with count rates and 0.05 counts per second when observed by Chandra and XMM-Newton, respectively. With the time allocated, these sources do not have enough counts for traditional spectral fitting and their spectral properties and fluxes are measured using the HR method (see Appendix A and Teng et al., 2005, for details). The spectral properties derived using the HR method for the weak ULIRGs are listed in Table 7.
The “moderate” sources are those with relatively low count rates, but the exposure times are long enough to obtain low signal-to-noise spectra with more than 100, but less than 1000, counts. For these sources, their spectral properties are modeled using both the HR method and traditional spectral fitting. The traditional spectral fits were performed using the Cash Statistics (c-stat Cash, 1978) option in XSPEC on unbinned spectra. The details of the fitting procedure are the same as those in Teng et al. (2008). Only the PL models are applied to these low signal-to-noise spectra. The best-fit properties are presented in Table 8.
Finally, the “strong” sources are those with relatively high count rates and relatively high signal-to-noise spectra having more than 1000 counts. The spectral modeling was performed using the statistics option in XSPEC as the spectra were binned to at least 15 counts per bin, with the exception of 3C 273, which was binned to at least 100 counts per bin. Again, only the PL models were applied to these ULIRG spectra. The spectral properties of these sources are also listed in Table 8.
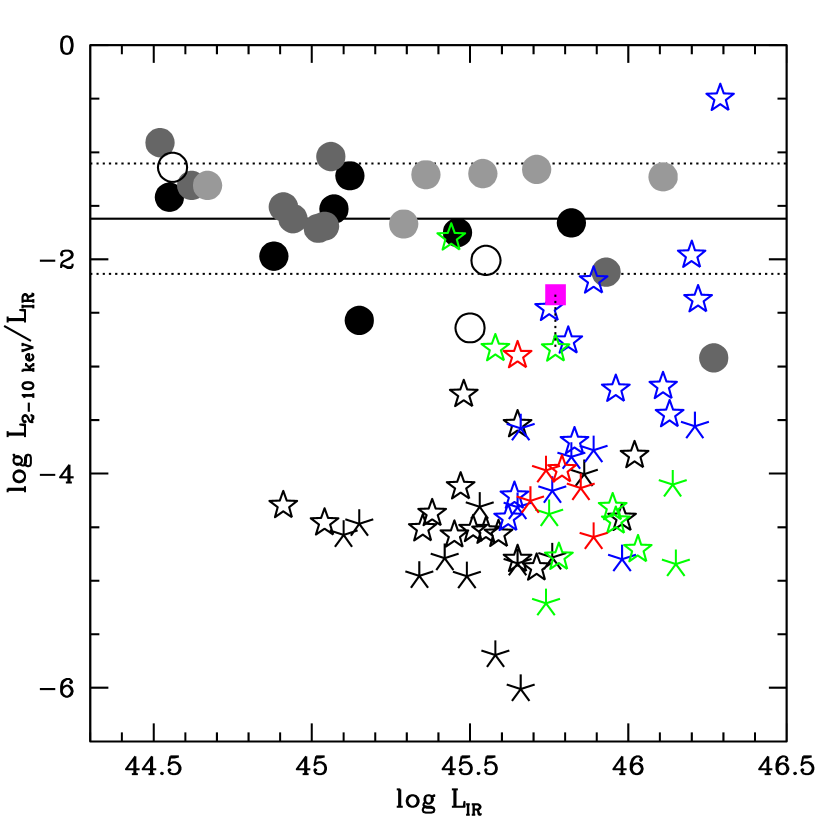
In general, the 2–10 keV band is less likely to be affected by obscuration and this is where AGN emission, if present, would dominate. Figure 4 is a comparison of the 2–10 keV and infrared luminosities of the U/LIRGs and PG QSOs. The U/LIRGs include the 26 RBGS objects from the Chandra archive for a total of 66 objects. For AGN-dominated objects like the PG QSOs, the 2–10 keV luminosity is consistently about 3% of the infrared luminosity. The 2–10 keV luminosity of the U/LIRGs, however, vary between 0.0001 to 3% of the infrared luminosity with the majority of the ULIRGs falling between () of (–4.5, –1.5). Comparison with the effective mid-infrared optical depth, , derived by V09a suggest that AGN-dominated objects also have the smallest extinction.
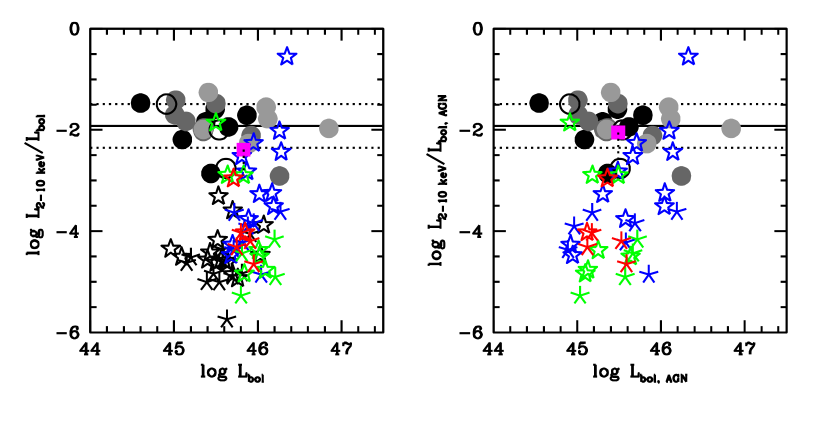
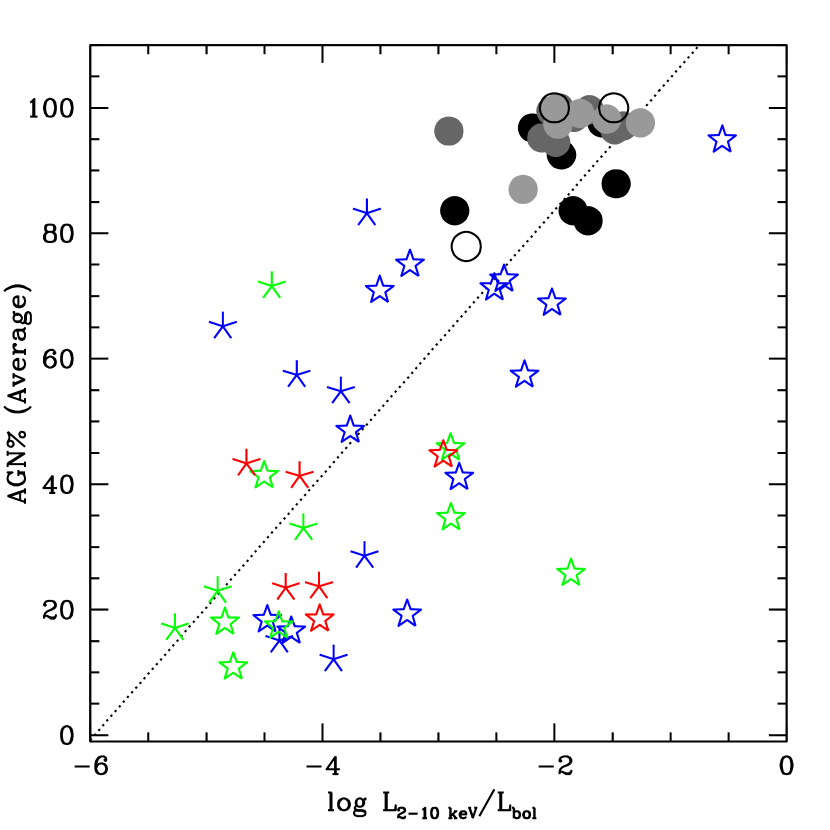
We also compared the 2–10 keV luminosity with the bolometric luminosity of the U/LIRGs and PG QSOs; the 2–10 keV to bolometric luminosity ratio is our proxy for AGN dominance. The bolometric luminosity is defined as for the U/LIRGs and for the PG QSOs. The left panel in Figure 5 plots this ratio against the total bolometric luminosity of our sample. For the U/LIRGs there is simply a small shift in both axes from Figure 4. The right-hand panel shows the same ratio plotted against the AGN contribution to the bolometric luminosity as derived by V09a. Again, we observe a spread of three orders of magnitude in the 2–10 keV to bolometric luminosity for the U/LIRGs. The importance of nuclear activity relative to that of the starburst increases slightly with the bolometric (infrared) luminosity of the ULIRG. We find again that the less obscured objects are more likely to be AGN-dominated.
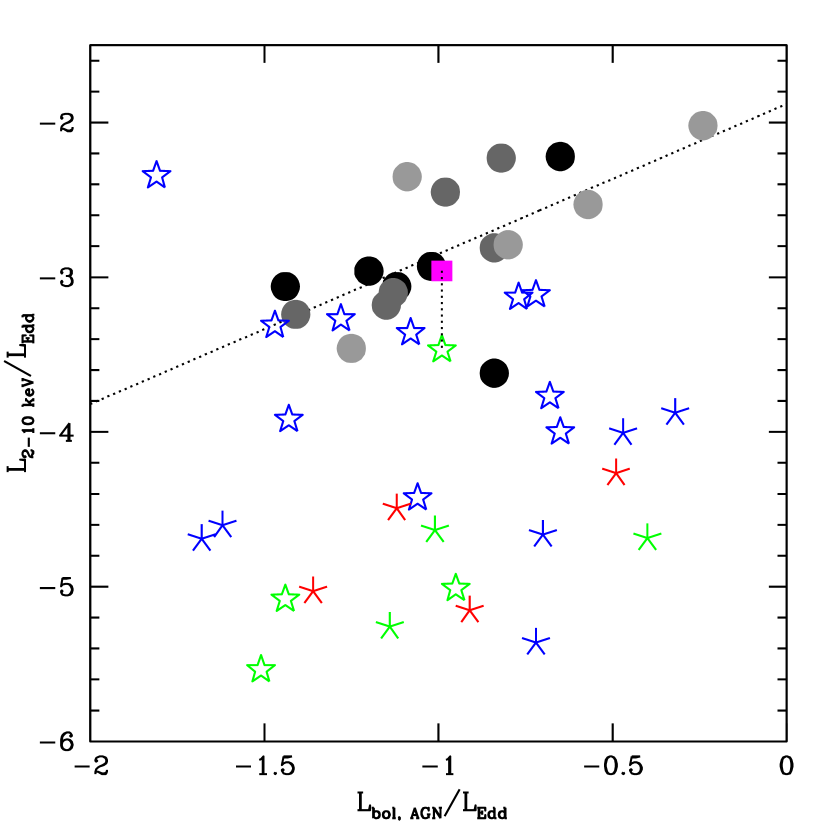
Veilleux et al. (2009b) derived black hole mass estimates using the H-band elliptical host magnitude to black hole mass relation from Marconi & Hunt (2003). The derivation does not include dust extinction beyond the nuclear regions of the hosts; this may possibly lead to underestimates of the black hole masses. The presence of recent/ongoing non-nuclear star formation is also not excluded which may cause overestimates in the black hole masses. Applying these photometrically derived black hole mass estimates from Veilleux et al. (2009b) to our X-ray observations, we calculate the 2–10 keV-to-Eddington luminosity ratio, our proxy for the Eddington ratio. Figure 6 compares the Eddington ratio derived from the X-ray methods with that from the mid-infrared methods presented in V09a. Since the X-ray values are only the 2–10 keV luminosity and not the bolometric luminosity of the AGN, there is a shift of a factor of about 30 – 100 between the horizontal and vertical values. The two methods are linearly correlated for the PG QSOs, but a discrepancy between the X-ray and mid-infrared AGN diagnostic methods is observed for the U/LIRGs. The cause of this discrepancy is discussed in § 5.2.
4 An Universal Spectral Model for the PG QSOs
PG QSOs have been very well studied in X-rays and at other wavelengths. However, many X-ray studies on PG QSOs in the literature have focused on only a handful of objects. Most studies have found that the X-ray spectra of PG QSOs tend to be more or less featureless, with sometimes small emission features near the iron K complex arising from neutral or ionized iron. Often, these iron emission lines have relatively small equivalent widths (100 eV) and are generally narrow. The continua of the X-ray spectra can be fit by a power law with 1.8 for the AGN, but the X-ray spectra of several PG QSOs (as well as many Seyfert galaxies) also contain what is termed the “soft excess” where there is emission in excess of the power-law below 2 keV. Bianchi et al. (2008) uses a model-independent method of comparing the 0.5–2 keV and 2–10 keV flux ratios as an independent measure of the soft excess strength. The authors confirm that the soft excess is a common feature in low-redshift active galaxies.
The presence of the soft excess in active galaxies was first identified in the 1980s (e.g., Arnaud et al., 1985). Ever since, the origin of the emission has remained a puzzle. In recent years, several authors including Porquet et al. (2004), P05, C06 have performed systematic analyses on large groups of quasar spectra in an attempt to find the best model that describes the excess emission. The current leading models for the soft excess include Compton up-scattering (Porquet et al., 2004), blurred reflection model (C06), complex absorption (Gierlinski & Done, 2004; Sobolewska & Done, 2007), and other models such as discussed in P05.
Porquet et al. (2004) at first thought that the soft excess originates from the inner accretion disk. This model explains naturally the smooth transition from UV accretion disk emission to the soft excess. However, the inferred blackbody temperatures from the modeling are too hot to be explained by direct emission from a thin accretion disk for reasonable values of the black hole mass. Thus, they prefer their alternate model, the Compton up-scattering of the extreme ultraviolet photons from the accretion disk to form the soft excess.
C06 presented a blurred reflection model as a universal model for the PG QSO spectra. Blurred reflection, caused by the relativistic motion in the accretion disk, is invoked due to the lack of broad iron lines observed in these objects. While this model fits the spectra well, it also requires extreme values for some of the model parameters, as explained in § 3.1.
Gierlinski & Done (2004) suggested that the soft excess is caused by a broad absorption trough at 2–5 keV, possibly related to an accretion disk wind. The smoothness of the observed soft excess, however, cannot be reproduced in the latest simulations (e.g., Schurch et al., 2009). Sobolewska & Done (2007) favor a complex absorption model based on their spectral modeling of two AGNs (PG 1211+143 and 1H0707–495) with large observed soft excesses.
Instead of a universal model for the soft excess, Piconcelli et al. (2005) found in their survey of 42 PG QSOs that the X-ray continua of these quasars are well fit by a combination of four different models. The four models are blackbody, multicolor blackbody, bremsstrahlung, and power law.
From a statistical stand point, all of the above models (as well as the PL models presented in § 3.1) are equivalent. The fitting statistics of the models to the data are very similar. Below, we describe a new approach to help us discriminate between the various models for the soft excess, where we model all of the PG QSOs with a single universal model, varying only a few key parameters from object to object. We do not know the actual origin of the soft excess, so instead of making assumptions about which model describes physics that we do not fully understand, we look at the data in a more general way.
The soft excess is a common feature in low-redshift active galaxies, including quasars. Therefore, it can be assumed that all QSO spectra have the same basic shape arising from the same physical phenomena. Let us further assume that there is a single (yet unknown) ideal model that describes the quasar spectra in the form of a power law (for the AGN) plus an additional component. Thus, each observed quasar spectrum is then a random variation of the basic ideal model. If we fit all the spectra simultaneously with the same model, then we should be able to define a median model for the quasars as a class. This median model, then, should help us identify a favored model that best fits all objects.
4.1 Modeling PG QSOs as a Class
For this multi-source fitting, we chose to use only XMM-Newton EPIC-pn observations to minimize cross-calibration issues. This includes 22 objects except PG 0804+761 (undetected), PG 1244+026 (few counts above 5 keV), PG 1613+658, and PG1626+554 (no pn data). Average spectra for objects with multiple observations were created using the FTOOLS task MATHPHA and used for the multi-source fitting.
For most of the models we tested using this global fitting method, we treated the continuum model as having two components and all of these components are modified by Galactic absorption. Since most of the PG QSO spectra do not show strong iron lines (see Figure 1)555The lack of strong iron lines in PG QSOs may be due to the X-ray Baldwin Effect where the intensity of the line is inversely correlated with the total luminosity of the quasars (Iwasawa & Taniguchi, 1993) or gravitational smearing (C06)., we only applied the global model to the continuum. The first of these components is AGN emission which includes the standard power law for an AGN spectrum. The second is the soft-excess component. This can be a blackbody, a Comptonization model, or a reflection model. For all the objects, we linked the photon index, soft-excess temperature, and the normalizations for each component to be the same for all objects (i.e. the median model for the class). However, we allowed model parameters that describe characteristics that may vary in individual sources, such as disk inclination, ionization parameter, and intrinsic source absorption, to be free. Since each source also has different brightnesses, a multiplicative factor was included for each of the components to adjust for the differences in intensity amongst the sources as well as the relative contributions between the different model components. Simply, the global model can be described in equation form: where Xi is the multiplicative factor for the AGN component that varies depending on the source and Yi is a similar factor for the soft excess component.
4.2 The Favored Model
Table 9 summarizes the 13 spectral models we examined as possible universal models for the PG QSOs. We first tested a simple power law model for the global QSO fit, model A of Table 9. It is a very poor fit to the data, giving a reduced 8.0. We then tested the absorption-based models for the origin of the soft excess, models B–E. A scattering model (B), see Teng et al. (2009) for a description, provided a better fit (3.0) but the model offered a poor description of the data at higher energies. A single partial covering absorption model (C) also gave a very poor fit (3.4). An additional partial covering absorber (D) provided a much better fit (1.8); however, the model severely underestimated the spectral flux above 5 keV. In this model, the nominal photon index of the spectrum was 2.8, much steeper than the generally observed range for AGNs (1.6–2.2). By adding a MEKAL component for the soft excess to the double-partial-covering model (E), we derived an even better model to the data (1.5), but the model still underestimated the flux above 5 keV as shown in Figure 7.
We then considered the Comptonization model of Porquet et al. (model F; 2004) for the soft excess. This model gives 2.1. While this is a much better fit to the data than the simple power law models, large residuals remain, providing a poor fit both at low (0.5 keV) and at high (4 keV) energies.
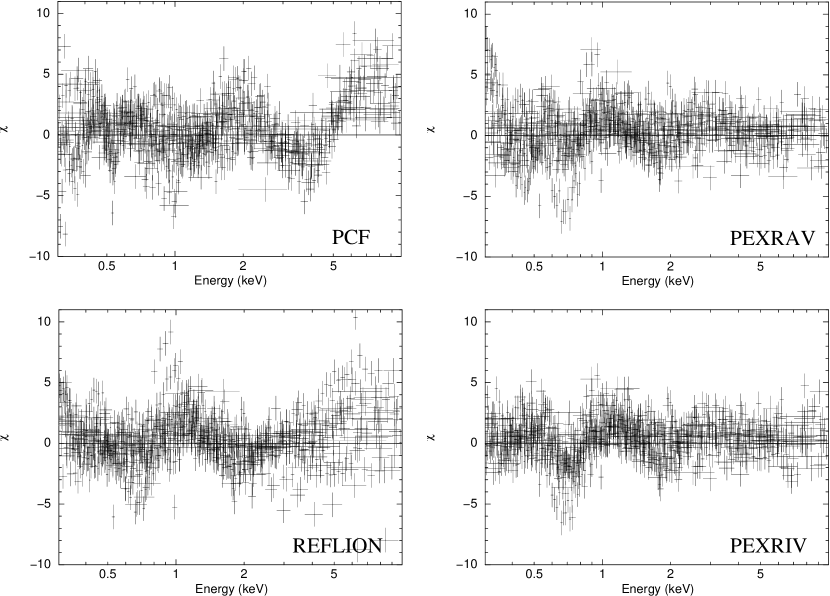
Finally, we tested the reflection-based models for the soft excess, models G–M. The reflection-based models are XSPEC models PEXRAV (a neutral reflector), PEXRIV (an ionized reflector), and a blurred reflection model (the C06 model). REFLION component in the C06 model is more complex than PEXRIV. PEXRIV considers only bound-free transitions in the reflected spectrum; REFLION also includes the ionization states and transitions for O and Fe ions. We first modeled each reflection-based model (models G–I). These attempts produced very poor results (3.0) and suggest that reflection cannot explain the soft excess. We then added a redshifted blackbody component to each of the reflection models for the soft excess. The reduced value for the model J is 1.3, a great improvement over the previous models. This model describes well the spectra above 1 keV, but is a poor model below this energy (see Figure 7). The PEXRIV plus blackbody model (model K) appeared to be a good fit to the data (1.2; Figure 7), except for an absorption feature around 0.7 keV (the atomic transition of O VII or O VIII). Lastly, we evaluated the C06 model plus a blackbody (model L). Surprisingly, this more complex model for an ionized reflector gives a worse fit than the simpler model K (1.4; Figure 7). In particular, this model is a very poor description of the spectra above 4 keV.
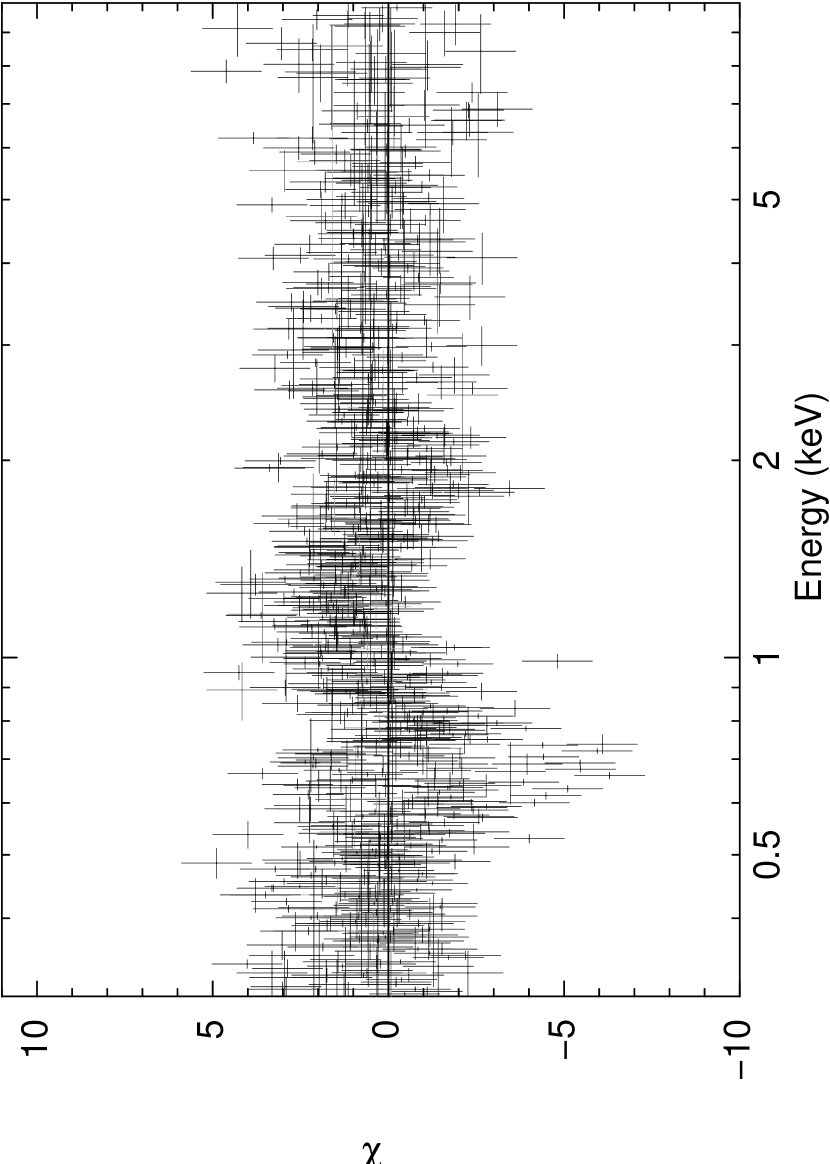
Based on the statistics and the residuals of the models, the multi-source fitting method indicates that a reflection-based model is favored as the universal model. However, there is still a requirement for a blackbody component in order to model the soft excess. One reason why the PEXRIV component offers a better fit than the REFLION component may be because many of the spectra do not require ionized reflection. Only 10/22 objects (45%) require the ionization parameter to be above 30 erg cm s-1, the minimum value for this parameter in REFLION. The PEXRIV component allows a full range of ionization parameters, starting with a minimum value of 0 erg cm s-1. It should be noted that model K with the PEXRIV component requires a steeper photon index (2.37) than model L with the REFLION component (2.02). While a photon index of 2.4 is steeper than the generally accepted value, it is the median value seen in PG QSOs (see Figure 3). When a redshifted absorption edge centered at around 0.68 keV was added to model K, the statistics greatly improved (1.1; Figure 8). For the three objects with EPIC-MOS data that were not included in the multi-source fitting, we applied the best-fit global model with the AGN and soft excess components fixed to individually model the MOS spectra. The best global fit of model M implies that and keV with an absorption edge at keV and optical depth of . The nominal energy of the absorption edge is consistent with the atomic transitions of O VII and O VIII. The reflected portion of the AGN contribution is 6–37%, with a median value of 18%, of the power law luminosity for all 25 objects666A reflection percentage of 37 is rather high. The two sources that have 37% reflected fraction are PG 1001+054 and PG 1004+130. The former object is the quasar with the fewest detected counts by EPIC-pn. Its lack of counts, particularly in the hard band where the reflected component dominates, may have resulted in a poor fit. The PG 1004+130 spectrum used in the universal fit is the average of two epochs. As can be seen in Figure 1 and unlike other objects presented in this paper with multiple observations, there is noticeable change in the spectral shape, particularly at below 2 keV. The average spectrum may not be representative of the source spectrum in general. Also, Miller et al. (2006) studied this object extensively. There is no obvious soft excess in this object.. Some of the other parameters derived from model M for the PG QSOs are listed in Table 10.
4.2.1 Disk Inclination
C06 suggested that the XMM-Newton data are sufficient to robustly measure the inclination angle of the accretion disk. Neither of the distributions of inclination angles from the global PEXRIV nor the constrained C06 models from the same 22 EPIC-pn spectra matches a random distribution. The inclination measurements are highly dependent on the model, which may indicate that the data cannot adequately assess the inclination values. This may also be a result of the small number of quasars in the sample. In any case, we caution against relying too heavily on the inclination measurements derived from the models whether fitted to individual or multiple sources. Since the subsequent analysis is based mainly on good X-ray flux measurements, we choose the model M as the best-fit model despite its shortcomings.
4.2.2 Origin of the Soft Excess
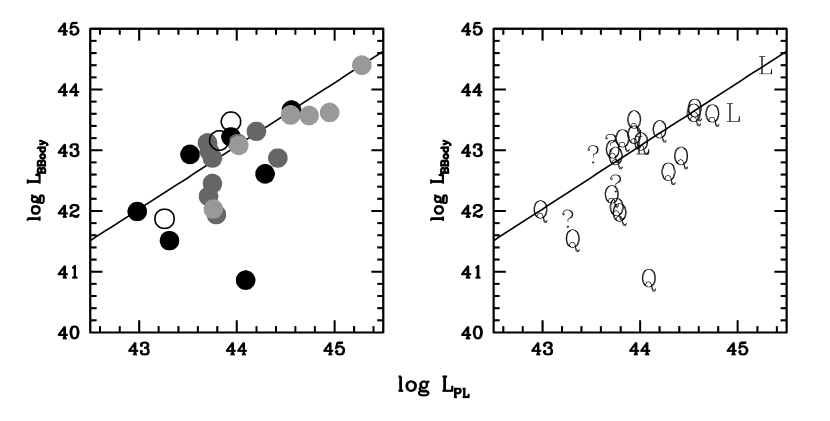
The global modeling of the quasar spectra suggests that the soft excess is not well described by an absorption model (§ 4.2). Figure 9 clearly shows that the 0.5–10 keV flux from the soft excess component is correlated with that from the AGN component based on model M. Linear regression analysis suggests that the two components are linearly correlated: . The correlation is very strong with and a significance of %. The outlier, PG 0050+124 (I Zw 1), is removed from the regression analysis; recall that this is the only source that retains an absorption feature in the residuals after the inclusion of the 0.7 keV absorption edge (see Figure 8). To within the errors, the expression derived from the PG QSO data is consistent with that found in a sample of Swift/BAT AGNs with soft excess (; Winter et al., 2009), but with a greater correlation coefficient. PG 1501+106 is the only overlap between the BAT and our PG QSO samples. The soft excess in AGNs and PG QSOs seems to arise from the same process. The linear relationship between the blackbody and power law luminosities precludes absorption as the origin of the soft excess, in agreement with Winter et al. (2009). A starburst origin of the soft excess in these objects is also ruled out. The soft excess luminosities are much higher than the expected starburst X-ray luminosities based on FIR measurements of star-forming galaxies (Persic et al., 2004).
Since the global model fits the AGN and the soft excess components independent of each other, it does not require the AGN components to be correlated with the soft excess. Therefore, the linear relationship between the input power law and the soft excess luminosities is significant and implies a link between the source of the power-law emission and the soft excess. We also compared the soft excess luminosity with black hole mass and ionization state of the reflector. Neither of these quantities is apparently correlated with the soft excess.
Many authors (e.g., Gierlinski & Done, 2004; Winter et al., 2009) have argued that if the soft excess were due to thermal emission arising from the accretion disk, then the blackbody temperature should correlate with the mass of the black hole or the Eddington ratio. Indeed, in this scenario, the thermal temperature should scale according to , assuming that all of the gravitational energy gained from accretion is re-radiated by the disk. Contrary to this, previous studies and our analysis in § 3.1 have found that the thermal temperature of the soft excess is consistently 0.1 keV. The constancy of the observed temperature is unexpected since the masses of both Seyferts (Winter et al., 2009) and PG QSOs (Veilleux et al., 2009b) span two orders of magnitude (M⊙). Using the absorption corrected 2–10 keV to Eddington luminosity ratio as a proxy for the Eddington ratio, we find that this quantity also spans two orders of magnitude for both PG QSOs and Seyferts (Figure 6 and Winter et al., 2009). Figure 10 is a histogram of the predicted PG QSO disk temperatures calculated using the photometric black hole mass estimates of Veilleux et al. (2009b) and the 2–10 keV luminosities. These are only estimates because the hard X-ray to bolometric luminosity correction for AGNs is uncertain (e.g., extreme ultraviolet measurements are not available for most of these objects). Lusso et al. (2010) found in 150 COSMOS AGNs that the 2–10 keV to bolometric luminosity correction can range from about 10 to about 200 with some dependence on the Eddington ratio. For our sources, given the weak dependence of the temperature on the Eddington ratio, the predicted disk temperatures may be underestimated by a factor of a few at most. As the figure shows, the disk temperature is surprisingly constant for all objects, with a mean of 1 eV and a standard deviation of 0.4 eV. Only a fraction of all QSOs could be plotted in this figure due to the lack of black hole mass information for many objects in our sample (see Veilleux et al., 2009b), so small number statistics may be an issue here. Nevertheless, the predicted temperature of the disk seems too low to explain the measured soft excess temperature of 0.1 keV.
The mechanism producing the soft excess must be mass independent. For example, suppose the corona is geometrically thick and thus at a temperature comparable to the local virial temperature in all sources. Then , which at a given number of gravitational radii or a given orbital speed (e.g., the speed characteristic of the broad line region) is the same for any mass, hence Compton up scattering could produce a characteristic spectrum that is independent of mass. Therefore, coronal effects may contribute to the soft excess. However, the main argument against this scenario is that the virial temperatures corresponding to broad line region velocities (a few km s-1) are much too high (a few keV) to produce the soft excess.
The multi-source fitting has demonstrated that all the models discussed have difficulties explaining all the properties of the soft excess emission.
5 The Multi-wavelength Properties of the QUEST ULIRGs and PG QSOs
5.1 FIR Classes of PG QSOs
Netzer et al. (2007) separated PG QSOs into two different FIR classes, strong and weak FIR emitters, based on the 60-to-15 m luminosity ratio. The authors found that both types of QSOs have similar underlying AGN spectral energy distributions (SEDs) in the infrared ( 1 m). We find that this statement seems also valid in the X-rays: The appears to be no correlation with the FIR strength with the AGN contribution to the infrared luminosity (Figure 4). The C06 models suggest that the strong FIR-emitters have softer spectra (due to the possible contribution from a starburst to the 0.5–2 keV band) than the weak FIR-emitters, but these models are not favored for the reasons discussed in § 4.2.
5.2 AGN Contribution to the Bolometric Luminosity
V09a presented six independent mid-infrared methods for determining the AGN contribution to the overall bolometric luminosity of ULIRGs and QSOs as part of the Spitzer-QUEST study. The details of the methods are presented in the Appendix of V09a and not repeated here. Since the hard X-ray emission is dominated by the AGN (assuming no Compton-thick sources), we use the ratio of the absorption-corrected 2–10 keV luminosity to the bolometric luminosity as a proxy for the AGN contribution to the bolometric luminosity and compare the results with those derived by V09a. The results on the QSOs and ULIRGs are presented in Figure 11.
Figure 11 shows a positive correlation between the Spitzer-derived AGN contribution and the absorption-corrected 2–10 keV to bolometric luminosity ratio, although considerable scatter is evident in the relation. Note also that the range of hard X-ray to bolometric luminosity ratios is considerably broader than the range of Spitzer-derived AGN contributions. The Spitzer results are likely more uncertain in objects with intermediate and high (as discussed in V09a), but Figure 11 shows no link between and the discrepancy between the Spitzer and X-ray results. We discuss two possible causes for this discrepancy, aside from the obvious and likely possibility of real intrinsic variations in the hard X-ray to bolometric luminosity ratio among pure AGN (see Figure 11 of Lusso et al., 2010; Just et al., 2007).
5.2.1 Zero-point Calibrations
One potential source of uncertainty is the definitions of the zero-points for the mid-infrared methods in V09a. The pure-AGN zero points were derived from the FIR-undetected PG QSOs. Following Netzer et al. (2007), the lack of FIR detection was assumed to indicate a lack of starburst in these objects. As discussed in Netzer et al. (2007), this assumption is likely accurate to 10-30% and thus cannot account for the substantially larger discrepancies between the X-ray and mid-infrared methods. The pure-starburst zero points were derived from HII ULIRGs, which are known to be different in terms of gas density and radiation fields from less luminous, optically-selected starbursts. For instance, the micron flux ratios and the 7.7 micron PAH equivalent widths derived by Brandl et al. (2006) for a sample of optically-selected starburst nuclei are lower than those found in the HII ULIRGs. If we were to use the Brandl et al. (2006) values as the pure-starburst zero points, then the estimated AGN contributions from the mid-infrared data would be systematically reduced, but this still could not explain the very broad range in hard X-ray to bolometric luminosity ratio observed among ULIRGs and QSOs.
5.2.2 A Matter of Obscuration
A more likely explanation for the discrepancy between the two methods is related to the fact that the hard X-ray and mid-infrared observations probe very different regions of the AGN. The hard X-rays represent direct or reflected emission from the accretion disk of the black hole or from material near it. The X-ray source occupies a small volume, on the scale of less than a parsec. In contrast, the mid-infrared diagnostic method of measuring AGN emission relies on the detection of high-ionization fine-structure line or PAH emission which is produced from a larger volume (tens to hundreds of parsecs). Thus, the mid-infrared emitting region is less likely to be affected by obscuration than the central X-ray emitting region. The broad range in hard X-ray to bolometric luminosity ratio may be due to unsuspected obscuration that is not correlated with the mid-infrared extinction measured on a larger scale (Figures 4 and 11). Both Chandra and XMM-Newton operate at 0.5–10 keV, below the peak of the Compton reflection hump, the detection of which can better constrain the absorbing column. Mrk 273 is a good case in point. Teng et al. (2009) had a marginal detection of Mrk 273 above 10 keV with Suzaku. The simultaneous modeling of the Suzaku, Chandra, and XMM-Newton spectra found that the source is highly obscured. The absorption corrected 2–10 keV luminosity with the Suzaku data is times that derived from Chandra or XMM-Newton data alone. Mrk 273 is also one of the sources that exhibits moderate extinction from the mid-infrared data (). This is a change of about half an order of magnitude or % in AGN percentage (Figure 4). Mrk 231 is another, more extreme, example: The detection of hard X-rays above 10 keV by Braito et al. (2004) boosted the absorption-corrected hard X-ray luminosity by more than an order of magnitude, bringing it to a value consistent with that of powerful QSOs. In summary, the absorption-corrected hard X-ray luminosities of ULIRGs and, to a lesser extent, QSOs are uncertain, so it is not inconceivable that the very broad range of hard X-ray to bolometric luminosity ratios of ULIRGs and QSOs is due at least in part to unsuspected obscuration of the hard X-ray source.
5.3 Trends with Merger Phase
While the hard X-ray to bolometric luminosity ratio may not be an accurate absolute measure of the AGN contribution to the bolometric luminosity of ULIRGs and QSOs, trends of this ratio within these classes of objects may provide useful relative information.
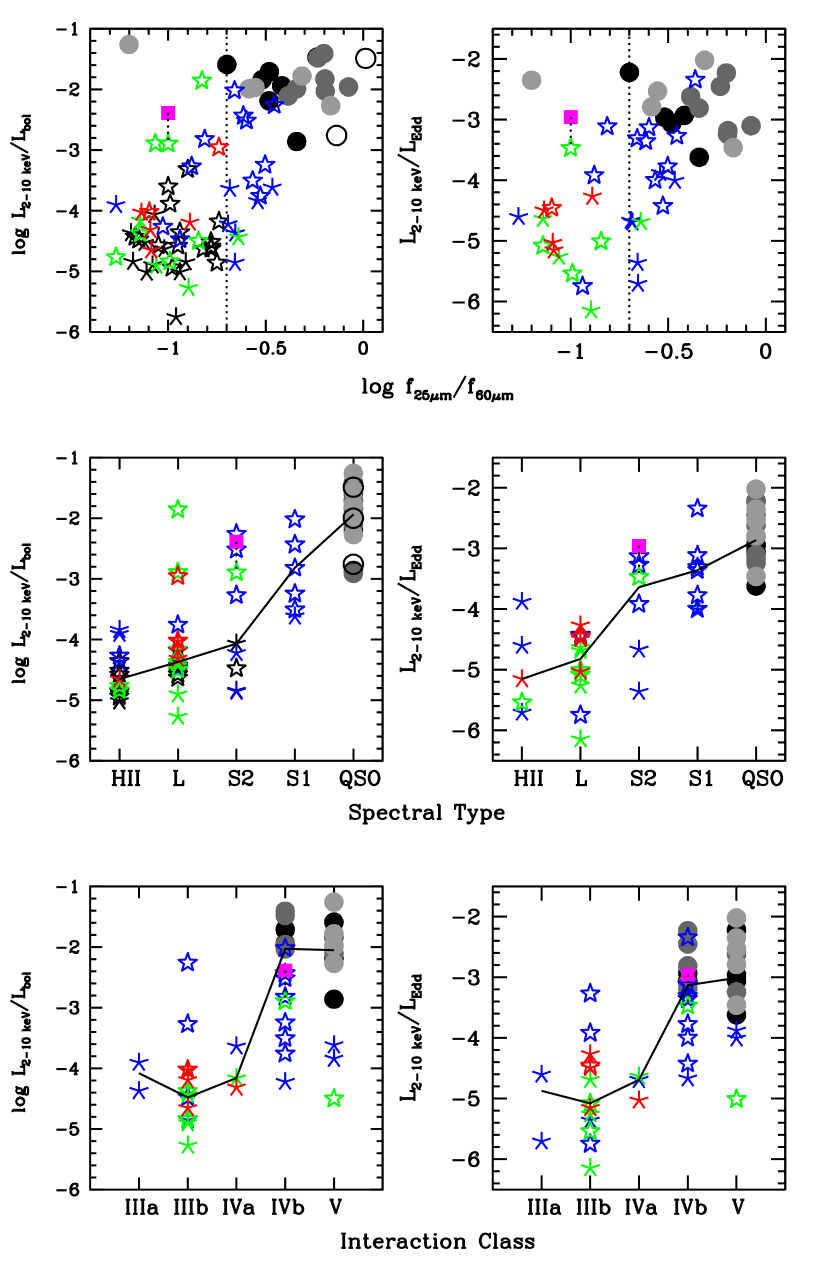
In the evolutionary scenario of Sanders et al. (1988), starburst-dominated “cool” U/LIRGs evolve into AGN-dominated “warm” ULIRGs and then eventually optically selected quasars. In this scenario, the AGNs turn on only near the end of the merging process. The recent Spitzer results of V09a have brought some support to this scenario. The X-ray data also seem to be largely consistent with this picture. The top panel of Figure 12 supports previous arguments that “warm” (“cool”) objects like Seyfert 1 ULIRGs and PG QSOs (HII and LINER ULIRGs) are AGN-dominated (starburst-dominated). ULIRGs with intermediate infrared colors also have intermediate hard X-ray to bolometric luminosity ratios. This supports the idea that the cool, starburst-dominated, and obscured objects evolve to become warm, AGN-dominated, “naked” quasars.
The middle panels of Figure 12 demonstrate that the more X-ray luminous AGN are more likely to be sources optically classified as either a QSO or a Seyfert galaxy. The HII ULIRGs have the lowest hard X-ray to bolometric luminosity ratios on average, as expected. The LINER ULIRGs show the broadest range of 2–10 keV to bolometric luminosity ratios, suggesting that the energy source of infrared-selected LINERs is a wide mixture of AGN and starburst (Sturm et al., 2006; Veilleux et al., 2009a). The very low in some ULIRGs may be a sign of unsuspected large X-ray absorptions.
Veilleux et al. (2002) defined interaction classes (IC) for merging systems where class I are systems on their first approach. The galaxies are unperturbed, with no evidence of tidal features. The IC II represents sources that are in the first-contact phase of the interaction where strong bars or tidal tails have yet to be formed. The pre-merger stage, or IC III, consists of systems that show identifiable binary nuclei and strong tidal features such as tails and bridges. This class is further divided into two sub-categories: IC IIIa are sources that are wide binaries where the nuclei are 10 kpc (projected) apart and IC IIIb are sources that are close binaries where the nuclei are 10 kpc (projected) apart. IC IV represents the merger stage of the interaction. These sources have prominent tidal tails. The sub-category of IVa (diffuse mergers) includes sources that have diffuse central regions whereas IVb (compact mergers) includes sources that are dominated by a single nucleus. The division between IVa and IVb represents the difference between binary and single nucleus objects. Finally, IC V is synonymous with old mergers. These sources do not have strong tidal features, but their central morphologies are disturbed, similar to those of objects in IC IV. Therefore, the sequence of IC I–V represents the complete merging sequence of galaxy systems. It is of note that almost all 1-Jy ULIRGs are classified as IC III–V (moderate age mergers) and the PG QSOs as IC IVb–V (old mergers).
The bottom panels of Figure 12 suggest that AGN activity is often most dominant in coalesced remnants corresponding to the latest stage of the merger – IVb and V. The steep increase of AGN dominance between classes IIIa/b (early stages of the merger) and IV/V suggests that black hole growth picks up in the post-merger phase of the interaction, as found in the Spitzer data. The scatter among each interaction class indicates that stochastic events may trigger nuclear activity at any time along the merger sequence. However, the likelihood of finding AGN-dominated U/LIRGs increases along the merger sequence and in objects with warmer infrared colors ().
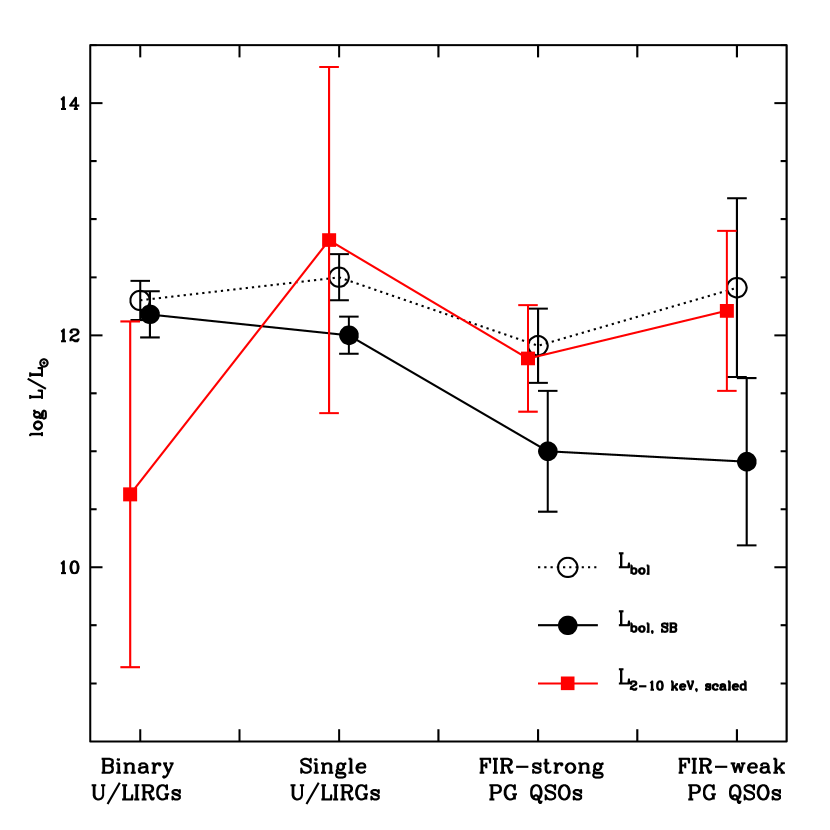
It is interesting to compare these results with the predictions of recent numerical simulations (e.g., Hopkins et al., 2008, and references therein). These models suggest that the starburst dominates the total luminosity prior to and during the merger (phase D of Hopkins et al., 2008). After coalescence, the central black hole in these simulations grows rapidly before the “blowout” phase (phase E) where an AGN-driven wind is purported to expel the remaining dust and gas, removing material for both accretion and star formation. The result is a luminous, blue quasar with little star formation (phase F). The accretion rate of the active nucleus is predicted to peak between phases D and E. Then the luminosity of the quasar fades during the post-blowout quasar stage. For comparison, Figure 13 shows the evolution of the AGN luminosity along the final stages of the merger sequence derived from the mid-infrared and X-ray data. The data indicate that star formation peaks prior to the coalescence of the nuclei, while the accretion rate onto the black hole increases rapidly to peak at coalescence. There is no significant change in the quasar luminosity after coalescence. The fading of the quasar must happen after the epoch covered by the QUEST sample of QSOs. The purported galactic-scale winds in these simulations are observed in several QUEST ULIRGs (e.g., Rupke et al., 2005a, b; Veilleux et al., 2005, and references therein).
6 Summary
We have performed an uniform analysis of X-ray data on 40 ULIRGs and 26 PG QSOs from the QUEST sample. New and archival observations obtained using Chandra and XMM-Newton were used for this study. The X-ray results were compared with those recently derived from Spitzer IRS spectra. The major conclusions are as follows:
-
1.
By fitting the PG QSO spectra simultaneously, we favor a reflection-based model with = 2.37 0.02 and a black-body component with keV to account for the ubiquitous soft excess. The best-fit universal model indicates that the soft excess luminosity/flux is linearly related to the 0.5–10 keV absorption-corrected power-law luminosity/flux. This implies that the source of the soft excess is directly related to accretion onto the central black hole, rather than an external factor such as intervening absorption. An absorption edge at 0.68 0.01 keV with optical depth of 0.31 is required for the universal spectral model to fit the QSO spectra as a class. This edge is consistent with the atomic transitions of O VII and O VIII.
-
2.
There does not appear to be any correlation between the FIR emission strength of the QSOs and the 2–10 keV to bolometric luminosity ratio. This extends to the X-rays the conclusion of Netzer et al. (2007) that there is no obvious difference in the underlying infrared AGN SED of strong and weak FIR emitting PG QSOs.
-
3.
Using the absorption-corrected hard X-ray luminosity as a proxy for the AGN contribution to the bolometric luminosity in these systems, we find results that generally agree qualitatively with those from V09a. The ratio of absorption-corrected hard X-ray to bolometric luminosity is not an accurate absolute measure of the AGN contribution to the bolometric luminosity of ULIRGs and QSOs, but trends of this ratio within these classes of objects provide useful relative information. The likelihood of powerful nuclear activity increases along the merger sequence and in objects with warmer dust temperatures and AGN optical signatures. The scatter in these trends is likely due to stochastic accretion events, unsuspected X-ray absorption, or variations in the intrinsic hard X-ray to bolometric luminosity ratio of pure AGNs.
-
4.
The bolometric luminosity of the AGN in U/LIRGs and PG QSOs evolve with merger stage. The starburst seems to dominate the total power prior to the merger. Then the accretion rate onto the black hole increases rapidly during coalescence at which point the AGN dominates the bolometric luminosity. The predictions from numerical simulations are largely consistent with these results.
References
- Armus et al. (2007) Armus, L., et al. 2007, ApJ, 656, 148
- Arnaud et al. (1985) Arnaud, K.A., et al. 1985, MNRAS, 217, 105
- Bianchi et al. (2008) Bianchi, S., Guainazzi, M., Matt, G., Fonseca Bonilla, N., & Ponti, G. 2009, A&A, 495, 421
- Blain et al. (2002) Blain, A.W., Smail, I., Ivison, R.J., Kneib, J.-P., & Frayer, D.T., 2002, Phys. Rep., 369, 111
- Braito et al. (2004) Braito, V. et al. 2004, A&A, 420 79
- Brandl et al. (2006) Brandl, B.R. et al. 2006, ApJ, 653, 1129
- Cash (1978) Cash, W.C. 1979, ApJ, 228, 939
- Condon et al. (1990) Condon, J.J. et al. 1990, ApJS, 73, 359
- Crummy et al. (2006) Crummy, J., Fabian, A.C., Gallo, L., & Ross, R.R. 2006, MNRAS, 365, 1067 (C06)
- Daddi et al. (2007) Daddi, E. et al. 2007, ApJ, 670, 156
- Dasyra et al. (2006a) Dasyra, K.M. et al. 2006a, ApJ, 638, 745
- Dasyra et al. (2006b) Dasyra, K.M. et al. 2006b, ApJ, 651, 835
- Dasyra et al. (2007) Dasyra, K.M. et al. 2007, ApJ, 657, 102
- Dekel & Birnboim (2006) Dekel, A. & Birnboim, Y., 2006, MNRAS, 368, 2
- Dickey & Lockman (1990) Dickey & Lockman, 1990, ARAA, 28, 215
- Evans et al. (2001) Evans, A.S. et al. 2001, AJ, 121, 1893
- Förster Schreiber et al. (2009) Förster Schreiber, et al. 2009, ApJ, 706, 1364
- Franceschini et al. (2003) Franceschini, A. et al. 2003, MNRAS, 343, 1181
- George et al. (1998) George, I.M. et al. 1998, ApJ, 503, 174
- Ghisellini et al. (1994) Ghisellini, G., Harrdt, F., & Matt, G. 1994, MNRAS, 267, 743
- Gierlinski & Done (2004) Gierlinski, M. & Done, C. 2004, MNRAS, 349, L7
- Iwasawa & Taniguchi (1993) Iwasawa, K. & Taniguchi, Y. 1993, ApJ, 413L, 15
- Hopkins et al. (2005) Hopkins, P.F. et al. 2005, ApJ, 630, 705
- Hopkins et al. (2006) Hopkins, P.F. et al. 2006, ApJS, 163, 1
- Hopkins et al. (2008) Hopkins, P.F. et al. 2008, ApJS, 175, 356
- Jester et al. (2005) Jester, S. et al. 2005, AJ, 130, 873
- Just et al. (2007) Just, D.W. et al. 2007, ApJ, 665 1004
- Kennicutt (1998) Kennicutt, R. C. 1998, ARA&A, 36, 189
- Kim et al. (2002) Kim et al. 2002, ApJS, 143, 277
- Kraemer et al. (2005) Kraemer, S.B. et al. 2005, ApJ, 633, 693
- Krolik et al. (1994) Krolik, J.H., Madau, P., & Zycki, P.T. 1994, ApJ, 420, L57
- Laor (1991) Laor, A. 1991, ApJ, 376, 90
- Li et al. (2007) Li. Y. et al. 2007, ApJ, 665, 187
- Li et al. (2008) Li. Y. et al. 2008, ApJ, 678, 41
- Lusso et al. (2010) Lusso, E. et al. 2010, A&A, 512, 34
- Marconi & Hunt (2003) Marconi, A., & Hunt, L.K. 2003, ApJ, 589, L21
- Miller et al. (2006) Miller, B.P. et al. 2006, ApJ, 652, 163
- Murray et al. (2005) Murray, N., Quataert, E., & Thompson, T.A. 2005, ApJ, 618, 569
- Nagar et al. (2003) Nagar, N.M. et al. 2003, A&A, 409, 115
- Netzer et al. (2007) Netzer et al. 2007, ApJ, 666, 806
- Persic et al. (2004) Persic, M. et al. 2004, A&A, 419, 849
- Piconcelli et al. (2004) Piconcelli, E. et al. 2004, MNRAS, 351, 161 (P05)
- Piconcelli et al. (2005) Piconcelli, E. et al. 2005, A&A, 432, 15
- Porquet et al. (2004) Porquet, D., Reeves, J.N., O’Brien, P., & Brinkmann, W. 2004, A&A, 422, 85
- Protassov et al. (2002) Protassov, R. et al. 2002, ApJ, 571, 545
- Ptak et al. (2003) Ptak, A., Heckman, T., Levenson, N.A., Weaver, K., & Strickland, D. 2003, ApJ, 592, 782
- Ranalli et al. (2003) Ranalli, Pl, Comastri, A., & Setti, G. 2003, A&A, 399, 39
- Reynolds (1997) Reynolds, C.S. 1997, MNRAS, 286, 513
- Rupke et al. (2005a) Rupke, D. S. N., Veilleux, S., & Sanders, D. B. 2005a, ApJS, 160, 115
- Rupke et al. (2005b) Rupke, D. S. N., Veilleux, S., & Sanders, D. B. 2005b, ApJ, 632, 751
- Sanders et al. (1988) Sanders, D.B. et al. 1998, ApJ, 328, L35
- Sanders & Mirabel (1996) Sanders, D.B. & Mirabel, I.F. 1996, ARAA, 34, 749
- Sanders et al. (2003) Sanders D.B. et al. 2003, AJ, 126, 1607
- Schurch et al. (2009) Schurch, N.J., Done, C., & Proga, D., 2009, ApJ, 694, 1
- Schweitzer et al. (2006) Schweitzer et al. 2006, ApJ, 649, 79
- Schweitzer et al. (2008) Schweitzer et al. 2008, ApJ, 679, 101
- Shapiro et al. (2008) Shapiro, K. et al. 2008, ApJ, 682, 231
- Sobolewska & Done (2007) Sobolewska, M.A. & Done, C. 2007, MNRAS, 374, 150
- Sturm et al. (2006) Sturm et al. 2006, ApJ, 652, L13
- Surace et al. (2001) Surace, J.A., Sanders, D.B., & Evans, A.S. 2001, AJ, 122, 2791
- Tacconi et al. (2008) Tacconi, L.J. et al. 2008, ApJ, 680, 246
- Teng et al. (2005) Teng, S.H. et al. 2005, ApJ, 633, 664
- Teng et al. (2008) Teng, S.H. et al. 2008, ApJ, 674, 133
- Teng et al. (2009) Teng, S.H. et al. 2009, ApJ, 691, 261
- Tremaine et al. (2002) Tremaine, S. et al. 2002, ApJ, 574, 740
- Turner et al. (2005) Turner, T.J. et al. 2005, ApJ, 618, 155
- Veilleux et al. (2002) Veilleux, S., Kim, D.C., & Sanders, D.B. 2002, ApJS, 143, 315
- Veilleux et al. (2005) Veilleux, S., Cecil, G., & Bland-Hawthorn, J. 2005, ARAA, 43, 769
- Veilleux et al. (2006) Veilleux, S. et al. 2006, ApJ, 643, 707
- Veilleux et al. (2009a) Veilleux, S. et al. 2009a, ApJS, 182, 628 (V09a)
- Veilleux et al. (2009b) Veilleux, S. et al. 2009b, ApJ, 701, 587
- Winter et al. (2009) Winter, L.M. et al. 2009, ApJ, 690, 1322
APPENDIX A — The Reliability of the Hardness Ratio Method
As discussed in § 3.2, U/LIRGs are notoriously difficult to observe in the X-ray. Most of these objects are faint, either due to the lack of an AGN or the presence of heavy obscuration. Traditional spectral fitting cannot be used to model the complex spectra of these sources when counts are limited. The hardness ratio method developed in Teng et al. (2005) has proven to be effective in finding obscured AGNs in at least one case. IRAS F04103–2838 was found to contain both a starburst and an AGN with only 30 detected counts in a 10 ksec Chandra observation. A deeper (20 ksec) XMM-Newton follow-up revealed an Fe K line at rest-frame energy of 6.5 keV, consistent with cold neutral iron (Teng et al., 2008). The hard X-ray emission is dominated by a nearly Compton-thick AGN with intrinsic 0.2–10 keV luminosity 1043-44 ergs s-1.
Since the detected counts of the majority of objects in the U/LIRG surveys are low, the errors associated with the HR method are inherently large. To further test the reliability of the HR method in recovering the input spectrum, we have performed a set of simulations. In these simulations, we set the input model of an unabsorbed AGN at 0.1 as a redshifted power law with at 1.8 (the canonical value for AGNs) absorbed by a Galactic column of cm-2. The normalization of the input power law model was such that the model 0.5–10 keV flux is ergs s-1 cm-2, the mean value observed in faint U/LIRGs.
We first tested the dependence of the HR method on the number of detected counts by varying the exposure times in the simulations. For each exposure time tested, the average of 1000 simulations showed that the nominal and the 0.5–2 keV and 2–10 keV flux values are remarkably stable even when the “detected” counts were reduced to as low as 30 (a 5 ksec exposure). On average, the output determined from the HR method remained the same as the input, but the error bars increased as the number of detected counts decreased. The nominal 0.5–2 and 2–10 keV fluxes are within 1% of those from the input model. The top portion of Table 11 summarizes these results.
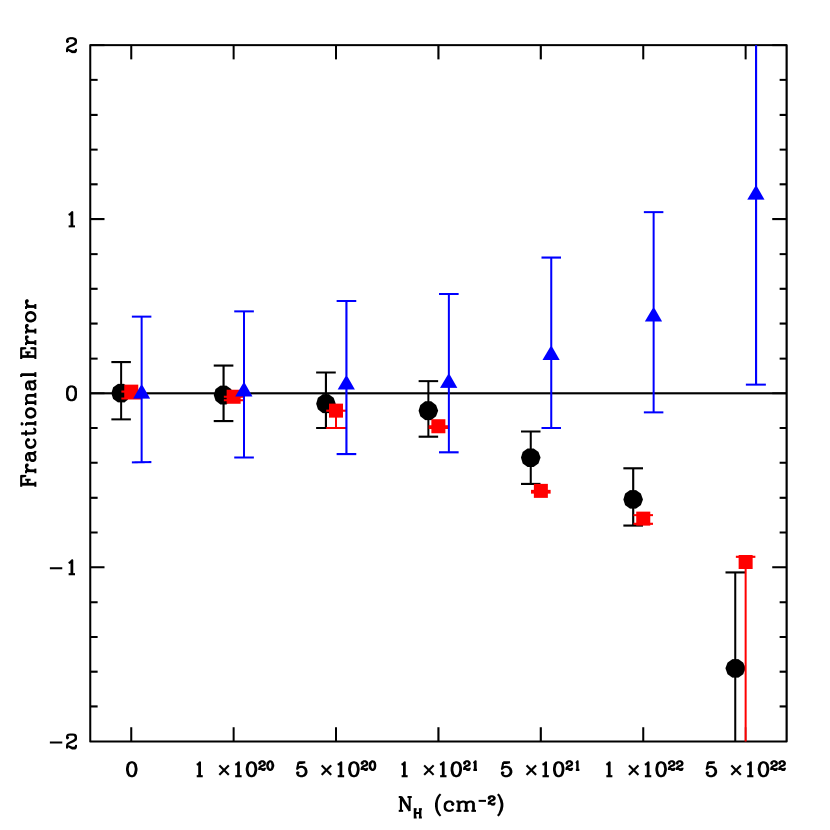
In the HR method, we assumed that the only absorption is from the Galaxy, but this is not the case for the U/LIRGs we observe. The internal absorption in these objects are often high. Therefore, we also tested the dependence of the HR method on the intrinsic absorption of the source. To this end, we added intrinsic source absorption to the input spectrum. For 15 ksec exposures, we varied the intrinsic source absorption between 1020-22 cm-2 by steps of cm-2 to see how the measured spectral parameters using the HR method are affected. Figure 14 shows the results of these simulations. As the internal column increases, the photon index becomes flatter and then inverted (). begins to become inverted when the column is cm-2 as seen in the bottom portion of Table 11. Since the 0.5–2 keV flux is more readily affected by absorption, it deviates from the input spectrum by more than 10% when the absorption is at only cm-2. On the other hand, the 2–10 keV flux is more stable, but begins to deviate from the input spectrum when the absorption is high enough that becomes inverted. Of course, if the source has a softer spectrum (e.g., containing a commonly seen soft-excess component), then it would require a higher column for the spectrum to become inverted.
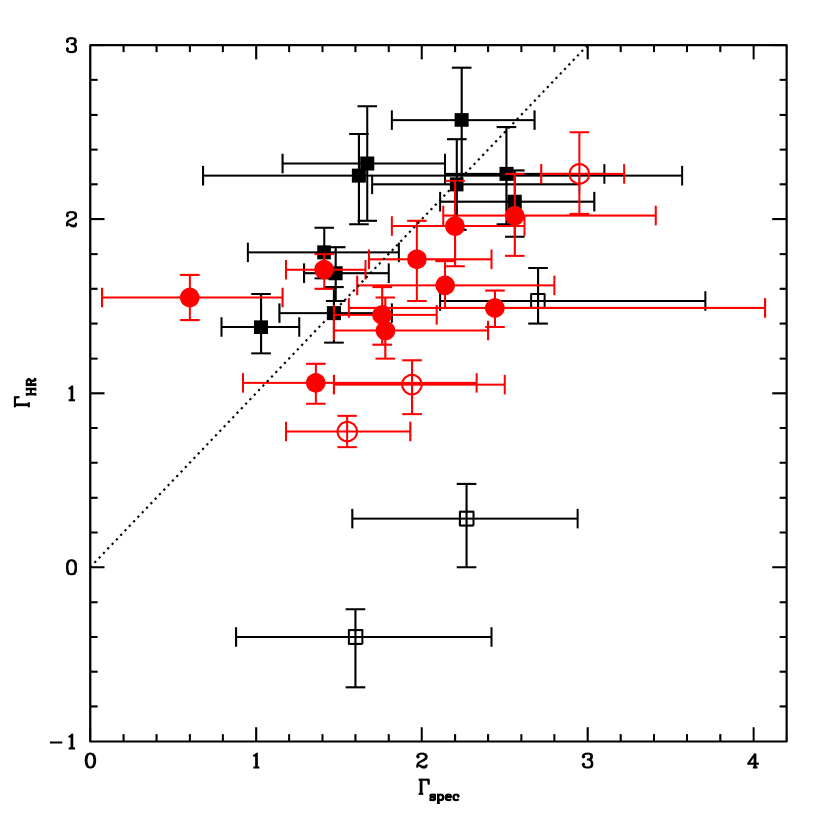
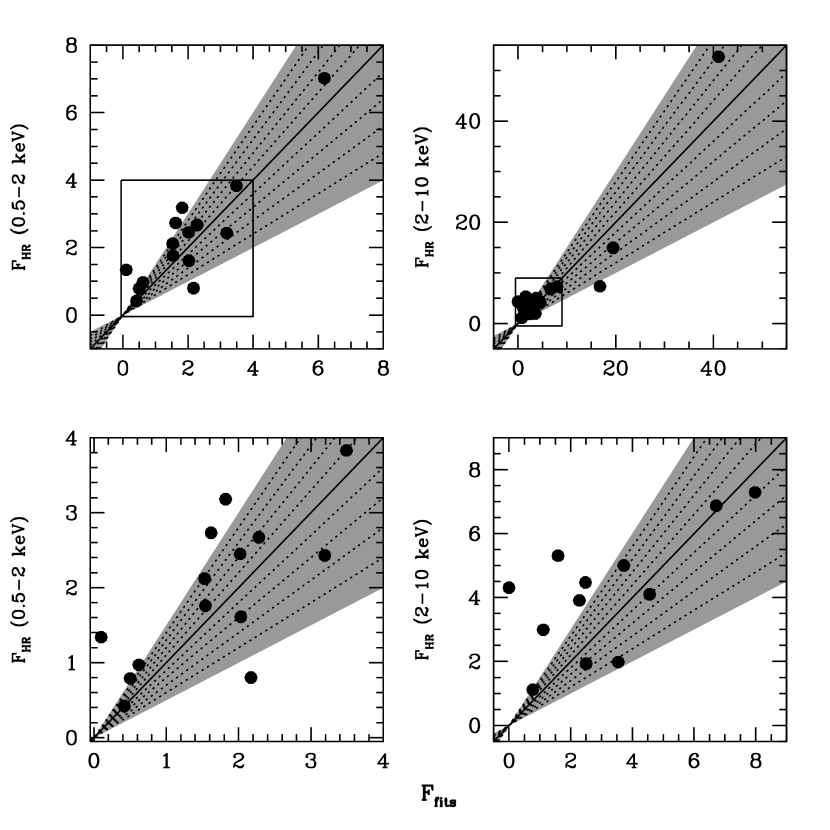
One of the important usages of the HR method is to estimate the photon index of the X-ray spectrum which in turn gives estimates of the 0.5–2 and 2–10 keV fluxes of our targets. The spectral index is the parameter that is the basis for the flux estimates. As shown by the simulations, the accuracy of based on the HR method depends on the intrinsic absorption of the source. Figure 15 compares the derived from the HR method and the traditional method for the moderately bright U/LIRGs in § 3.2 and in the archived Chandra sample discussed in Appendix B. The figure shows that our measurements from the two methods are consistent with each other unless the intrinsic column densities are cm-2, in agreement with the simulations. The next consideration is to see how well the estimated fluxes from the HR method match those of the traditional method. We have plotted in Figure 16 the 0.5–2 keV and 2–10 keV fluxes derived from both the HR and the traditional fitting method with more complex spectral models for the moderately bright U/LIRGs in § 3.2. As the figure shows, the majority of the HR flux values from a simple unabsorbed power law model are within 50% of the spectral fitting values of more complex models. The HR method is more likely to overestimate the fluxes in both the soft and hard bands. The medians values for are approximately 1.2 and 1.3 for the soft and hard bands, respectively.
As Teng et al. (2009) and other authors have demonstrated, the X-ray spectra of U/LIRGs are often more complex than a simple power law model can characterize. We further tested the HR method by assuming that the input model contains a reflection component or that the intrinsic absorption is due to a partial covering absorber. The addition of a reflection or a partial covering component flattens the AGN power law spectrum, mimicking the effects of high intrinsic absorption. For an intrinsic absorption of cm-2, the HR method recovers the input flux very well for both the reflection and partial covering models777The reflection model assumes a power law plus a PEXRAV component. The normalization of the reflected component is set to 2% of the intrinsic power law component as measured in the complex Suzaku spectrum of IRAS F05189–2524 (Teng et al., 2009). The photon index of the power law spectrum is fixed at 1.8 and the recovered is 0.70. For the partial covering model, the covering factor is assumed to be 90%, similar to that found in Mrk 273 (Teng et al., 2009). In this case, the input is again fixed at 1.8 and the HR estimate of is 0.91.. In fact, for both models, the recovered 0.5–2 keV fluxes are within 2% of the input model flux. On the other hand, the HR estimates of the 2–10 keV fluxes are above the input values by 56.4 and 35.3% for the reflection and partial covering models, respectively. These errors are comparable to or better than the estimates obtained for the simple power law model at the same column density (Table 11). Therefore, even for objects with complex spectra, the HR method is able to provide fair approximations of their spectral properties.
| Galaxy | log() | Type | IC | NS | N | Ref | |
|---|---|---|---|---|---|---|---|
| (1) | (2) | (3) | (4) | (5) | (6) | (7) | (8) |
| ULIRGs | |||||||
| F000910738 | 0.118 | 12.36 | HII | IIIb | 2.31 | 3.23 | 1 |
| F001880856 | 0.128 | 12.43 | L | V | 0.34 | 3.21 | 2 |
| F004562904:SW | 0.110 | 12.29 | HII | IIIa | 22.80 | 1.68 | 1 |
| F010042237 | 0.118 | 12.36 | HII | V | 0.32 | 1.58 | 2 |
| F011660844:SE | 0.118 | 12.15 | HII | IIIb | 10.78 | 4.67 | 1 |
| PG0157001 | 0.163 | 12.69 | S1 | IVb | 0.42 | 2.56 | 2, 3, 4 |
| F020212103 | 0.116 | 12.13 | none | IVa | 0.32 | 1.55 | 1 |
| IRAS035210028 | 0.152 | 12.62 | L | IIIb | 3.86 | 12.5 | 2 |
| F041032838 | 0.117 | 12.30 | L | IVb | 0.32 | 2.45 | 2, 5 |
| F050241941 | 0.192 | 12.43 | S2 | IIIb | 3.29 | 3.78 | |
| F051892524 | 0.043 | 12.22 | S2 | IVb | 0.13 | 1.92 | 6, 7, 8 |
| F075986508 | 0.148 | 12.58 | S1 | IVb | 0.39 | 4.32 | 7 |
| F085723915 | 0.058 | 12.22 | L | IIIb | 5.65 | 2.60 | 8 |
| F090390503 | 0.125 | 12.16 | L | IVa | 0.34 | 3.94 | 1 |
| UGC 5101 | 0.039 | 12.05 | L | 0.12 | 2.67 | 6 | |
| F095390857 | 0.128 | 12.13 | L | V | 0.34 | 3.08 | |
| F101901322:W | 0.077 | 12.09 | HII | IIIb | 5.97 | 3.78 | 2 |
| F101901322:E | 0.076 | 12.09 | L | IIIb | 5.92 | 3.78 | 2 |
| F105652448 | 0.043 | 12.11 | HII | 6.80 | 1.54 | ||
| F110950238 | 0.107 | 12.32 | L | IIIb | 1.03 | 4.52 | 1 |
| F111193257 | 0.189 | 12.67 | S1 | IVb | 3.16 | 2.15 | |
| F112231244:W | 0.199 | 12.64 | S2 | IIIa | 97.85 | 4.98 | |
| F120720444 | 0.128 | 12.45 | S2 | IIIb | 2.25 | 3.32 | 2 |
| F121120305 | 0.073 | 12.38 | L | IIIb | 4.18 | 1.75 | 2, 10 |
| 3C 273 | 0.158 | 12.76 | S1 | IVb | 0.41 | 1.79 | 3 |
| Mrk 231 | 0.042 | 12.60 | S1 | IVb | 0.12 | 1.26 | 6, 9 |
| F132180552 | 0.205 | 12.68 | S1 | V | 0.50 | 2.26 | |
| Mrk 273 | 0.038 | 12.24 | S2 | IVb | 0.75 | 1.09 | 6, 8, 9 |
| F134511232 | 0.122 | 12.36 | S2 | IIIb | 6.57 | 1.90 | 7, 8 |
| F143481447 | 0.083 | 12.42 | L | IIIb | 5.45 | 7.83 | 9, 10 |
| F151301958 | 0.109 | 12.23 | S2 | IVb | 0.30 | 8.60 | 2 |
| F152503608 | 0.055 | 12.12 | L | 0.16 | 1.56 | 2, 9 | |
| Arp 220 | 0.018 | 12.26 | L | IIIb | 0.33 | 4.27 | 6, 8 |
| F154620450 | 0.100 | 12.28 | S1 | IVb | 0.28 | 9.91 | 1 |
| F160900139 | 0.134 | 12.61 | L | IVa | 2.37 | 9.25 | 2 |
| NGC 6240 | 0.024 | 11.91 | L | 0.74 | 5.78 | 6 | |
| F172080014 | 0.043 | 12.50 | HII | 0.13 | 9.96 | 2, 6, 9 | |
| F212080519:N | 0.130 | 12.12 | HII | IIIa | 15.53 | 5.13 | 1 |
| F213292346 | 0.125 | 12.21 | L | IIIb | 2.62 | 3.75 | 1 |
| F224911808 | 0.078 | 12.25 | HII | IIIb | 2.36 | 2.69 | 9, 10 |
| F232340946 | 0.128 | 12.21 | L | IIIb | 8.14 | 2.76 | 1 |
| PG QSOs | |||||||
| PG0050124 | 0.061 | 12.07 | S1 | IVb | 0.18 | 4.99 | 3, 4 |
| PG0804761 | 0.100 | 12.08 | S1 | 2.98 | 3 | ||
| PG0838770 | 0.131 | 11.76 | S1 | IVb | 0.35 | 2.09 | 11 |
| PG0844349 | 0.064 | 11.44 | S1 | IVb | 0.18 | 3.29 | 3, 4 |
| PG0953414 | 0.234 | 12.52 | S1 | 1.14 | 3, 4 | ||
| PG1001054 | 0.161 | 11.86 | S1 | V | 0.41 | 2.39 | 3 |
| PG1004130 | 0.240 | 12.68 | S1 | 3.70 | |||
| PG1116215 | 0.176 | 12.54 | S1 | V | 0.45 | 1.28 | 3, 4 |
| PG1126041 | 0.060 | 11.52 | S1 | V | 0.17 | 4.30 | |
| PG1211143 | 0.081 | 11.96 | S1 | 2.75 | 3, 4 | ||
| PG1229204 | 0.063 | 11.56 | S1 | V | 0.18 | 2.21 | |
| PG1244026 | 0.048 | 11.02 | S1 | 1.75 | 3, 4 | ||
| PG1307085 | 0.155 | 12.34 | S1 | V | 0.40 | 2.11 | 3, 4 |
| PG1309355 | 0.184 | 12.31 | S1 | V | 0.46 | 1.03 | 3, 4 |
| PG1351640 | 0.088 | 12.04 | S1 | 2.15 | |||
| PG1411442 | 0.090 | 11.78 | S1 | IVb | 0.25 | 1.15 | 3 |
| PG1426015 | 0.086 | 11.92 | S1 | IVb | 0.24 | 2.83 | |
| PG1435067 | 0.126 | 11.91 | S1 | V | 0.34 | 5.34 | 11 |
| PG1440356 | 0.079 | 11.80 | S1 | V | 0.22 | 1.03 | 3, 4 |
| PG1448273 | 0.065 | 11.43 | S1 | 2.44 | |||
| PG1501106 | 0.036 | 11.33 | S1 | 2.34 | 3, 4 | ||
| PG1613658 | 0.129 | 12.29 | S1 | IVb | 0.35 | 2.87 | 3 |
| PG1626554 | 0.133 | 11.83 | S1 | V | 0.35 | 1.91 | 3 |
| PG2130099 | 0.063 | 11.77 | S1 | IVb | 0.18 | 4.64 | |
| B2 220131A | 0.295 | 13.27 | S1 | V | 0.66 | 11.8 | 11 |
| PG2214139 | 0.066 | 11.77 | S1 | V | 0.19 | 4.96 | 3 |
References. — 1 = Chandra AO 10 object; 2 = Teng et al. 2005; 3 = Piconcelli et al. 2005; 4 = Crummy et al. 2006; 5 = Teng et al. 2008; 6 = Ptak et al. 2003; 7 = Imanishi 2004; 8 = Teng et al. 2009; 9 = Franceschini et al. 2003; 10 = Sanders et al. (2003); 11 = XMM-Newton AO 7 object
Note. — Col.(1): Galaxy name. Coordinate-based names beginning with ”F” are sources in the IRAS Faint Source Catalog. Col.(2): Redshift. Col.(3): Bolometric luminosity. For ULIRGs, we assume . For PG QSOs, we assume (see Netzer et al., 2007, for details on ). Col.(4): Optical spectral type, from Veilleux et al. (1995, 1999a) and Rupke et al. (2005a). Col.(5): Interaction class, from Veilleux et al. 2002, Veilleux et al. 2006, or Veilleux et al. 2009 (in order of preference). Col.(6): Nuclear separation, in kpc. Col.(7): Galactic column density from Dickey and Lockman (1990) in units of 1020 cm-2. Col.(8): References for X-ray data.
| Galaxy | Date | Telescope | Obs ID | PI | Exposure |
|---|---|---|---|---|---|
| (1) | (2) | (3) | (4) | (5) | (6) |
| ULIRGs | |||||
| F000910738 | 2008 November 1 | CXO | 70188510342 | Veilleux | 15.2 |
| F001880856 | 2003 September 4 | CXO | 7007814102 | Wilson | 9.8 |
| 2004 December 20 | XMM | 0200630201 | Imanishi | 38.0 | |
| F004562904:SW | 2009 May 22 | CXO | 70188610343 | Veilleux | 15.1 |
| F010042237 | 2003 August 3 | CXO | 7007824103 | Wilson | 9.4 |
| F011660844:SE | 2008 October 31 | CXO | 70188710344 | Veilleux | 15.8 |
| PG0157001 | 2000 July 29 | XMM | 0101640201 | Aschenbach | 4.5 |
| 2003 August 23 | CXO | 7007834104 | Wilson | 10.6 | |
| F020212103 | 2009 July 16 | CXO | 70188810345 | Veilleux | 15.1 |
| IRAS035210028 | 2002 December 25 | CXO | 7007844105 | Wilson | 7.2 |
| F041032838 | 2003 April 28 | CXO | 7007854106 | Wilson | 10.0 |
| 2006 February 13 | XMM | 0301330401 | Wilson | 17.5 | |
| F050241941 | 2007 February 8 | XMM | 0405950401 | Terashima | 20.1 |
| F051892524 | 2001 March 17 | XMM | 0085640101 | Heckman | 6.3 |
| 2001 October 30 | CXO | 6001682034 | Heckman | 19.3 | |
| 2002 January 30 | CXO | 6001683432 | Heckman | 14.7 | |
| F075986508 | 2000 March 21 | CXO | 700121816 | Green | 1.5 |
| 2001 October 25 | XMM | 0094400301 | Sanders | 12.7 | |
| F085723915 | 2004 April 13 | XMM | 0200630101 | Imanishi | 13.3 |
| 2006 January 26 | CXO | 7012806862 | Komossa | 14.3 | |
| F090390503 | 2008 December 31 | CXO | 70188910346 | Veilleux | 16.2 |
| UGC 5101 | 2001 May 28 | CXO | 6001672033 | Heckman | 48.7 |
| 2001 November 12 | XMM | 0085640201 | Heckman | 24.0 | |
| F095390857 | 2004 January 6 | CXO | 7008894806 | Vignali | 5.2 |
| F101901322 | 2003 January 31 | CXO | 7007864107 | Wilson | 9.4 |
| 2003 May 5 | XMM | 0146990101 | Risaliti | 16.3 | |
| F105652448 | 2003 October 23 | CXO | 6003263952 | Martin | 29.2 |
| 2003 June 17 | XMM | 0150320201 | Martin | 22.9 | |
| F110950238 | 2009 April 9 | CXO | 70189010347 | Veilleux | 15.5 |
| F111193257 | 2002 June 30 | CXO | 7005763137 | Anabuki | 15.2 |
| F112231244 | 2006 June 8 | XMM | 0405950101 | Terashima | 0.0 |
| F120720444 | 2003 February 1 | CXO | 7007884109 | Wilson | 9.2 |
| F121120305 | 2001 December 30 | XMM | 0081340801 | Franceschini | 16.0 |
| 2003 April 15 | CXO | 7007894110 | Wilson | 10.0 | |
| 3C 273aa3C 273 is often observed by XMM-Newton for calibration purposes. We selected the six observations that have the longest integration times and also maximize the period of elapsed time between the first and final observations. | 2000 June 14 | XMM | 0126700301 | Jansen | 44.7 |
| 2000 June 17 | XMM | 0126700801 | Jansen | 36.0 | |
| 2001 June 13 | XMM | 0136550101 | Jansen | 62.0 | |
| 2003 July 7 | XMM | 0159960101 | Pollock | 40.6 | |
| 2004 June 30 | XMM | 0136550801 | Jansen | 11.7 | |
| 2007 January 12 | XMM | 0414190101 | Parmar | 47.9 | |
| Mrk 231 | 2000 October 19 | CXO | 7003891031 | Garmire | 36.0 |
| 2001 June 7 | XMM | 0081340201 | Franceschini | 17.2 | |
| Mrk 231 (cont.) | 2003 February 3 | CXO | 7007074028 | Gallagher | 41.0 |
| 2003 February 11 | CXO | 7007084029 | Gallagher | 49.5 | |
| 2003 February 20 | CXO | 7007094030 | Gallagher | 32.2 | |
| F132180552 | 2004 July 11 | XMM | 0200660301 | Matt | 5.1 |
| Mrk 273 | 2000 April 19 | CXO | 700114809 | Xia | 41.0 |
| 2002 May 7 | XMM | 0101640401 | Aschenbach | 18.0 | |
| F134511232 | 2000 February 24 | CXO | 700141836 | Ward | 19.7 |
| F143481447 | 2002 July 29 | XMM | 0081341401 | Franceschini | 6.8 |
| 2006 March 12 | CXO | 7012796861 | Komossa | 14.8 | |
| F151301958 | 2003 June 2 | CXO | 7007904111 | Wilson | 9.8 |
| F152503608 | 2002 February 22 | XMM | 0081341101 | Franceschini | 15.0 |
| 2003 August 27 | CXO | 7007914112 | Wilson | 9.2 | |
| Arp 220 | 2000 June 24 | CXO | 700174869 | Clements | 56.1 |
| 2002 August 11 | XMM | 0101640801 | Aschenbach | 10.5 | |
| 2003 January 15 | XMM | 0101640901 | Aschenbach | 8.3 | |
| 2005 January 14 | XMM | 0205510201 | Sanders | 5.8 | |
| 2005 February 20 | XMM | 0205510401 | Sanders | 4.8 | |
| 2005 February 27 | XMM | 0205510501 | Sanders | 0.0 | |
| F154620450 | 2009 April 23 | CXO | 70189110348 | Veilleux | 15.2 |
| F160900139 | 2003 February 10 | CXO | 7007924113 | Wilson | 9.8 |
| NGC 6240 | 2000 September 22 | XMM | 0101640101 | Aschenbach | 11.3 |
| 2001 July 29 | CXO | 7002061590 | Predehl | 37.1 | |
| 2002 March 12 | XMM | 0101640601 | Aschenbach | 5.8 | |
| 2003 March 14 | XMM | 0147420201 | Netzer | 3.4 | |
| 2003 March 18 | XMM | 0147420301 | Netzer | 0.0 | |
| 2003 August 13 | XMM | 0147420401 | Netzer | 7.8 | |
| 2003 August 21 | XMM | 0147420501 | Netzer | 3.4 | |
| 2003 August 29 | XMM | 0147420601 | Netzer | 1.6 | |
| F172080014 | 2001 October 25 | CXO | 6001692035 | Heckman | 49.0 |
| 2002 February 19 | XMM | 0081340601 | Franceschini | 9.8 | |
| 2003 May 7 | CXO | 7007934114 | Wilson | 8.6 | |
| F212080519 | 2009 March 31 | CXO | 70189210349 | Veilleux | 15.1 |
| F213292346 | 2009 June 21 | CXO | 70189310350 | Veilleux | 15.2 |
| F224911808 | 2001 May 24 | XMM | 0081340901 | Franceschini | 17.9 |
| 2007 July 13 | CXO | 7014857821 | Sanders | 14.4 | |
| F232340946 | 2009 August 15 | CXO | 70189410351 | Veilleux | 15.1 |
| PG QSOs | |||||
| PG0050124 | 2002 June 22 | XMM | 0110890301 | Watson | 18.3 |
| 2005 July 18 | XMM | 0300470101 | Gallo | 57.8 | |
| PG0838770 | 2009 March 2 | XMM | 0550870401 | Veilleux | 12.5 |
| PG0844349 | 2000 November 5 | XMM | 0103660201 | Aschenbach | 8.5 |
| PG0953414 | 2001 November 22 | XMM | 0111290201 | Watson | 10.9 |
| PG1001054 | 2003 May 4 | XMM | 0150610101 | Schartel | 8.7 |
| PG1004130 | 2003 May 4 | XMM | 0140550601 | Brandt | 18.0 |
| 2005 January 5 | CXO | 7010295606 | Garmire | 41.3 | |
| PG1116215 | 2001 December 2 | XMM | 0111290401 | Watson | 5.5 |
| 2004 December 17 | XMM | 0201940101 | Steenbrugge | 5.6 | |
| 2004 December 19 | XMM | 0201940201 | Steenbrugge | 5.0 | |
| PG1126041 | 2004 December 21 | XMM | 0202060201 | Schartel | 28.7 |
| PG1211143 | 2001 June 15 | XMM | 0112610101 | Turner | 48.9 |
| 2004 June 21 | XMM | 0208020101 | Reeves | 34.4 | |
| PG1229204 | 2005 July 9 | XMM | 0301450201 | Matt | 17.2 |
| PG1244026 | 2001 June 17 | XMM | 0051760101 | Fabian | 4.3 |
| PG1307085 | 2002 June 13 | XMM | 0110950401 | Watson | 10.2 |
| PG1309355 | 2002 June 10 | XMM | 0109080201 | Mason | 23.9 |
| PG1351640 | 2004 June 23 | XMM | 0205390301 | O’Brien | 43.3 |
| PG1411442 | 2002 July 10 | XMM | 0103660101 | Aschenbach | 21.9 |
| PG1426015 | 2000 July 28 | XMM | 0102040501 | Jansen | 0.5 |
| PG1435067 | 2009 February 2 | XMM | 05508070201 | Veilleux | 0.4 |
| PG1440356 | 2001 December 23 | XMM | 0107660201 | Mushotzky | 15.3 |
| 2003 January 1 | XMM | 0005010101 | Guainazzi | 17.2 | |
| 2003 January 4 | XMM | 0005010201 | Guainazzi | 10.4 | |
| 2003 January 7 | XMM | 0005010301 | Guainazzi | 18.1 | |
| PG1448273 | 2003 February 8 | XMM | 0152660101 | Kawaguchi | 18.1 |
| PG1501106 | 2001 January 13 | XMM | 0112910201 | Turner | 5.9 |
| 2001 January 13 | XMM | 0070740101 | Petrucci | 7.6 | |
| 2001 January 14 | XMM | 0070740301 | Petrucci | 9.0 | |
| 2005 January 16 | XMM | 0205340201 | Petrucci | 29.7 | |
| 2005 July 17 | XMM | 0205340401 | Petrucci | 16.3 | |
| PG1613658 | 2001 April 13 | XMM | 0102040601 | Jansen | 1.8 |
| 2001 August 29 | XMM | 0102041301 | Jansen | 2.1 | |
| PG1626554 | 2002 May 5 | XMM | 0109081101 | Mason | 0.4 |
| PG2130099 | 2003 May 16 | XMM | 0150470701 | Santos-Lleo | 25.4 |
| B2 220131A | 2008 December 1 | XMM | 0550871001 | Veilleux | 9.3 |
| PG2214139 | 2002 May 12 | XMM | 0103660301 | Aschenbach | 6.6 |
Note. — Col.(1): Galaxy name. Coordinate-based names beginning with ”F” are sources in the IRAS Faint Source Catalog. Col.(2): Observation start date. Col.(3): Telescope used (CXO = Chandra; XMM = XMM-Newton). Col.(4): Observation identification number. Col.(5): Principal investigator of the observation. Col.(6): Net exposure time in ks after selection of good time interval.
| Galaxy | Obs. Date | Eline | EW | (d.o.f.) | ||||||||
|---|---|---|---|---|---|---|---|---|---|---|---|---|
| (1) | (2) | (3) | (4) | (5) | (6) | (7) | (8) | (9) | (10) | (11) | (12) | (13) |
| PG0050124 | 2002 Jun 22aaThe spectrum requires additional components for redshifted absorption edges originating from O VII or O VIII. | 2.31 | 0.04 | 1.22 (630) | 8.38 | 8.25 | 0.96 | 0.74 | ||||
| 2005 Jul 18aaThe spectrum requires additional components for redshifted absorption edges originating from O VII or O VIII. | 2.34 | 56.86 | 1.09 (812) | 5.16 | 4.93 | 0.93 | 0.68 | |||||
| PG0838770 | 2009 Mar 2 | 1.49 | 1.06 (138) | 0.29 | 0.78 | 0.14 | 0.35 | |||||
| PG0844349 | 2000 Nov 5 | 0.15 | 2.66 | 6.13 | 6.4(f) | 0.0(f) | 0.11 | 0.86 (264) | 6.55 | 5.13 | 1.42 | 0.63 |
| 6.7(f) | 0.0(f) | 0.18 | ||||||||||
| PG0953414 | 2001 Nov 22 | 0.16 | 2.44 | 18.52 | 1.04 (324) | 3.39 | 2.93 | 10.89 | 6.51 | |||
| PG1001054 | 2003 May 4 | 0.09 | 2.01 | 8.09 | 0.96 (19) | 0.02 | 0.12 | 0.10 | 0.12 | |||
| PG1004130 | 2003 May 4 | 1.67 | 2.99 | 1.04 (111) | 0.09 | 0.31 | 0.30 | 0.57 | ||||
| 2005 Jan 5 | 1.52 | 1.44 | 1.06 (95) | 0.10 | 0.43 | 0.32 | 0.77 | |||||
| PG1116215 | 2001 Dec 2 | 0.08 | 2.53 | 27.21 | 1.00 (255) | 4.34 | 3.27 | 8.45 | 4.44 | |||
| 2004 Dec 17 | 0.09 | 2.49 | 31.61 | 1.15 (664) | 3.70 | 3.11 | 8.35 | 4.65 | ||||
| 2004 Dec 19 | 0.12 | 2.51 | 20.21 | 0.98 (238) | 4.00 | 3.51 | 8.51 | 4.63 | ||||
| PG1126041 | 2004 Dec 21 | 0.11 | 1.95 | 4.66 | 1.13 (309) | 0.09 | 1.14 | 0.11 | 0.13 | |||
| PG1211143 | 2001 Jun 15aaThe spectrum requires additional components for redshifted absorption edges originating from O VII or O VIII. | 0.19 | 2.83 | 12.98 | 1.41 (489) | 2.69 | 2.90 | 2.13 | 0.87 | |||
| 2004 Jun 21aaThe spectrum requires additional components for redshifted absorption edges originating from O VII or O VIII. | 0.21 | 2.63 | 12.40 | 6.4(f) | 0.2(f) | 0.18 | 1.21 (533) | 3.23 | 3.07 | 1.59 | 0.78 | |
| PG1229204 | 2005 Jul 9 | 0.09 | 2.38 | 13.52 | 6.4(f) | 0.0(f) | 0.06 | 1.13 (402) | 3.17 | 3.16 | 0.61 | 0.41 |
| 6.7(f) | 0.0(f) | 0.11 | ||||||||||
| PG1244026 | 2001 Jun 17 | 0.62 | 2.72 | 0.89 (240) | 6.58 | 2.55 | 0.38 | 0.14 | ||||
| PG1307085 | 2002 Jun 13 | 0.11 | 1.89 | 5.64 | 1.13 (145) | 0.77 | 1.89 | 1.05 | 1.43 | |||
| PG1309355 | 2002 Jun 10aaThe spectrum requires additional components for redshifted absorption edges originating from O VII or O VIII. | 2.19 | 6.02 | 6.4(f) | 0.0(f) | 0.12 | 1.03 (264) | 0.40 | 0.69 | 0.74 | 0.76 | |
| PG1351640 | 2004 Jun 23aaThe spectrum requires additional components for redshifted absorption edges originating from O VII or O VIII. | 0.16 | 2.42 | 14.61 | 1.06 (281) | 0.59 | 0.62 | 0.25 | 0.17 | |||
| PG1411442 | 2002 Jul 10 | 0.12 | 2.41 | 26.29 | 6.4(f) | 0.0(f) | 0.17 | 1.01 (139) | 0.08 | 0.50 | 0.40 | 0.26 |
| PG1426015 | 2000 Jul 28 | 2.38 | 1.01 (148) | 8.14 | 5.92 | 1.65 | 1.09 | |||||
| PG1435067 | 2009 Feb 2 | 2.36 | 1.25 (60) | 2.60 | 2.10 | 1.30 | 0.88 | |||||
| PG1440356 | 2001 Dec 23 | 3.02 | 8.92 | 1.17 (164) | 5.12 | 2.41 | 2.12 | 0.55 | ||||
| 2003 Jan 1aaThe spectrum requires additional components for redshifted absorption edges originating from O VII or O VIII. | 2.86 | 14.40 | 1.34 (433) | 5.49 | 3.12 | 2.37 | 0.79 | |||||
| 2003 Jan 4 | 2.98 | 8.25 | 0.96 (344) | 4.86 | 2.46 | 1.99 | 0.55 | |||||
| 2003 Jan 7 | 2.86 | 12.67 | 1.45 (340) | 2.90 | 1.74 | 1.34 | 0.44 | |||||
| PG1448273 | 2003 Feb 8 | 0.23 | 2.80 | 16.72 | 1.22 (381) | 3.91 | 1.97 | 0.89 | 0.31 | |||
| PG1501106 | 2001 Jan 13aaThe spectrum requires additional components for redshifted absorption edges originating from O VII or O VIII. | 0.08 | 2.46 | 23.12 | 1.23 (481) | 14.14 | 13.24 | 1.12 | 0.68 | |||
| 2001 Jan 13aaThe spectrum requires additional components for redshifted absorption edges originating from O VII or O VIII. | 0.09 | 2.50 | 18.66 | 6.4(f) | 0.0(f) | 0.04 | 1.09 (566) | 16.08 | 14.76 | 1.23 | 0.70 | |
| 2001 Jan 14aaThe spectrum requires additional components for redshifted absorption edges originating from O VII or O VIII. | 0.09 | 2.45 | 15.88 | 1.14 (624) | 16.02 | 15.63 | 1.17 | 0.71 | ||||
| 2005 Jan 16aaThe spectrum requires additional components for redshifted absorption edges originating from O VII or O VIII. | 0.09 | 2.26 | 13.01 | 6.7(f) | 0.2(f) | 0.14 | 1.56 (821) | 4.93 | 9.78 | 0.55 | 0.47 | |
| 2005 Jul 17aaThe spectrum requires additional components for redshifted absorption edges originating from O VII or O VIII. | 0.11 | 2.11 | 11.48 | 6.7(f) | 0.15(f) | 0.11 | 1.24 (691) | 6.80 | 11.51 | 0.42 | 0.45 | |
| PG1613658 | 2001 Apr 13 | 1.95 | 28.24 | 0.99 (135) | 2.58 | 4.22 | 1.90 | 2.38 | ||||
| 2001 Aug 29 | 2.12 | 10.45 | 0.98 (246) | 4.00 | 5.29 | 2.74 | 2.67 | |||||
| PG1626554 | 2002 May 5 | 2.04 | 0.95 (33) | 2.99 | 3.45 | 1.49 | 1.62 | |||||
| PG2130099 | 2003 May 16aaThe spectrum requires additional components for redshifted absorption edges originating from O VII or O VIII. | 0.08 | 2.29 | 5.91 | 6.4(f) | 0.1(f) | 0.15 | 1.31 (481) | 1.88 | 3.43 | 0.51 | 0.42 |
| B2 220131A | 2008 Dec 1 | 0.19 | 2.11 | 40.42 | 1.04 (212) | 2.55 | 4.61 | 20.18 | 19.57 | |||
| PG2214139 | 2002 May 12 | 0.17 | 1.80 | 4.48 | 1.14 (207) | 0.28 | 3.19 | 0.29 | 0.44 |
Note. — (f) denotes a fixed value. Col.(1): Galaxy name. Col.(2): Observation start date. Col.(3): Gas temperature from the MEKAL component in units of keV. Col.(4): Photon index of the direct and indirect power-law components. Col.(5): Hydrogen column density within the source in units of cm-2. Col.(6): Rest-frame energy of the iron emission line(s) in units of keV. Col.(7): Width of the iron line(s) in units of keV. Col.(8): The equivalent width of the iron line(s) in units of keV. Col.(9): Reduced of the best-fit model followed by the number of degrees of freedom in (). Col.(10): Observed 0.5–2 keV flux in units of erg s-1 cm-2. Col.(11): Observed 2–10 keV flux in units of erg s-1 cm-2. Col.(12): Nominal absorption corrected 0.5–2 keV luminosity in units of erg s-1. Col.(13): Nominal absorption corrected 2–10 keV luminosity in units of erg s-1.
| Galaxy | Obs. Date | Eline | EW | (d.o.f.) | ||||||||
|---|---|---|---|---|---|---|---|---|---|---|---|---|
| (1) | (2) | (3) | (4) | (5) | (6) | (7) | (8) | (9) | (10) | (11) | (12) | (13) |
| PG0050124 | 2002 Jun 22bbThe spectrum requires additional components for redshifted absorption edges originating from O VII or O VIII. | 0.07; 0.21 | 2.25 | 0.09 | 6.4(f) | 0.0(f) | 0.04 | 1.13 (626) | 8.38 | 8.33 | 1.09 | 0.76 |
| 2005 Jul 18 | 0.08; 0.25 | 2.09 | 0.04 | 6.4(f) | 0.0(f) | 0.02 | 1.10 (812) | 5.16 | 4.89 | 0.60 | 0.44 | |
| PG0844349 | 2000 Nov 5 | 0.08; 0.19 | 2.06 | 0.84 (266) | 6.51 | 5.37 | 0.73 | 0.53 | ||||
| PG0953414 | 2001 Nov 22ccAlthough Piconcelli et al. (2005) found that the double blackbody plus power law model best describes the spectrum, we found that a single blackbody plus power law model is a better fit. | 2.11 | 2.57 | 1.06 (326) | 3.40 | 2.98 | 5.81 | 4.87 | ||||
| PG1001054 | 2003 May 4 | 2.06 | 8.05ddThe absorber here is an ionized absorber with ionization parameter at 237 erg cm-2. | 1.79 (21) | 0.02 | 0.10 | 0.08 | 0.09 | ||||
| PG1116215 | 2001 Dec 2bbThe spectrum requires additional components for redshifted absorption edges originating from O VII or O VIII. | 0.34 | 2.18 | 6.4(f); 7.17(f) | 0.0(f); 0.0(f) | 0.05; 0.18 | 0.96 (253) | 4.35 | 3.29 | 3.37 | 2.70 | |
| 2004 Dec 17 | 0.34 | 2.05 | 6.4(f) | 0.0(f) | 0.07 | 1.31 (665) | 3.71 | 3.12 | 3.35 | 2.68 | ||
| 2004 Dec 19 | 0.36 | 2.02 | 6.4(f); 7.17(f) | 0.0(f); 0.0(f) | 0.12; 0.08 | 0.97 (238) | 4.01 | 3.56 | 3.73 | 3.09 | ||
| PG1211143 | 2001 Jun 15bbThe spectrum requires additional components for redshifted absorption edges originating from O VII or O VIII. | 2.04; 0.11 | 2.43 | 6.4(f) | 0.1(f) | 0.06 | 1.08 (486) | 2.66 | 2.99 | 0.49 | 0.49 | |
| 2004 Jun 21 | 2.06; 0.11 | 2.20 | 6.4(f) | 0.1(f) | 0.09 | 1.13 (537) | 3.19 | 3.20 | 0.58 | 0.52 | ||
| PG1244026 | 2001 Jun 17 | 0.16 | 2.49 | 0.86 (240) | 6.71 | 2.84 | 0.39 | 0.15 | ||||
| PG1307085 | 2002 Jun 13bbThe spectrum requires additional components for redshifted absorption edges originating from O VII or O VIII. | 1.97 | 2.23 | 1.02 (145) | 0.80 | 1.88 | 0.56 | 1.04 | ||||
| PG1309355 | 2002 Jun 10bbThe spectrum requires additional components for redshifted absorption edges originating from O VII or O VIII. | 2.06 | 2.20 | 6.4(f) | 0.0(f) | 0.05 | 1.03 (264) | 0.40 | 0.69 | 0.40 | 0.66 | |
| PG1411442 | 2002 Jul 10 | 0.12 | 2.35 | 25.17eeThe absorber here is a partial-covering absorber with the covering fraction at 0.96. | 6.4(f) | 0.0(f) | 0.17 | 1.00 (139) | 0.08 | 0.43 | 0.44 | 0.26 |
| PG1440356 | 2001 Dec 23 | 1.13; 3.10 | 1.15 (164) | 5.12 | 2.70 | 0.82 | 0.42 | |||||
| 2003 Jan 1 | 1.35; 3.04 | 1.16 (435) | 5.46 | 3.31 | 0.88 | 0.51 | ||||||
| 2003 Jan 4 | 1.18; 3.08 | 0.95 (344) | 4.86 | 2.75 | 0.78 | 0.42 | ||||||
| 2003 Jan 7 | 1.36; 3.03 | 1.07 (340) | 2.88 | 1.86 | 0.46 | 0.29 | ||||||
| PG1501106 | 2001 Jan 13 | 2.30; 0.63 | 2.81 | 1.08 (483) | 13.88 | 13.77 | 0.45 | 0.41 | ||||
| 2001 Jan 13 | 2.25; 0.68 | 2.73 | 1.08 (569) | 15.85 | 15.22 | 0.52 | 0.46 | |||||
| 2001 Jan 14 | 2.18; 0.10 | 2.39 | 1.04 (626) | 15.87 | 16.09 | 0.52 | 0.48 | |||||
| 2005 Jan 16bbThe spectrum requires additional components for redshifted absorption edges originating from O VII or O VIII. | 1.21; 2.55 | 2.60 | 6.7(f) | 0.0(f) | 0.07 | 1.32 (821) | 4.83 | 10.24 | 0.07 | 0.31 | ||
| 2005 Jul 17 | 2.31; 0.69 | 2.67 | 1.64 (694) | 6.61 | 11.89 | 0.21 | 0.36 | |||||
| PG1613658 | 2001 Apr 13 | 2.27 | 2.02 | 0.99 (135) | 2.59 | 4.17 | 1.24 | 1.83 | ||||
| 2001 Aug 29 | 1.56 | 2.20 | 0.99 (246) | 4.01 | 5.08 | 1.93 | 2.24 | |||||
| PG2214139 | 2002 May 12ffPiconcelli et al. (2005) suggests the best-fit model is a two-phase warm absorber with a power-law component. The column density parameters are listed in order for the respective phases at and K. These two phases have ionization parameters of 99 and 6 erg cm-2, respectively. | 1.56 | 6.72; 0.55 | 0.57(f); 6.4(f) | 0.0(f); 0.0(f) | 0.02; 0.11 | 1.15 (205) | 0.28 | 3.22 | 0.19 | 0.42 |
Note. — (f) denotes a fixed value. Col.(1): Galaxy name. Col.(2): Observation start date. Col.(3): Temperature(s) of the blackbody, bremsstrahlung, or Raymond-Smith component(s) in units of keV. Col.(4): Photon index of the power-law component(s). Col.(5): Hydrogen column density within the source in units of cm-2. Col.(6): Rest-frame energy of the iron emission line(s) in units of keV. Col.(7): Width of the iron line(s) in units of keV. Col.(8): The equivalent width of the iron line(s) in units of keV. Col.(9): Reduced of the best-fit model followed by the number of degrees of freedom in (). Col.(10): Observed 0.5–2 keV flux in units of erg s-1 cm-2. Col.(11): Observed 2–10 keV flux in units of erg s-1 cm-2. Col.(12): Nominal absorption corrected 0.5–2 keV luminosity in units of erg s-1. Col.(13): Nominal absorption corrected 2–10 keV luminosity in units of erg s-1.
| Galaxy | Obs. Date | Fe | (d.o.f.) | ||||||||||
|---|---|---|---|---|---|---|---|---|---|---|---|---|---|
| (1) | (2) | (3) | (4) | (5) | (6) | (7) | (8) | (9) | (10) | (11) | (12) | (13) | (14) |
| PG0050124 | 2002 Jun 22aaThe spectrum requires additional components for redshifted absorption edges originating from O VII or O VIII. | 2.27 | 0.04 | 10.0 | 3.5 | 31.0 | 0.1 | 2132 | 1.20 (625) | 8.35 | 8.26 | 0.83 | 0.74 |
| 2005 Jul 18 | 2.23 | 0.05 | 5.1 | 2.7 | 3.5 | 0.1 | 1012 | 1.15 (812) | 5.16 | 4.79 | 0.49 | 0.43 | |
| PG0838770 | 2009 Mar 2 | 1.36 | 5.0 | 1.2 | 50.6 | 0.1 | 300 | 1.08 (141) | 0.33 | 0.75 | 0.15 | 0.34 | |
| PG0844349 | 2000 Nov 5 | 2.18 | 7.1 | 1.3 | 60.2 | 0.5 | 521 | 0.85 (264) | 6.55 | 5.23 | 0.65 | 0.52 | |
| PG0953414 | 2001 Nov 22 | 2.27 | 6.1 | 1.4 | 59.5 | 0.1 | 81 | 1.02 (322) | 3.40 | 3.01 | 5.56 | 4.92 | |
| PG1001054 | 2003 May 4 | 1.01 | 10.0 | 3.0 | 22.2 | 6.7 | 305 | 1.41 (17) | 0.03 | 0.12 | 0.02 | 0.09 | |
| PG1004130 | 2003 May 4 | 1.21 | 6.7 | 1.9 | 0.0 | 3.6 | 837 | 1.04 (107) | 0.09 | 0.28 | 0.16 | 0.49 | |
| 2005 Jan 5 | 1.00 | 7.9 | 1.2 | 50.6 | 1.4 | 30 | 1.15 (91) | 0.09 | 0.34 | 0.16 | 0.59 | ||
| PG1116215 | 2001 Dec 2 | 2.16 | 7.3 | 1.3 | 59.1 | 0.3 | 1410 | 0.98 (253) | 4.36 | 3.22 | 3.17 | 2.79 | |
| 2004 Dec 17aaThe spectrum requires additional components for redshifted absorption edges originating from O VII or O VIII. | 2.07 | 10.0 | 1.2 | 75.2 | 0.5 | 922 | 1.20 (660) | 3.69 | 3.09 | 3.19 | 2.67 | ||
| 2004 Dec 19aaThe spectrum requires additional components for redshifted absorption edges originating from O VII or O VIII. | 2.09 | 10.0 | 1.6 | 60.7 | 0.7 | 845 | 0.98 (234) | 4.11 | 3.49 | 3.56 | 3.02 | ||
| PG1126041 | 2004 Dec 21aaThe spectrum requires additional components for redshifted absorption edges originating from O VII or O VIII. | 1.01 | 6.6 | 1.7 | 18.2 | 2.2 | 301 | 1.19 (305) | 0.09 | 1.11 | 0.01 | 0.10 | |
| PG1211143 | 2001 Jun 15aaThe spectrum requires additional components for redshifted absorption edges originating from O VII or O VIII. | 1.79 | 8.7 | 1.3 | 48.3 | 3.2 | 197 | 1.45 (489) | 2.65 | 2.97 | 0.43 | 0.48 | |
| 2004 Jun 21 | 2.04 | 9.8 | 1.2 | 63.2 | 0.7 | 194 | 1.13 (536) | 3.21 | 3.18 | 0.52 | 0.52 | ||
| PG1229204 | 2005 Jul 9bbThe inclusion of a Gaussian for the emission line at 6.4 keV is required. | 2.01 | 5.1 | 1.8 | 34.1 | 0.4 | 917 | 1.25 (401) | 3.16 | 3.06 | 0.30 | 0.29 | |
| PG1244026 | 2001 Jun 17 | 2.63 | 2.2 | 10.0 | 2.0 | 0.6 | 2339 | 0.89 (248) | 6.86 | 2.71 | 0.37 | 0.15 | |
| PG1307085 | 2002 Jun 13aaThe spectrum requires additional components for redshifted absorption edges originating from O VII or O VIII. | 1.77 | 7.6 | 1.2 | 62.5 | 1.5 | 30 | 0.93 (141) | 0.80 | 1.94 | 0.52 | 1.27 | |
| PG1309355 | 2002 Jun 10aaThe spectrum requires additional components for redshifted absorption edges originating from O VII or O VIII. | 1.76 | 10.0 | 1.8 | 50.6 | 0.4 | 235 | 1.01 (259) | 0.40 | 0.71 | 0.38 | 0.68 | |
| PG1351640 | 2004 Jun 23aaThe spectrum requires additional components for redshifted absorption edges originating from O VII or O VIII. | 2.03 | 4.2 | 1.8 | 30.8 | 0.3 | 388 | 1.04 (279) | 0.58 | 0.62 | 0.11 | 0.12 | |
| PG1411442 | 2002 Jul 10 | 1.21 | 3.9 | 1.4 | 38.8 | 0.8 | 221 | 0.98 (138) | 0.07 | 0.47 | 0.01 | 0.10 | |
| PG1426015 | 2000 Jul 28 | 2.15 | 10.0 | 2.0 | 32.7 | 0.3 | 992 | 0.94 (142) | 7.80 | 7.07 | 1.44 | 1.30 | |
| PG1435067 | 2009 Feb 2 | 2.12 | 10.0 | 5.0 | 28.5 | 0.3 | 529 | 1.27 (54) | 2.54 | 2.59 | 1.06 | 1.08 | |
| PG1440356 | 2001 Dec 23 | 2.34 | 10.0 | 1.2 | 57.7 | 0.5 | 2173 | 1.14 (161) | 5.14 | 2.37 | 0.79 | 0.36 | |
| 2003 Jan 1aaThe spectrum requires additional components for redshifted absorption edges originating from O VII or O VIII. | 2.29 | 9.8 | 1.4 | 55.8 | 0.3 | 2064 | 1.16 (430) | 5.48 | 3.03 | 0.84 | 0.47 | ||
| 2003 Jan 4aaThe spectrum requires additional components for redshifted absorption edges originating from O VII or O VIII. | 2.33 | 10.0 | 1.2 | 55.9 | 0.4 | 2212 | 0.98 (339) | 4.87 | 2.42 | 0.75 | 0.37 | ||
| 2003 Jan 7aaThe spectrum requires additional components for redshifted absorption edges originating from O VII or O VIII. | 2.24 | 9.8 | 1.3 | 56.7 | 0.3 | 1516 | 1.07 (335) | 2.88 | 1.74 | 0.44 | 0.27 | ||
| PG1448273 | 2003 Feb 8aaThe spectrum requires additional components for redshifted absorption edges originating from O VII or O VIII. | 2.36 | 3.1 | 2.0 | 24.7 | 0.8 | 2423 | 1.03 (377) | 3.90 | 1.94 | 0.40 | 0.20 | |
| PG1501106 | 2001 Jan 13aaThe spectrum requires additional components for redshifted absorption edges originating from O VII or O VIII. | 2.25 | 6.8 | 1.7 | 41.3 | 0.1 | 100 | 1.11 (479) | 13.93 | 13.41 | 0.42 | 0.40 | |
| 2001 Jan 13aaThe spectrum requires additional components for redshifted absorption edges originating from O VII or O VIII. | 2.05 | 5.5 | 1.8 | 38.2 | 0.3 | 590 | 1.19 (565) | 15.99 | 14.67 | 0.48 | 0.44 | ||
| 2001 Jan 14aaThe spectrum requires additional components for redshifted absorption edges originating from O VII or O VIII. | 1.95 | 5.7 | 1.6 | 43.8 | 0.2 | 1105 | 1.14 (620) | 15.96 | 15.67 | 0.48 | 0.47 | ||
| 2005 Jan 16aaThe spectrum requires additional components for redshifted absorption edges originating from O VII or O VIII. | 1.22 | 5.1 | 2.1 | 1.1 | 0.5 | 345 | 1.41 (818) | 4.87 | 9.99 | 0.15 | 0.30 | ||
| 2005 Jul 17aaThe spectrum requires additional components for redshifted absorption edges originating from O VII or O VIII. | 1.39 | 6.6 | 1.6 | 50.0 | 0.3 | 591 | 1.11 (688) | 6.77 | 11.66 | 0.20 | 0.35 | ||
| PG1613658 | 2001 Apr 13 | 1.79 | 10.0 | 5.0 | 42.8 | 0.1 | 109 | 1.02 (140) | 2.69 | 4.19 | 1.18 | 1.84 | |
| 2001 Aug 29 | 1.89 | 5.6 | 1.8 | 29.9 | 0.1 | 371 | 0.96 (254) | 4.09 | 4.75 | 1.79 | 2.08 | ||
| PG1626554 | 2002 May 5 | 1.74 | 8.9 | 1.6 | 0.0 | 0.1 | 3193 | 0.97 (30) | 2.88 | 2.29 | 1.35 | 1.07 | |
| PG2130099 | 2003 May 16aaThe spectrum requires additional components for redshifted absorption edges originating from O VII or O VIII. | 1.00(f) | 7.8 | 2.0 | 31.8 | 10.0 | 5796 | 1.41 (477) | 1.89 | 3.47 | 0.18 | 0.33 | |
| B2 220131A | 2008 Dec 1 | 1.71 | 9.8 | 1.2 | 71.3 | 0.3 | 587 | 1.03 (210) | 2.54 | 4.62 | 7.05 | 12.82 | |
| PG2214139 | 2002 May 12a,ba,bfootnotemark: | 2.71 | 0.38 | 10.0 | 2.2 | 27.4 | 0.1 | 161 | 1.05 (200) | 0.27 | 3.08 | 0.13 | 0.33 |
Note. — (f) denotes a fixed value. Col.(1): Galaxy name. Col.(2): Observation start date. Col.(3): Photon index of the direct and indirect power-law components. Col.(4): Hydrogen column density within the source in units of cm-2. Col.(5): The power law dependence of the emissivity (). Col. (6): Inner radius of the accretion disk in gravitational radii with the outer radius fixed at the default value (100 gravitational radii). Col.(7): Inclination of the accretion disk to the line of sight in degrees. Col. (8): Iron abundance of the reflector relative to the Solar value. Col.(9): Ionization parameter of the gas. Col.(10): Reduced of the best-fit model followed by the number of degrees of freedom in (). Col.(11): Observed 0.5–2 keV flux in units of erg s-1 cm-2. Col.(12): Observed 2–10 keV flux in units of erg s-1 cm-2. Col.(13): Nominal absorption corrected 0.5–2 keV luminosity in units of erg s-1. Col.(14): Nominal absorption corrected 2–10 keV luminosity in units of erg s-1.
| Galaxy | Obs. Date | (d.o.f.) | |||||||||
|---|---|---|---|---|---|---|---|---|---|---|---|
| (1) | (2) | (3) | (4) | (5) | (6) | (7) | (8) | (9) | (10) | (11) | (12) |
| PG0050124 | 2002 Jun 22bbThe spectrum requires additional components for redshifted absorption edges originating from O VII or O VIII. | 2.26 | 0.04 | 4.5(f) | 30.0(f) | 10000(f) | 1.16 (633) | 8.37 | 8.27 | 0.98 | 0.75 |
| 2005 Jul 18bbThe spectrum requires additional components for redshifted absorption edges originating from O VII or O VIII. | 2.16 | 1.9 | 87.7 | 2870 | 1.05 (810) | 5.16 | 4.87 | 0.55 | 0.44 | ||
| PG0838770 | 2009 Mar 2 | 1.49 | 4.5(f) | 30.0(f) | 30(f) | 1.06 (137) | 0.29 | 0.77 | 0.14 | 0.35 | |
| PG0844349 | 2000 Nov 5 | 2.32 | 1.7 | 30.0(f) | 999 | 1.15 (267) | 6.76 | 4.58 | 0.76 | 0.45 | |
| PG0953414 | 2001 Nov 22 | 2.30 | 1.9 | 30.0(f) | 48 | 1.04 (324) | 3.39 | 2.93 | 5.79 | 4.79 | |
| PG1001054 | 2003 May 4 | 2.0(f) | 1.2 | 30.0(f) | 297 | 4.80 (21) | |||||
| PG1004130 | 2003 May 4 | 1.40 | 4.5(f) | 30.0(f) | 30 | 1.08 (111) | 0.10 | 0.33 | 0.18 | 0.57 | |
| 2005 Jan 5 | 1.24 | 0.14 | 4.5(f) | 30.0(f) | 30(f) | 1.10 (96) | 0.09 | 0.43 | 0.19 | 0.74 | |
| PG1116215 | 2001 Dec 2 | 2.33 | 1.8 | 30.0(f) | 999 | 1.16 (256) | 4.43 | 2.97 | 4.03 | 2.57 | |
| 2004 Dec 17bbThe spectrum requires additional components for redshifted absorption edges originating from O VII or O VIII. | 2.17 | 4.1 | 30.0(f) | 402 | 1.29 (663) | 3.69 | 3.09 | 3.35 | 2.68 | ||
| 2004 Dec 19 | 2.14 | 1.6 | 30.0(f) | 1433 | 1.13 (239) | 4.20 | 3.25 | 3.82 | 2.81 | ||
| PG1126041 | 2004 Dec 21 | 1.65 | 2.33 | 4.5(f) | 30.0(f) | 300 | 4.72 (310) | ||||
| PG1211143 | 2001 Jun 15 | 1.99 | 1.3 | 30.0(f) | 298 | 10.24 (494) | |||||
| 2004 Jun 21 | 2.02 | 1.5 | 30.0(f) | 300 | 2.67 (539) | ||||||
| PG1229204 | 2005 Jul 9b, cb, cfootnotemark: | 2.05 | 4.5(f) | 30.0(f) | 391 | 1.21 (403) | 3.15 | 3.15 | 0.33 | 0.30 | |
| PG1244026 | 2001 Jun 17 | 2.53 | 1.4 | 87.3 | 299 | 0.86 (238) | 6.61 | 2.98 | 0.39 | 0.16 | |
| PG1307085 | 2002 Jun 13bbThe spectrum requires additional components for redshifted absorption edges originating from O VII or O VIII. | 1.70 | 4.5(f) | 30.0(f) | 31 | 0.98 (145) | 0.81 | 1.98 | 0.55 | 1.29 | |
| PG1309355 | 2002 Jun 10 | 1.61 | 4.5(f) | 30.0(f) | 303 | 1.53 (267) | 0.41 | 0.75 | 0.04 | 0.72 | |
| PG1351640 | 2004 Jun 23bbThe spectrum requires additional components for redshifted absorption edges originating from O VII or O VIII. | 2.22 | 4.5(f) | 30.0(f) | 30 | 1.11 (283) | 0.59 | 0.60 | 0.12 | 0.12 | |
| PG1411442 | 2002 Jul 10 | 2.0(f) | 4.5(f) | 30.0(f) | 285 | 4.02 (143) | |||||
| PG1426015 | 2000 Jul 28 | 2.31 | 1.8 | 30.0(f) | 30 | 0.99 (145) | 8.01 | 6.67 | 1.63 | 1.23 | |
| PG1435067 | 2009 Feb 2 | 2.20 | 4.5(f) | 30.0(f) | 67 | 1.17 (58) | 2.55 | 2.60 | 1.29 | 1.09 | |
| PG1440356 | 2001 Dec 23 | 2.76 | 1.7 | 30.0(f) | 30 | 1.21 (163) | 5.19 | 2.21 | 0.83 | 0.34 | |
| 2003 Jan 1 | 2.63 | 1.7 | 30.0(f) | 30 | 1.67 (434) | 5.55 | 2.80 | 0.89 | 0.43 | ||
| 2003 Jan 4 | 2.74 | 1.6 | 30.0(f) | 30 | 1.27 (343) | 4.94 | 2.13 | 0.79 | 0.33 | ||
| 2003 Jan 7 | 2.0(f) | 1.2 | 30.0(f) | 622 | 3.93 (340) | ||||||
| PG1448273 | 2003 Feb 8 | 2.56 | 1.7 | 30.0(f) | 1407 | 1.37 (382) | 3.97 | 1.81 | 0.45 | 0.19 | |
| PG1501106 | 2001 Jan 13 | 2.29 | 1.8 | 30.0(f) | 30 | 1.62 (484) | 14.23 | 12.62 | 0.47 | 0.38 | |
| 2001 Jan 13 | 2.27 | 1.7 | 30.0(f) | 958 | 2.57 (570) | ||||||
| 2001 Jan 14 | 2.26 | 1.8 | 30.0(f) | 30 | 1.44 (627) | 16.18 | 14.82 | 0.53 | 0.45 | ||
| 2005 Jan 16 | 1.51 | 1.7 | 30.0(f) | 289 | 3.96 (825) | ||||||
| 2005 Jul 17bbThe spectrum requires additional components for redshifted absorption edges originating from O VII or O VIII. | 1.63 | 1.6 | 30.0(f) | 488 | 1.53 (693) | 6.88 | 11.46 | 0.57 | 0.35 | ||
| PG1613658 | 2001 Apr 13 | 1.99 | 0.23 | 1.2 | 50.6 | 110 | 0.97 (132) | 2.49 | 4.19 | 2.22 | 1.87 |
| 2001 Aug 29 | 1.99 | 0.01 | 4.5(f) | 47.3 | 30 | 1.00 (244) | 4.08 | 5.26 | 1.97 | 2.31 | |
| PG2130099 | 2003 May 16 | 1.59 | 1.6 | 30.0(f) | 300 | 2.86 (485) | |||||
| B2 220131A | 2008 Dec 1 | 2.08 | 2.2 | 30.0(f) | 31 | 0.97 (213) | 2.51 | 4.65 | 10.08 | 13.02 | |
| PG2214139 | 2002 May 12 | 2.0(f) | 4.5(f) | 30.0(f) | 30 | 8.42 (210) |
Note. — (f) denotes a fixed value. Col.(1): Galaxy name. Col.(2): Observation start date. Col.(3): Photon index of the direct and indirect power-law components. Col.(4): Hydrogen column density within the source in units of cm-2. Col.(5): Inner radius of the accretion disk in gravitational radii with the outer radius fixed at the default value (100 gravitational radii). Col.(6): Inclination of the accretion disk to the line of sight in degrees. Col.(7): Ionization parameter of the gas. Col.(8): Reduced of the best-fit model followed by the number of degrees of freedom in (). Col.(9): Observed 0.5–2 keV flux in units of erg s-1 cm-2. Col.(10): Observed 2–10 keV flux in units of erg s-1 cm-2. Col.(11): Nominal absorption corrected 0.5–2 keV luminosity in units of erg s-1. Col.(12): Nominal absorption corrected 2–10 keV luminosity in units of erg s-1.
| Galaxy | Date | Extended? | Total | Hard | Soft | HR | NH | |||||
|---|---|---|---|---|---|---|---|---|---|---|---|---|
| (1) | (2) | (3) | (4) | (5) | (6) | (7) | (8) | (9) | (10) | (11) | (12) | (13) |
| F000910738 | 2008 Nov 1 | No | 7 | 3 | 4 | –0.14 | 1.03 | 0.44 | 0.11 | 0.56 | 0.04 | 0.20 |
| F001880856 | 2003 Sep 4 | No | 16 | 6 | 10 | –0.25 | 1.1 | 0.36 | 0.42 | 1.69 | 0.20 | 0.71 |
| 2004 Dec 20 | 164 | 52 | 112 | –0.37 | 1.45 | 0.14 | 0.42 | 1.12 | 0.20 | 0.47 | ||
| F004562904: SW | 2009 May 22 | Yes | 43 | 9 | 34 | –0.21 | 1.15 | 0.35 | 0.74 | 3.11 | 0.22 | 0.94 |
| F010042237 | 2003 Aug 3 | No | 20 | 6 | 14 | –0.40 | 1.4 | 0.16 | 0.26 | 3.64 | 0.09 | 1.29 |
| F020212103 | 2009 Oct 12 | No | 39 | 18 | 21 | –0.08 | 0.89 | 0.55 | 0.56 | 3.56 | 0.19 | 1.21 |
| IRAS035210028 | 2002 Dec 25 | No | 3 | 1 | 2 | –0.33 | 1.5 | 0.25 | 0.14 | 0.33 | 0.09 | 0.20 |
| F041032838 | 2003 Apr 28 | No | 30 | 12 | 18 | –0.20 | 1.05 | 0.43 | 0.74 | 3.37 | 0.26 | 1.17 |
| 2006 Feb 13 | No | 184 | 79 | 105 | –0.14 | 1.06 | 0.38 | 0.80 | 4.10 | 0.28 | 1.42 | |
| F050241941 | 2007 Feb 8 | 129 | 57 | 72 | –0.12 | 1.05 | 0.40 | 0.79 | 3.91 | 0.81 | 4.02 | |
| F075986508: E | 2001 Oct 25 | 240 | 50 | 190 | –0.70 | 2.26 | 2.45 | 1.93 | 1.42 | 1.12 | ||
| F085723915: NW | 2006 Jan 26 | No | 9 | 7 | 2 | 0.56 | –0.43 | 2.40 | 0.06 | 3.01 | 0.01 | 0.24 |
| F090390503 | 2008 Dec 31 | Yes | 34 | 7 | 27 | –0.59 | 2.00 | 0.18 | 0.58 | 0.68 | 0.23 | 0.27 |
| UGC 5101 | 2001 May 28 | Yes | 512 | 194 | 318 | –0.24 | 1.10 | 0.36 | 1.61 | 7.36 | 0.06 | 0.25 |
| 2001 Nov 12 | 698 | 318 | 380 | –0.09 | 0.97 | 0.45 | 2.67 | 14.93 | 0.09 | 0.51 | ||
| F101901322 | 2003 Jan 31 | No | 16 | 6 | 10 | –0.25 | 1.18 | 0.35 | 0.46 | 1.70 | 0.07 | 0.24 |
| 2003 May 5 | 131 | 45 | 86 | –0.31 | 1.36 | 0.19 | 0.97 | 2.99 | 0.14 | 0.42 | ||
| F105652448 | 2003 Oct 23 | Yes | 346 | 91 | 255 | –0.47 | 1.62 | 0.05 | 2.43 | 5.00 | 0.10 | 0.21 |
| 2003 Jun 17 | 691 | 166 | 525 | –0.52 | 1.71 | 0.56 | 3.83 | 6.87 | 0.16 | 0.29 | ||
| F110950238 | 2009 Apr 9 | No | 48 | 15 | 33 | –0.38 | 1.53 | 0.13 | 0.77 | 1.81 | 0.22 | 0.52 |
| F120720444 | 2003 Feb 1 | No | 16 | 2 | 14 | –0.75 | 2.5 | 0.66 | 0.36 | 0.28 | 0.15 | |
| F121120305 | 2001 Dec 30 | 227 | 77 | 150 | –0.32 | 1.33 | 0.18 | 1.34 | 4.31 | 0.17 | 0.55 | |
| 2003 Apr 15 | No | 51 | 14 | 37 | –0.45 | 1.5 | 0.11 | 1.50 | 3.26 | 0.19 | 0.41 | |
| F132180552 | 2004 Jul 11 | 41 | 15 | 26 | –0.27 | 1.39 | 0.17 | 1.29 | 3.77 | 1.54 | 4.49 | |
| F143481447 | 2002 Jul 29 | 117 | 31 | 86 | –0.47 | 1.77 | 0.15 | 2.73 | 4.47 | 0.45 | 0.74 | |
| F143481447: NE | 2006 Mar 12 | Yes | 24 | 6 | 18 | –0.50 | 1.83 | 0.32 | 0.78 | 1.17 | 0.13 | 0.19 |
| F143481447: SW | 2006 Mar 12 | No | 33 | 13 | 20 | –0.21 | 1.20 | 0.37 | 0.77 | 3.02 | 0.13 | 0.50 |
| F151301958 | 2003 Jun 2 | No | 38 | 7 | 31 | –0.63 | 2.15 | 0.17 | 1.59 | 1.33 | 0.47 | 0.40 |
| F152503608 | 2002 Feb 22 | 215 | 38 | 177 | –0.65 | 2.02 | 1.76 | 1.98 | 0.12 | 0.14 | ||
| 2003 Aug 27 | No | 37 | 5 | 32 | –0.73 | 2.27 | 0.07 | 1.43 | 0.96 | 0.10 | 0.07 | |
| F154620450 | 2009 Apr 23 | No | 496 | 260 | 236 | 0.05 | 0.78 | 0.79 | 7.02 | 52.70 | 1.74 | 13.05 |
| F160900139 | 2003 Feb 10 | Yes | 27 | 10 | 17 | –0.41 | 1.57 | 0.15 | 0.82 | 2.34 | 0.38 | 1.09 |
| F172080014 | 2001 Oct 25 | Yes | 478 | 155 | 323 | –0.35 | 1.49 | 0.21 | 2.12 | 5.31 | 0.09 | 0.22 |
| 2002 Feb 19 | 245 | 82 | 163 | –0.33 | 1.55 | 0.17 | 3.18 | 7.29 | 0.13 | 0.31 | ||
| 2003 May 7 | Yes | 92 | 30 | 62 | –0.35 | 1.43 | 0.23 | 3.52 | 8.49 | 0.15 | 0.36 | |
| F212080519: N | 2009 Mar 31 | No | 14 | 3 | 11 | –0.57 | 2.00 | 0.45 | 0.33 | 0.38 | 0.14 | 0.17 |
| F212080519: S | 2009 Mar 31 | No | 6 | 1 | 5 | –0.67 | 2.3 | 1.00 | 0.17 | 0.12 | 0.07 | 0.05 |
| F213292346 | 2009 Jun 21 | No | 27 | 9 | 18 | –0.33 | 1.40 | 0.20 | 0.51 | 1.47 | 0.20 | 0.59 |
| F224911808 | 2001 May 24 | 174 | 34 | 140 | –0.61 | 1.96 | 1.16 | 1.43 | 0.17 | 0.21 | ||
| 2007 Jul 13 | Yes | 41 | 5 | 36 | –0.76 | 2.50 | 1.13 | 0.62 | 0.17 | 0.09 | ||
| F232340946 | 2009 Aug 15 | Yes | 39 | 1 | 38 | –0.95 | 4.0 | 1.09 | 0.08 | 0.46 | 0.03 |
Note. — † We arbitrarily consider a source “weak” when its count rate is 0.01 and 0.05 counts per second when observed with Chandra and XMM-Newton, respectively. Col.(1): Galaxy name. Coordinate-based names beginning with ”F” are sources in the IRAS Faint Source Catalog. Col.(2): Observation start date. Col.(3): Whether the source is extended when compared with the telescope PSF. The symbol “ ” denotes XMM-Newton observations where radial profiles were not created; all these observations are assumed to be unresolved due to the large PSF of the telescope relative to Chandra. Col.(4): Total counts in the 0.5-8.0 keV band. Col.(5): Total counts in the 0.5–2.0 keV band. Col.(6): Total counts in the 2.0–8.0 keV band. Col.(7): The hardness ratio. Col.(8): The estimated based on the hardness ratio and assuming Galactic absorption. Col.(9): The estimated total absorption assuming in units of 1022 cm-2. Col.(10): The estimated observed 0.5–2.0 keV flux assuming the estimated and Galactic absorption in units of 10-14 erg s-1 cm-2. Col.(11): The estimated observed 2.0–10.0 keV flux assuming the estimated and Galactic absorption in units of 10-14 erg s-1 cm-2. Col. (12): Derived 0.5–2 keV luminosity from Col. (10) in units of 1042 erg s-1. Col. (13): Derived 2–10 keV luminosity from Col. (11) in units of 1042 erg s-1.
| Galaxy | Date | Model | EW | Stat | d.o.f | ||||||||||||
|---|---|---|---|---|---|---|---|---|---|---|---|---|---|---|---|---|---|
| (1) | (2) | (3) | (4) | (5) | (6) | (7) | (8) | (9) | (10) | (11) | (12) | (13) | (14) | (15) | (16) | (17) | (18) |
| Cash Statistics (unbinned spectra with 1000 counts) | |||||||||||||||||
| F001880856 | 2004 Dec 20 | A | 1.76 | 716.0 | 1940 | 0.42 | 0.77 | 0.20 | 0.33 | ||||||||
| F041032838aaValues taken from Teng et al. (2008). The energy bands in that paper are 0.2–2 keV and 2–10 keV. | 2006 Feb 13 | C | 0.10 | 1.36 | 0.19 | 6.43 | 0.26 | 1.62 | 848.1 | 1953 | 2.17 | 4.56 | 0.64 | 1.35 | |||
| F050241941 | 2007 Feb 8 | D | 1.94 | 32.9 | 0.86 | 646.5 | 1938 | 0.50 | 2.28 | 4.45 | 5.62 | ||||||
| F075986508 | 2001 Oct 25 | D | 2.95 | 52.2 | 0.95 | 655.6 | 1938 | 2.02 | 2.50 | 29.17 | 8.40 | ||||||
| F101901322 | 2003 May 5 | A | 1.78 | 661.5 | 1940 | 0.62 | 1.11 | 0.10 | 0.16 | ||||||||
| F105652448 | 2003 Oct 23 | C | 0.68 | 2.14 | 0.30 | 352.3 | 507 | 3.19 | 3.72 | 0.23 | 0.17 | ||||||
| 2003 Jun 17 | C | 0.68 | 1.41 | 0.03 | 1118.9 | 1937 | 3.49 | 6.72 | 0.17 | 0.37 | |||||||
| F121120305 | 2001 Dec 30 | B | 0.11 | 581.9 | 1940 | 0.10 | 0.00 | 0.01 | 0.00 | ||||||||
| F143481447 | 2002 Jul 29 | A | 1.97 | 521.2 | 1940 | 1.62 | 2.48 | 0.35 | 0.43 | ||||||||
| F152503608 | 2002 Feb 22 | DbbThe ratio of the normalization parameters between the scattered and direct components is 249 for F15250+3508, 62 for F1119+3257, 24 and 18 for the 2000 and 2002 observation of Mrk 273, respectively. | 0.53 | 2.56 | 132.3 | 613.2 | 1936 | 1.54 | 3.54 | 11.31 | 5.65 | ||||||
| Arp 220 | 2000 Jun 24 | C | 0.65 | 1.82 | 125.2 | 0.98 | 1.83(f) | 0.0(f) | 0.05 | 605.4 | 505 | 6.31 | 22.83 | 1.69 | 2.55 | ||
| 2002 Aug 11 | C | 0.65 | 1.65 | 6.70(f) | 0.0(f) | 1.21 | 1213.6 | 1937 | 7.24 | 11.58 | 0.06 | 0.08 | |||||
| 2003 Jan 15 | C | 0.63 | 1.25 | 6.70(f) | 0.0(f) | 0.81 | 1019.7 | 1937 | 6.51 | 21.18 | 0.05 | 0.12 | |||||
| 2005 Jan 14 | C | 0.62 | 1.45 | 78.1 | 0.88 | 849.7 | 1936 | 6.16 | 15.76 | 0.22 | 0.50 | ||||||
| 2005 Feb 20 | C | 0.59 | 1.24 | 585.7 | 1248 | 7.72 | 17.03 | 0.06 | 0.12 | ||||||||
| F154620450 | 2009 Apr 23 | D | 1.55 | 1.30 | 0.79 | 479.6 | 508 | 6.19 | 41.06 | 4.92 | 11.17 | ||||||
| F172080014 | 2001 Oct 25 | C | 0.74 | 2.44 | 0.43 | 1.83(f) | 0.0(f) | 0.07 | 484.5 | 506 | 1.53 | 1.59 | 0.16 | 0.07 | |||
| 2002 Feb 19 | C | 0.67 | 0.60 | 863.1 | 1938 | 1.82 | 7.98 | 0.11 | 0.35 | ||||||||
| F224911808 | 2001 May 24 | C | 0.71 | 2.20 | 633.4 | 1938 | 1.17 | 0.69 | 0.19 | 0.10 | |||||||
| Statistics (spectra binned to at least 15 counts bin-1) | |||||||||||||||||
| PG0157001 | 2000 Jul 29 | E | 2.66 | 2.54 | 136.4 | 148 | 101.69 | 96.74 | 83.20 | 67.00 | |||||||
| 2003 Aug 23 | C | 0.3 | 2.1 | 138.2 | 130 | 150.16 | 134.76 | 99.99 | 72.99 | ||||||||
| F051892524 | 2001 Mar 17 | D | 0.08 | 2.23 | 7.83 | 0.98 | 164.1 | 165 | 12.19 | 302.82 | 28.06 | 23.04 | |||||
| 2001 Oct 30 | D | 0.20 | 1.49 | 6.67 | 0.96 | 131.8 | 118 | 9.46 | 256.44 | 6.41 | 15.85 | ||||||
| 2002 Jan 30 | D | 0.21 | 1.41 | 5.81 | 0.97 | 114.6 | 108 | 9.49 | 336.91 | 7.23 | 19.96 | ||||||
| UGC 5101 | 2001 May 28 | D | 0.70 | 1.27 | 0.17 | 1.00(f) | 137.65 | 0.96 | ddThe addition of a red-shifted oxygen edge improves the fit significantly. | 28.6 | 24 | 2.04 | 16.78 | 1.85 | 6.45 | ||
| 2001 Nov 12 | D | 0.85 | 1.81 | 0.19 | 1.00(f) | 78.23 | 0.97 | ddThe addition of a red-shifted oxygen edge improves the fit significantly. | 38.2 | 45 | 2.28 | 19.45 | 3.06 | 4.75 | |||
| F111193257 | 2002 Jun 30 | DbbThe ratio of the normalization parameters between the scattered and direct components is 249 for F15250+3508, 62 for F1119+3257, 24 and 18 for the 2000 and 2002 observation of Mrk 273, respectively. | 1.97 | 1.71 | 97.1 | 106 | 26.41 | 155.91 | 143.92 | 173.32 | |||||||
| 3C 273 | 2000 Jun 14 | EddThe addition of a red-shifted oxygen edge improves the fit significantly. | 0.94 | 2.07 | 1587.5 | 1571 | 4.30 | 8.08 | 3.10 | 5.52 | |||||||
| 2.94 | |||||||||||||||||
| 2000 Jun 17 | E | 0.08 | 1.81 | 1600.6 | 1481 | 1.00 | 7.72 | 2.89 | 5.27 | ||||||||
| 2.65 | |||||||||||||||||
| 2001 Jun 13 | EddThe addition of a red-shifted oxygen edge improves the fit significantly. | 0.89 | 2.28 | 1922.4 | 1725 | 5.39 | 9.66 | 3.90 | 6.60 | ||||||||
| 2.93 | |||||||||||||||||
| 2003 Jul 7 | E | 0.79 | 2.08 | 1701.2 | 1589 | 6.38 | 9.79 | 4.60 | 6.69 | ||||||||
| 2.91 | |||||||||||||||||
| 2004 Jun 30 | E | 0.82 | 2.13 | 978.7 | 943 | 4.01 | 6.80 | 2.89 | 4.65 | ||||||||
| 2.84 | |||||||||||||||||
| 2007 Jan 12 | EddThe addition of a red-shifted oxygen edge improves the fit significantly. | 0.93 | 1.96 | 1843.7 | 1708 | 4.87 | 1.27 | 3.50 | 8.73 | ||||||||
| 3.32 | |||||||||||||||||
| Mrk 231 | 2000 Oct 19 | D | 0.69 | 1.78 | 3.03 | 0.76 | 45.10 | 0.77 | 87.7 | 89 | 8.74 | 68.17 | 4.95 | 7.88 | |||
| 2001 Jun 7 | D | 0.49 | 1.44 | 8.34 | 0.76 | 6.43 | 0.21 | 0.40 | 139.4 | 133 | 10.22 | 63.50 | 1.39 | 3.54 | |||
| 2003 Feb 3 | D | 0.80 | 1.87 | 3.75 | 0.80 | 30.87 | 0.70 | 82.1 | 91 | 9.08 | 61.54 | 4.25 | 5.82 | ||||
| 2003 Feb 11 | D | 0.65 | 1.16 | 8.03 | 0.75 | ddThe addition of a red-shifted oxygen edge improves the fit significantly. | 101.3 | 95 | 8.62 | 66.15 | 1.00 | 3.56 | |||||
| 2003 Feb 20 | B | 0.66 | 0.25 | eeThe addition of this absorption component does improve the fit, but not significantly. | ddThe addition of a red-shifted oxygen edge improves the fit significantly. | 76.31 | 79 | 8.15 | 80.22 | 0.35 | 3.31 | ||||||
| Mrk 273 | 2000 Apr 19 | D | 0.86 | 1.63 | 41.29 | 6.31 | 0.00 | 0.23 | 67.3 | 85 | 7.08 | 82.12 | 5.28 | 10.73 | |||
| 2002 May 7 | D | 0.70 | 1.86 | 59.32 | 6.49 | 0.25 | 0.67 | 115.4 | 89 | 9.07 | 37.20 | 4.29 | 6.44 | ||||
| F134511232 | 2000 Feb 24 | D | 1.55 | 3.95 | 0.97 | 53.4 | 60 | 4.06 | 102.40 | 21.56 | 49.05 | ||||||
| NGC 6240 | 2000 Sep 22 | D | 0.76 | 2.14 | 0.19 | 1.00(f) | 160.66 | 0.98 | 1.83(f) | 0.00(f) | 0.06 | 365.8 | 333 | 62.64 | 188.90 | 60.70 | 59.78 |
| 6.40(f) | 0.00(f) | 0.28 | |||||||||||||||
| 6.67(f) | 0.00(f) | 0.11 | |||||||||||||||
| 7.01(f) | 0.00(f) | 0.00 | |||||||||||||||
| 2001 Jul 29 | D | 0.86 | 2.03 | 0.25 | 1.00(f) | 66.49 | 0.81 | 1.83(f) | 0.00(f) | 0.04 | 250.9 | 203 | 54.98 | 165.81 | 5.69 | 6.95 | |
| 1.94(f) | 0.00(f) | 0.07 | |||||||||||||||
| 2.40(f) | 0.00(f) | 0.09 | |||||||||||||||
| 6.40(f) | 0.00(f) | 0.46 | |||||||||||||||
| 6.67(f) | 0.00(f) | 0.20 | |||||||||||||||
| 7.01(f) | 0.00(f) | 0.13 | |||||||||||||||
| 2002 Mar 12 | D | 0.62 | 2.04 | 0.20 | 1.00(f) | 142.69 | 0.98 | 1.06(f) | 0.00(f) | 0.05 | 219.5 | 171 | 56.02 | 199.13 | 41.04 | 46.02 | |
| 1.83(f) | 0.00(f) | 0.04 | |||||||||||||||
| 6.40(f) | 0.00(f) | 0.17 | |||||||||||||||
| 6.67(f) | 0.00(f) | 0.09 | |||||||||||||||
| 2003 Mar 14 | D | 0.82 | 2.00 | 0.21 | 1.00(f) | 109.25 | 0.94 | 1.83(f) | 0.00(f) | 0.08 | 102.6 | 102 | 55.38 | 190.13 | 17.70 | 21.50 | |
| 6.40(f) | 0.00(f) | 0.22 | |||||||||||||||
| 6.67(f) | 0.00(f) | 0.17 | |||||||||||||||
| 7.01(f) | 0.00(f) | 0.09 | |||||||||||||||
| 2003 Aug 13 | D | 0.82 | 1.82 | 0.14 | 1.00(f) | 146.43 | 0.96 | 1.83(f) | 0.00(f) | 0.04 | 264.1 | 237 | 56.34 | 205.86 | 23.07 | 37.10 | |
| 6.40(f) | 0.00(f) | 0.25 | |||||||||||||||
| 6.67(f) | 0.00(f) | 0.14 | |||||||||||||||
| 7.01(f) | 0.00(f) | 0.03 | |||||||||||||||
| 2003 Aug 21 | D | 0.82 | 1.90 | 0.16 | 1.00(f) | 201.58 | 0.99 | 1.83(f) | 0.00(f) | 0.03 | 120.8 | 111 | 56.91 | 211.91 | 67.26 | 97.67 | |
| 6.40(f) | 0.00(f) | 0.52 | |||||||||||||||
| 6.67(f) | 0.00(f) | 0.07 | |||||||||||||||
| 2003 Aug 29 | D | 0.85 | 1.41 | 0.07 | 1.00(f) | 155.52 | 0.96 | 1.38(f) | 0.00(f) | 0.08 | 36.1 | 51 | 58.15 | 227.68 | 13.50 | 37.89 | |
| 1.83(f) | 0.00(f) | 0.12 | |||||||||||||||
| 6.40(f) | 0.00(f) | 0.20 | |||||||||||||||
Note. — Col.(1): Galaxy name. Coordinate-based names beginning with ”F” are sources in the IRAS Faint Source Catalog. Col.(2): Observation start date. Col.(3): Best-fit continuum model, all modified by Galactic absorption: A = single power law, B = MEKAL only, C = MEKAL plus power law, D = scattering model or partial covering model, E = blackbody plus power law. Col.(4): MEKAL temperature, if applicable, in units of keV. Col.(5): Spectral index of the power law (or reflection) model. Col. (6)–(9): Absorption within the source and corresponding covering fraction for the covering fraction absorber model. The absorption values are in units of cm-2. Col.(10): Rest energy of the emission line(s) in units of keV. Col. (11): Line width(s) of the emssion line(s) in units of keV. Col. (12): Equivalent width(s) of the emission line(s) in units of keV. Col. (13)–(14): Fitting statiscs and degrees of freedom, respectively. Col. (15)–(16): Observed flux after background subtraction in units of 10-14 erg s-1 cm-2. Col. (17)–(18): Nominal absorption corrected luminosities in units of 1042 erg s-1.
| ID | AGN | SE | |
|---|---|---|---|
| (1) | (2) | (3) | (4) |
| A | PL | 8.0 | |
| B | PL + AbsPL | 3.0 | |
| C | PCFPL | 3.4 | |
| D | PCFPCFPL | 1.8 | |
| E | PCFPCFPL | MEKAL | 1.5 |
| F | PL | CompTT | 2.1 |
| G | PL | REFLION (blurred; C06) | 19.9 |
| H | PL | PEXRAV | 3.6 |
| I | PL | PEXRIV | 3.1 |
| J | PL+PEXRAV | zBbody | 1.3 |
| K | PL+PEXRIV | zBbody | 1.2 |
| L | C06 | zBbody | 1.4 |
| M | PL+PEXRIV | zBbody+Zedge | 1.1 |
Note. — Col.(1): Model identifier. Col.(2): Spectral models fitting the AGN component: PL = redshifted power law, AbsPL = absorbed redshifted power law, PCF = partial covering absorber. Col.(3): Spectral models fitting the soft excess (SE) component: CompTT = Comptonization model, REFLION= blurred ionized reflection model of C06, PEXRAV = neutral reflection, PEXRIV = ionized reflection, ZBbody = redshifted blackbody, Zedge = redshifted absorption edge. (4): Reduced from the fits.
| Soft Excess | Power Law | Reflection | ||||||||||
|---|---|---|---|---|---|---|---|---|---|---|---|---|
| Galaxy | ||||||||||||
| () | () | () | () | () | () | () | () | () | () | |||
| (1) | (2) | (3) | (4) | (5) | (6) | (7) | (8) | (9) | (10) | (11) | (12) | (13) |
| PG0050124 | 0.02 | 0.0 | 0.81 | 0.07 | 7.92 | 5.74 | 0.71 | 0.51 | 0.05 | 1.05 | 0.005 | 0.09 |
| PG0838770 | 0.78 | 103.9 | 16.32 | 7.39 | 0.74 | 0.50 | 0.34 | 0.22 | 0.01 | 0.11 | 0.006 | 0.05 |
| PG0844349 | 0.00 | 0.0 | 128.93 | 12.75 | 6.15 | 4.12 | 0.61 | 0.41 | 0.07 | 1.29 | 0.007 | 0.13 |
| PG0953414 | 0.00 | 0.0 | 25.62 | 41.88 | 3.25 | 2.17 | 5.32 | 3.55 | 0.05 | 0.86 | 0.08 | 1.41 |
| PG1001054 | 3.03 | 155.2 | 1.39 | 0.99 | 0.08 | 0.05 | 0.06 | 0.04 | 0.01 | 0.07 | 0.006 | 0.05 |
| PG1004130 | 0.56 | 12.0 | 1.62 | 2.81 | 0.19 | 0.13 | 0.33 | 0.22 | 0.01 | 0.17 | 0.02 | 0.30 |
| PG1116215 | 0.00 | 0.1 | 43.18 | 37.38 | 3.80 | 2.54 | 3.29 | 2.20 | 0.05 | 0.87 | 0.04 | 0.75 |
| PG1126041 | 4.16 | 1.3 | 3.71 | 0.32 | 1.40 | 0.94 | 0.12 | 0.08 | 0.03 | 0.49 | 0.002 | 0.04 |
| PG1211143 | 0.27 | 137.9 | 179.59 | 29.19 | 3.21 | 2.15 | 0.52 | 0.35 | 0.15 | 1.08 | 0.02 | 0.18 |
| PG1229204 | 0.00 | 0.0 | 1.81 | 1.73 | 3.20 | 2.14 | 0.31 | 0.21 | 0.06 | 1.11 | 0.005 | 0.11 |
| PG1244026 | 0.00 | 0.0 | 156.25 | 8.48 | 3.68 | 2.46 | 0.20 | 0.13 | 0.02 | 0.35 | 0.001 | 0.02 |
| PG1307085 | 0.60 | 0.0 | 30.92 | 20.21 | 1.46 | 0.98 | 0.96 | 0.64 | 0.05 | 0.93 | 0.03 | 0.61 |
| PG1309355 | 0.52 | 78.3 | 12.54 | 11.94 | 0.65 | 0.44 | 0.62 | 0.42 | 0.03 | 0.28 | 0.03 | 0.27 |
| PG1351640 | 0.00 | 88.3 | 3.87 | 0.75 | 0.56 | 0.38 | 0.11 | 0.07 | 0.03 | 0.26 | 0.005 | 0.05 |
| PG1411442 | 610.01 | 1.8 | 4.29 | 0.87 | 1.83 | 1.23 | 0.37 | 0.25 | 0.03 | 0.44 | 0.005 | 0.09 |
| PG1426015 | 0.03 | 413.5 | 40.22 | 7.40 | 8.58 | 5.74 | 1.58 | 1.06 | 0.35 | 1.34 | 0.06 | 0.25 |
| PG1435067 | 0.00 | 171.2 | 9.81 | 4.09 | 2.82 | 1.89 | 1.17 | 0.79 | 0.11 | 0.76 | 0.05 | 0.32 |
| PG1440356 | 0.00 | 552.6 | 107.79 | 16.61 | 3.39 | 2.27 | 0.52 | 0.35 | 0.17 | 0.53 | 0.03 | 0.08 |
| PG1448273 | 0.00 | 0.0 | 129.83 | 13.28 | 2.97 | 1.99 | 0.30 | 0.20 | 0.02 | 0.30 | 0.002 | 0.03 |
| PG1501106 | 0.27 | 130.5 | 483.37 | 14.54 | 13.10 | 8.76 | 0.39 | 0.26 | 0.63 | 4.65 | 0.02 | 0.14 |
| PG1613658 | 0.29 | 4.7 | 103.88 | 45.59 | 4.98 | 3.01 | 2.18 | 1.46 | 0.11 | 1.79 | 0.05 | 0.79 |
| PG1626554 | 0.29 | 0.0 | 80.88 | 37.89 | 4.49 | 3.01 | 2.10 | 1.41 | 0.03 | 0.58 | 0.01 | 0.27 |
| PG2130099 | 0.56 | 103.5 | 99.01 | 9.47 | 3.28 | 2.20 | 0.31 | 0.21 | 0.17 | 1.42 | 0.02 | 0.14 |
| B2 220131A | 0.25 | 0.2 | 90.30 | 250.63 | 4.07 | 2.72 | 11.30 | 7.55 | 0.12 | 1.96 | 0.33 | 5.44 |
| PG2214139 | 3.80 | 9.2 | 10.07 | 1.06 | 3.25 | 2.17 | 0.34 | 0.23 | 0.10 | 1.59 | 0.01 | 0.17 |
Note. — Col.(1): Galaxy name. Col.(2): Intrinsic column density in units of 1022 cm-2. Col.(3): Ionization parameter from the PEXRIV component in erg cm s-1. Col.(4): Absorption-corrected 0.5–2 keV flux for the blackbody component in units of 10-14 erg s-1 cm-2. The 2–10 keV flux of this component is 103 smaller, and so is insignificant . Col.(5): 0.5–2 keV luminosity in units of 1042 erg s-1 for the blackbody component. Col.(6)–(7): Absorption-corrected 0.5–2 keV and 2–10 keV flux for the power law component in units of 10-12 erg s-1 cm-2. Col.(8)–(9): Absorption corrected 0.5–2 keV and 2–10 keV luminosity of the power law component in units of 1044 erg s-1. Col.(10)–(11): Absorption-corrected 0.5–2 keV and 2–10 keV flux in units of erg s-1 cm-2 for the reflected component. Col.(12)–(13): Absorption-corrected 0.5–2 keV and 2–10 keV luminosity of the reflected component in units of erg s-1.
| Exposure | Hard | Soft | HR | NH | % error | % error | |||
|---|---|---|---|---|---|---|---|---|---|
| (1) | (2) | (3) | (4) | (5) | (6) | (7) | (8) | (9) | (10) |
| Input | 1.8 | 1.77 | 2.95 | ||||||
| 100 | 139.611.7 | 453.221.2 | –0.530.05 | 1.80 | 1.77 | 0.0 | 2.94 | –0.3 | |
| 75 | 104.710.6 | 339.318.3 | –0.530.05 | 1.80 | 1.77 | 0.0 | 2.94 | –0.3 | |
| 50 | 70.18.1 | 225.615.3 | –0.530.07 | 1.80 | 1.76 | –0.6 | 2.93 | –0.7 | |
| 25 | 35.05.9 | 113.310.6 | –0.530.09 | 1.80 | 1.77 | 0.0 | 2.94 | –0.3 | |
| 20 | 27.95.1 | 90.19.5 | –0.530.10 | 1.80 | 1.76 | –0.6 | 2.92 | –1.0 | |
| 15 | 21.04.6 | 67.88.3 | –0.530.12 | 1.80 | 1.77 | 0.0 | 2.93 | –0.7 | |
| 10 | 14.03.8 | 45.26.6 | –0.530.15 | 1.80 | 1.77 | 0.0 | 2.93 | –0.7 | |
| 5 | 6.92.8 | 22.74.9 | –0.530.21 | 1.80 | 1.77 | 0.0 | 2.94 | –0.3 | |
| 15 | 21.04.6 | 66.47.8 | –0.520.12 | 1.78 | 1.73 | –2.3 | 2.96 | 0.3 | |
| 15 | 21.14.5 | 61.57.7 | –0.490.12 | 1.70 | 1.59 | –10.2 | 3.08 | 4.4 | |
| 15 | 20.84.7 | 55.67.6 | –0.450.13 | 1.62 | 1.43 | –19.2 | 3.12 | 5.8 | |
| 15 | 19.94.4 | 30.45.5 | –0.210.14 | 1.13 | 0.79 | –55.4 | 3.60 | 22.0 | |
| 15 | 18.54.3 | 18.24.4 | 0.010.17 | 0.71 | 0.49 | –72.3 | 4.24 | 43.7 | |
| 15 | 12.23.6 | 1.681.28 | 0.760.34 | –1.04 | 0.05 | –97.2 | 6.30 | 114.6 | |
| 15 | 8.33.0 | 0.20.45 | 0.940.49 | ||||||
| 15 | 1.71.3 | 0.010.06 | 1.001.13 | ||||||
| 15 | 0.50.7 | 0.0010.03 | 1.001.93 |
Note. — Col.(1): Simulated exposure time in ksec. Col.(2): Average counts in the hard band from 1000 simulations. Col.(3): Average counts in the soft band from 1000 simulations. Col.(4): The hardness ratio. Col.(5): Spectral index derived from the hardness ratio method. Col.(6): Input column density from within the source in units of cm-2. Col.(7): Observed 0.5–2 keV flux in units of erg s-1 cm-2 assuming only Galactic absorption. Col.(8): The percent error of the simulated 0.5–2 keV flux relative to that of the input model. Col.(9): Same as (7), but for the 2–10 keV band. Col.(10): Same as (8), but for the 2–10 keV band.