Vortex instability in molybdenum-germanium superconducting films
Abstract
We studied the high driving force regime of the current-voltage transport response in the mixed state of amorphous molybdenum-germanium superconducting films to the point where the flux flow becomes unstable. The observed nonlinear response conforms with the classic Larkin-Ovchinikov picture with a quasiparticle-energy-relaxation rate dominated by the quasiparticle recombination process. The measured energy relaxation rate was found to have a magnitude and temperature dependence in agreement with theory.
pacs:
74.40.Gh, 74.25.Uv, 72.15.Lh, 73.50.Gr, 73.50.FqI Introduction and theory
In a type II superconductor, magnetizing fields between the lower critical field and upper critical field introduce flux vortices containing a quantum of flux . A transport electric current density perpendicular to the vortices and to exerts a “Lorentz” driving force . The consequent vortex motion generates an electric field and is opposed by a viscous drag (where is the coefficient of viscosity and the vortex velocity), so that in steady state and the response is Ohmic as long as the flow is not hindered by pinning. This regime of flux motion corresponds to free flux flow (FFF). While superficially the physics appears simple, and bears resemblance to a hydrodynamic system, this resemblance and apparent simplicity are deceiving. First of all the so-called “Lorentz” force in a superconductor actually has the opposite direction to the usual electromagnetic Lorentz force and while it has the right magnitude , the derivation of this expression is not completely trivial degennes ; tinkhamtext ; narayan ; chen ; castro ; ao . Second the hydrodynamic analogy leads to the expectation that a narrower vortex would have a lower drag coefficient. Under normal circumstances the reality is just the opposite: dissipation in and around the core of a vortex arises from generated electric fields acting upon normal quasiparticles leading to Ohmic dissipation bs and from irreversible entropy transfer occurring between the leading and trailing edges of moving vortices tinkham . These dissipative processes increase with the order-parameter gradient so that is roughly inversely proportional to the vortex core area. Thus under normal circumstances drops as the the vortex expands and hence the flux-flow resistance goes up with temperature unstable ; vodolazov .
The Ohmic FFF regime discussed above ceases as and are increased to high values that alter the superconducting state. If the electron-electron scattering time is short compared to the the electron-phonon scattering time , the distribution function of the quasiparticles becomes thermalized and a finite power dissipation density simply raises the electron temperature to a value above the phonon and substrate temperatures, and respectively. This causes an expansion of the vortex core and a drop in viscosity leading to a non-monotonic (“N” shaped) curve and a consequent instability. Such a hot-electron instability model was developed and experimentally verified by us in our earlier work unstable ; eprelax .
A more intricate scenario, proposed by Larkin and Ovchinnikov lopaper ; lochapter (LO), arises when . In this case the quasiparticle distribution function acquires a non-thermal shape and the vortex dynamics are altered in a complicated and less obvious way. At high the quasiparticle population in the core reduces while it increases outside the core, thus causing the vortex to shrink while simultaneously reducing the contrast in quasiparticle density between the two regions. Thus the gradient in the order parameter is not boosted to the extent anticipated by the reduced vortex size. In the meanwhile, the diminished quasiparticle population in the core tends to lessen the dissipation and reduce the drag. Thus overall declines despite the shrinking in size with increasing . Like the hot-electron case discussed earlier, this again leads to a non-monotonic curve and a vortex instability. The LO instability has been observed in previous experiments Musienko ; klein ; Doettinger-YBCO ; Samoilov ; zhili-1996 ; Doettinger-MoSi ; ruck ; babic ; armenio ; grimaldi2009 ; grimaldi2010 and the combination of heating effects and the LO mechanism have been considered by various authors bezuglyj ; gurevich_ciovati ; zhili-1998 ; Zhili-1999 ; Peroz .
The relative magnitudes of and govern which mechanism dominates the instability. Standard estimates abrikosov_metals for the scattering times = and = (where is the Debye temperature and is the phonon reflection coefficient at the film-substrate interface arising from acoustic mismatch) give a cross-over temperature of . In the present work, we investigated amorphous molybdenum-germanium (MoGe) films, which have (estimating from known parameters carter ; graybeal ) =260 K and eV, and thus have K. Since , will be well below the temperature range of our experiment (3–6 K). Thus we expect the non-linear response to be dictated by the LO mechanism, which is indeed born out by our data.
In the LO theory, the non-linear flux-flow conductivity at high is given by (Eqs. 38 and 53 of Ref. lopaper, )
| (1) |
in terms of the free-flux-flow value of the linear regime ( limit in the absence of pinning) and the critical electric field at which attains its maximum value before the curve enters a region of negative differential conductivity. is the reduced temperature ( is the superconducting transition temperature), is an unknown constant of order unity, and is given by
| (2) |
where is the diffusion constant, is the Riemann zeta function, and is the energy relaxation time.
In our previous work unpinned we found that the expressions for in reference lochapter, (their Eqs. 22 and 30) did not fit the data well over a significant range. Instead the following expression unpinned
| (3) |
based on the mean-field result of time-dependent Ginzburg Landau (TDGL) theory schmid ; caroli ; vecris ; ullah ; dorsey ; troy , more accurately represented the behavior over an extended range; here is the reduced magnetic field ( is the upper critical magnetizing field) and is a dimensionless constant. The right hand side of Eq. 3 represents a two-fluid-model sum of the normal conductivity and the flux-flow conductivity contribution. The first term is negligible compared to the second term for the range of conditions where we study the LO nonlinear effect (i.e., our mixed-state conductivity is far higher than the normal conductivity) and also the term remains constant and is not affected by and fields. Thus combining Eq. 1 with the second term of Eq. 3 gives the following nonlinear relationship
| (4) |
Note that this non-linear function is only valid until the vortex stops shrinking, which occurs at a field lochapter . At very high the system eventually enters the normal state and then .
II Experimental techniques
The samples A, B, and C used in this experiment are exactly the same as the samples A, B, and C used in our prior work on free flux flow unpinned . The samples consist of MoGe films of thickness nm sputtered onto silicon substrates with 200 nm thick oxide layers using an alloy target of atomic composition Mo0.79Ge0.21. The deposition system had a base pressure of Torr and the argon-gas working pressure was maintained at 3 mTorr during the sputtering. The growth rate was 0.15 nm/s. The samples were patterned into bridges of length m and width m using photolithography and argon ion milling. Some parameters of the samples are as follows: Sample A: =5.56 K, =555 , =-3.13 T/K and cm2/s. Sample B: =5.41 K, =555 , =-3.13 T/K and cm2/s. Sample C: =5.01 K, =630 , =-3.0 T/K and cm2/s. Here, is the normal-state resistance, is the upper-critical-field slope, and the diffusion coefficient D was calculated from gorkov1959 .
The cryostat was a Cryomech PT405 pulsed-tube closed-cycle refrigerator that went down to about 3.2 K. It was fitted inside a 1.3 Tesla GMW 3475-50 water-cooled copper electromagnet. Calibrated cernox and hall sensors monitored and respectively. The electrical transport measurements were made with an in-house built pulsed current source, preamplifier circuitry, and a LeCroy model 9314A digital storage oscilloscope. The pulse durations are 20 s or less, with duty cycles in the few ppm range to reduce macroscopic heating of the film. Our previous review papers pbreview ; mplb give further details about the measurement technique and the thermal analysis.
III Data and analysis
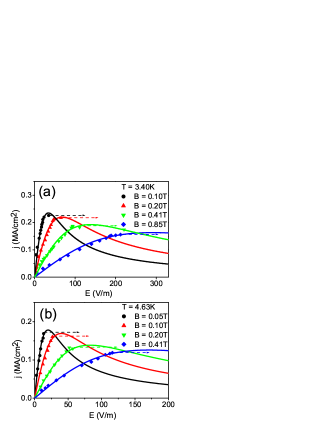
Fig. 1 shows some examples of nonlinear curves. (and hence the viscous drag force) has a local maximimum value of at the instability field . In a current biased circuit, where the source resistance is larger than the sample resistance as is the case here, jumps (indicated by arrows) upon increasing to the vicinity of the intrinsic . In a voltage biased measurement, where the source resistance is lower than the sample’s, the there will not be a jump in and instead will be seen to decrease. The macroscopically averaged behavior will have a negative and the flux matter fragments into compressional steps , shear shear or other types of elastic domains such that any given domain is moving in a response region with locally. The macroscopic curve will then not follow the primitive curve (e.g., Eq. 4) but will show steps in the region where . In the present experiment we are only concerned with the region of the transport response up to where macroscopically.
The solid lines in Fig. 1 are fits to Eq. 4 and are seen to follow the trends of the data. The parameters and (location of peak) were adjusted to improve the fits, but have fit values of the expected magnitudes: and from the peaks is slightly higher than the position of the actual jumps, which is to be expected and has been observed by others (e.g., reference babic, ). For subsequent analysis, we take to be the actual measured value of at the threshold of the jump.
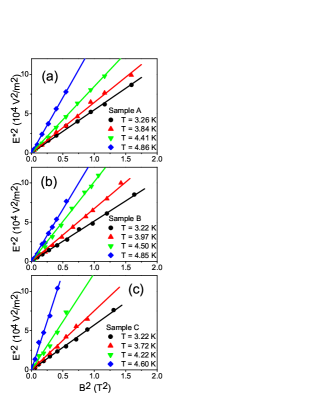
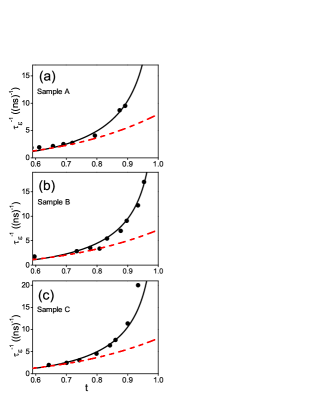
Fig. 2 plots 2, obtained from the curves as discussed above, against . In agreement with Eq. 2, the two quantities are directly proportional to each other (i.e., the critical vortex velocity =/ is independent of ). From the measured slope and Eq. 2, we obtain the energy relaxation time . Fig. 3 plots the corresponding relaxation rate against the reduced temperature for each of the three samples.
As discussed in the introduction, the LO effect occurs when is long compared with , resulting in a non-thermal shape of the quasiparticle distribution function. The extent of the distribution function distortion is controlled by the rate of energy relaxation from quasiparticles to phonons, which occurs through two processes: one process is the inelastic scattering between a quasiparticle and a phonon and the other is the recombination of two quasiparticles to form a Cooper pair with the emission of a phonon. As discussed by Kaplan et al. kaplan , the energy relaxation is mainly dominated by the latter recombination process which has a rate that can be written as:
| (5) |
where is a temperature independent characteristic time constant (in the terminology of Kaplan et al. kaplan , ) and is the temperature dependent superconducting energy gap. Taking the BCS (Bardeen-Cooper-Schrieffer) temperature dependence for we are able to fit the data in Fig. 3 with Eq. 5 (solid lines) with s. As can be seen, the measured functional form of is in agreement with Eq. 5. While there is insufficient information in the literature to theoretically compute the magnitude of for comparison, Table I of Reference kaplan, lists values of () for various other materials. Although there is an enormous range in —from to s for various materials—it is interesting to observe that tantalum with about the same (4.5 K) and (240 K) as MoGe (for which 5.3 K and 260 K) has a value of ( s) that is comparable to the one we obtained for MoGe ( s). ( and are parameters that are indicative of the electron-phonon coupling and phonon density of states respectively.) If quasiparticle-phonon scattering is the dominant relaxation process, rather than quasiparticle recombination, then the rate is given by a function of the form kaplan instead of Eq. 5. This power-law function (taken with an adjustable constant of proportionality ) is plotted as dashed red lines on Fig. 3 and is clearly at odds with the data. Thus our study of the vortex instability is able to distinguish the two routes of energy decay and provides a confirmation of the recombination rate expression of Eq. 5.
IV Conclusions
In conclusion, we have studied the high driving force regime of vortex dynamics in one of the simplest and nearly model superconductors (unpinned, isotropic, low-temperature, weak-coupling BCS, etc.). In recent work unpinned we found that for the FFF regime these MoGe films provided a detailed confirmation of the TDGL mean-field prediction for , while the LO expressions for the same regime showed very limited applicability. On the other hand in the present work we find that the LO expression (Eq. 1) for the nonlinear modulation factor for and the LO result (Eq. 2) for the relationship between the instability electric field and the energy relaxation time , are well obeyed in this system. Furthermore we were able to distinguish between the two principal quasiparticle-phonon energy relaxation processes and confirm the predicted temperature dependence (Eq. 5) for the recombination process. Both regimes of instability, the hot-electron as well as the distribution-function type, thus provide a valuable tool for investigating key scattering processes through the response of the mixed state.
V Acknowledgements
The authors gratefully acknowledge Jiong Hua, Zhili Xiao, James M. Knight, and Boris I. Ivlev. This work was supported by the U. S. Department of Energy through grant number DE-FG02-99ER45763.
References
- (1) Michael Tinkham, Introduction to superconductivity, New York, McGraw-Hill (1996).
- (2) P. G. de Gennes, Superconductivity of Metals and Alloys, New York, W.A. Benjamin (1966).
- (3) O. Narayan, Journal of Physics A 36, L373 (2003).
- (4) D.-X. Chen, J. J. Moreno, A. Hernando, A. Sanchez, and B.-Z. Li, Phys. Rev. B57, 5059 (1998).
- (5) J. I. Castro and A. Lopez, J. of Low Temp. Phys. 135, 15 (2004).
- (6) P. Ao and D. J. Thouless, Phys. Rev. Lett. 70, 2158 (1993).
- (7) J. Bardeen and M. J. Stephen, Phys. Rev. 140, A1197 (1965).
- (8) M. Tinkham, Phys. Rev. Lett. 13, 804 (1964).
- (9) M. N. Kunchur, Phys. Rev. Lett. , 89, 137005 (2002).
- (10) D. Y. Vodolazov and F. M. Peeters, Phys. Rev. B76, 014521 (2007).
- (11) J. M. Knight and M. N. Kunchur, Phys. Rev. B 74, 064512 (2006).
- (12) A. I. Larkin and Yu. N. Ovchinnikov, Zh. Eksp. Teor. Fiz. 68, 1915 (1975). [Sov. Phys. JETP 41, 960 (1976)].
- (13) A. I. Larkin and Yu. N. Ovchinnikov, in Nonequilibrium Superconductivity, D. N. Langenberg and A. I. Larkin, eds. (Elsevier, Amsterdam, 1986), Ch. 11.
- (14) L. E. Musienko, I. M. Dmitrenko, and V. G. Volotskaya, Pis’ma Zh. Eksp. Teor. Fiz. 31, 603 (1980) [JETP Lett. 31, 567 (1980)].
- (15) W. Klein, R. P. Huebener, S. Gauss, and J. Parisi, J. of Low Temp. Phys. 61, 413 (1985).
- (16) S. G. Doettinger, R. P. Huebener, R. Gerdemann, A. Kühle, S. Anders, T. G. Träuble, and J. C. Villégier, Phys. Rev. Lett. 73, 1691 (1994).
- (17) A. V. Samoilov, M. Konczykowski, N.-C. Yeh, S. Berry, and C. C. Tsuei, Phys. Rev. Lett. 75, 4118 (1995).
- (18) Z. L. Xiao and P. Ziemann, Phys. Rev. B53, 15265 (1996).
- (19) S. G. Doettinger, S. Kittelberger, R. P. Huebener, and C. C. Tsuei Phys. Rev. B56, 14157 (1997).
- (20) B. J. Ruck, H. J. Trodahl, J. C. Abele, and M. J. Geselbracht, Phys. Rev. B62, 12468 (2000).
- (21) D. Babić, J. Bentner, C. Sürgers, and C. Strunk, Phys. Rev. B69, 092510 (2004).
- (22) A. A. Armenio, C. Bell, J. Aarts, and C. Attanasio, Phys. Rev. B76, 054502 (2007).
- (23) G. Grimaldi, A. Leo, A. Nigro, S. Pace, and R. P. Huebener, Phys. Rev. B80, 144521 (2009).
- (24) G. Grimaldi, A. Leo, D. Zola, A. Nigro, S. Pace, F. Laviano and E. Mezzetti, Phys. Rev. B82, 024512 (2010).
- (25) A. I. Bezuglyj and V. A. Shklovskij, Physica C 202, 234 (1992).
- (26) A. Gurevich, and G. Ciovati, Phys. Rev. B77, 104501 (2008).
- (27) Z. L. Xiao, P. Voss-de Haan, G. Jakob, and H. Adrian, Phys. Rev. B57, R736 (1998).
- (28) Z. L. Xiao, P. Voss-de Haan, G. Jakob, Th. Kluge, P. Haibach, H. Adrian, and E. Y. Andrei, Phys. Rev. B59, 1481 (1999).
- (29) C. Peroz and C. Villard, Phys. Rev. B72, 014515 (2005).
- (30) A. Abrikosov, Fundamentals of the Theory of Metals, North-Holland, Amsterdam (1988).
- (31) W. L. Carter, Ph.D. thesis, Stanford University, 1983.
- (32) J. M. Graybeal, Ph.D. thesis, Stanford University, 1985.
- (33) M. Liang, M. N. Kunchur, J. Hua, and Z. Xiao, Phys. Rev. B82, 064502 (2010).
- (34) A. Schmid, Phys. Kondens. Mater. 5, 302 (1966).
- (35) C. Caroli and K. Maki, Phys. Rev. 164, 591. (1967).
- (36) G. Vecris and R. A. Pelcovits, Phys. Rev. B44, 2767 (1991).
- (37) S. Ullah and A. T. Dorsey, Phys. Rev. B44, 262 (1991).
- (38) A. T. Dorsey, Phys. Rev. B46, 8376 (1992).
- (39) R. J. Troy and A. T. Dorsey, Phys. Rev. B 47, 2715 (1993).
- (40) L. P. Gorkov, Zh. Eksp. Teor. Fiz. 36, 1918 (1959) [Sov. Phys.—JETP 9, 1364 (1959); L. P. Gorkov, Zh. Eksp. Teor. Fiz. 37, 1407 (1959) [Sov. Phys.—JETP 10, 998 (1960)].
- (41) M. N. Kunchur, Mod. Phys. Lett. B 9, 399 (1995).
- (42) M. N. Kunchur, J. Phys.: Condens. Matter 16, R1183-R1204 (2004).
- (43) M. N. Kunchur, B.I. Ivlev, and J. M. Knight, Phys. Rev. Lett. 87, 177001 (2001).
- (44) M. N. Kunchur, B.I. Ivlev, and J. M. Knight, Phys. Rev. B 66, 060505 (2002).
- (45) S. B. Kaplan, C. C. Chi, D. N. Langenberg, J. J. Chang, S. Jafarey, and D. J. Scalapino, Phys. Rev. B14, 4854 (1976).