Rotation and multiple stellar population in globular clusters
Abstract
We investigate structure and kinematics of the second generation of stars (SG) formed from gaseous ejecta of the first generation of stars (FG) in forming globular clusters (GCs). We consider that SG can be formed from gaseous ejecta from AGB stars of FG with the initial total mass of to explain the present masses of the Galactic GCs. Our 3D hydrodynamical simulations with star formation show that SG formed in the central regions of FG can have a significant amount of rotation ( ). The rotational amplitude of SG can depend strongly on the initial kinematics of FG. We thus propose that some GCs composed of FG and SG had a significant amount of rotation when they were formed. We also suggest that although later long-term ( Gyr) dynamical evolution of stars can smooth out the initial structural and kinematical differences between FG and SG to a large extent, initial flattened structures and rotational kinematics of SG can be imprinted on shapes and internal rotation of the present GCs. We discuss these results in terms of internal rotation observed in the Galactic GCs.
1 Introduction
A growing number of observations have revealed strong evidence for the presence of multiple stellar populations in some of the Galactic GCs (e.g., Bedin et al. 2004; Piotto et al. 2005, 2007; Lee et al. 2007; Ferraro et al. 2009; Lee et al. 2009; Yong et al. 2009). The observed Na-O and Mg-Al anti-correlations and the possible existence of very helium-rich stars (Y ) in some massive GCs like NGC 2808 and Cen are suggested to be due to the secondary formation of stars (i.e., SG) from gaseous ejecta from FG that had already formed well before SG formation (e.g, Carretta et al. 2010). Many previous works strongly suggested that the original masses of FG should be at least 10 times more massive than the present masses of GCs in order to explain the observed large mass fraction of SG (e.g., Bekki & Norris 2006; Prantzos & Charbonnel 2006).
If GCs originate from stellar systems with at least larger than , whether they are very massive super-star clusters or dwarf galaxies themselves (e.g., Bekki & Norris 2006), then it should be clarified how such massive systems (i.e., FG) form new stars within them and evolve with the new stars (e.g., SG). D’Ercole et al. (2008) first showed that SG can be formed from the gaseous ejecta of AGB stars of FG with and the large fraction of FG stars in a forming GC can be lost owing to expansion and tidal stripping of FG. However ,their models are based on one-dimensional hydrodynamical simulations and have limitations in predicting 3D structures and kinematics of final stellar systems. Given that kinematical properties dependent on different stellar populations have been already derived in Cen with multiple stellar populations (e.g., Norris et al. 1997; Sollima et al. 2005) and will be done in other massive GCs in future, it is crucial for theoretical studies to predict kinematical properties of SG and FG separately.
The purpose of this Letter is to show that structural and kinematical properties of SG can be significantly different from those of FG based on self-consistent 3D hydrodynamical simulations on star formation within forming GCs. In particular, we show that if originally very massive GCs (FG) have only a small amount of rotation, then new stars (SG) formed in the central regions can have a significant amount of rotation depending on initial kinematics of FG. Based on these results, we point out that the origin of internal rotation observed in the Galactic GCs can be closely associated with formation processes of SG in original massive stellar systems which can be either very massive super star clusters or dwarf galaxies.
Our future works will investigate chemical abundances of SG and long-term evolution of the simulated “nested structures” of original GCs. In the present paper, we do not discuss the following two key issues on multiple stellar populations of GCs: (i) whether massive rotating stars or AGB ones are responsible for the formation of SG in GCs and (ii) how chemical evolution of the clusters proceeds in their host dwarf galaxies, both of which have been extensively discussed elsewhere (e.g., D’Antona et al. 2002; Prantzos & Charbonnel 2006; Bekki 2006; Bekki et al. 2007; Renzini 2008; Ventura et al. 2008; Carretta et al. 2010).
2 The model
We consider that (i) the present GC is composed of FG and SG, (ii) SG can be formed from gaseous ejecta of AGB stars of FG, (iii) the initial total mass of FG (i.e., a massive stellar system) should be much larger than the typical mass of the Galactic GC (), and (iv) FG can lose most stars during later dynamical evolution so that the final mass of a GC can be as small as the observed typical mass of the present GCs. Such initially very massive stellar systems are referred to as “clusters” just for convenience, though their stellar masses are as massive as those of dwarf galaxies.
We investigate dynamical evolution and star formation of gaseous ejecta from AGB stars in FG with the total mass () ranging from to by using the latest version of GRAPE (GRavity PipE, GRAPE-7) which is the special-purpose computer for gravitational dynamics (Sugimoto et al. 1990). We have revised our original GRAPE-SPH code (Bekki 2009) so that we can investigate star formation processes within the above-mentioned massive stellar system; the details of this new code will be described in future papers (e.g., Bekki 2010).
We adopt the Plummer model with the initial total mass of and the size of for FG. FG is represented by stellar particles and some fraction of the particles are assigned as “AGB stars” with initial masses of that can eject SPH gas particles with ejection velocities of with respect to the centers of the AGB stars. We consider that gaseous ejecta only from massive AGB stars with initial masses of need to be converted into new stars (i.e., SG) to explain the chemical abundances of SG (e.g., Renzini 2008). In the present paper, =20 km s-1 is adopted, which is a reasonable choice for massive AGB stars (e.g., D’Ercole et al. 2008).
The present simulations can not resolve gaseous evolution of each individual AGB star owing to the adopted numerical resolution ( pc). We therefore assume that each AGB particle initially has an expanding gaseous sphere which is much larger than the AGB star itself. The mass, size, and temperature of the large gaseous sphere (represented by SPH particles) are set to be , and , respectively. We consider that AGB wind can cool down during expansion throughout interstellar space (due to radiative cooling) so that can becomes much smaller than the original temperature of the wind ( 1000K) when the size of the gaseous sphere of the wind become as large as (which is pc). Thus we mainly show the results of the models with K corresponding to warm molecular clouds in star-forming regions (e.g., Wilson et al. 1997).
In order to estimate corresponds to the total mass ejected from each AGB star after the main-sequence turn-off, we use the formula given by Gnedin et al. (2002) to derive as follows:
| (1) |
The above equation means that about 83% of a AGB particle with can be ejected to be used for further star formation in the present model. In order to estimate the mass fraction () of AGB progenitor stars with masses ranging from to in FG with the total mass of , we assume an IMF in number defined as , where is the initial mass of each individual star and the slope corresponds to the Salpeter IMF. The normalization factor is a function of , (lower mass cut-off), and (upper one). A is expressed as , where and are set to be and , respectively. We adopt the Salpeter IMF and therefore in the present study.
We investigate whether the gas accumulated in the central regions of FG can be sufficient to form new stars by adopting a simple prescription for star formation. In the models with “star formation”, a gas particle is converted into a collision less new stellar one if the gas particle meets the following three conditions: (i) the dynamical time scale of the SPH gas particle is shorter than the sound crossing time , (ii) the gas is converging (i.e., , where is the velocity vector of the gas particle), and (iii) the local gas density exceeds densities for dense cores of molecular clouds ( atoms cm-3). The first two conditions mimic the Jeans gravitational instability for gaseous collapse.
The initial stellar system (FG) is assumed to have a small amount of rotation with the ratio of the initial rotational energy () to the total kinetic one () being a free parameter represented by . The parameter values of range from 0 (no rotation) to 0.2 (rapid rotation). The initial rotational velocity of a particle at a distance of from the center of FG is , where (constant angular velocity) is determined such that can be the adopted value. Therefore, the system has random kinetic energy of (due to isotropic velocity dispersion of stars).
We mainly describe the results of the “standard” model with , pc, and , though we have investigated models with different , , and . This is because SG can have a total mass () and a half-mass radius of SG ( pc) that are similar to those of the typical Galactic GCs. The above parameter set is similar to that adopted in D’Ercole et al. (2008) so that the results of our 3D models can be compared with those of 1D ones by D’Ercole et al. (2008). In the present paper, we focus on the models with (with different ). In our future papers (Bekki 2010, in preparation), we describe in detail how structures and kinematics of SG depend on , , , and threshold gas density for star formation.
3 Results
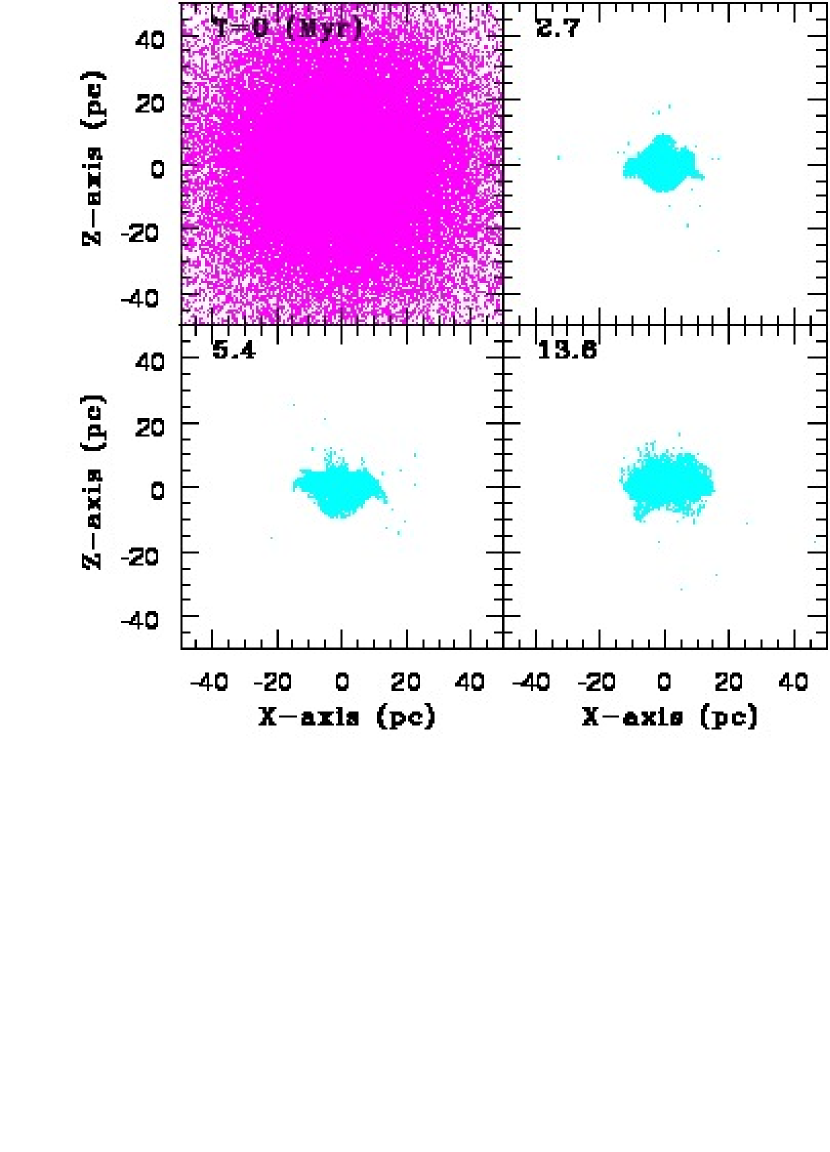
Figure 1 shows that new stars (SG) can be formed from gas ejected from FG in the central region of the original massive cluster with and pc (T=2.7Myr). The star formation rate becomes its maximum of yr-1 at T=1.1 Myr then rapidly declines to be well less than yr-1 at Myr. The starburst with the star formation rate larger than 0.1 yr-1 can last only for Myr. The half of the initial gas can be converted into new stars within the first 3 Myr (Myr) and about 61% of the gas can be finally converted into the stars within 13.6 Myr. This short-term starburst during SG formation can be seen in all of the models in the present study.
The half-mass radius () of the final cluster is 24.5pc for FG and 6pc for SG, if we consider all particles with pc in the simulation: it should be noted here that can become significantly smaller after stripping of stars and new stars in later dynamical evolution within a galaxy hosting the cluster. The ratio of SG to FG is , which means that SG is significantly more concentrated in the inner region of the cluster. Owing to gaseous dissipation, the gas accreting onto the central region of the cluster can form a flattened and rapidly rotating disk, where new stars can form if local gas densities exceeds the adopted threshold gas density for star formation (= atoms cm-3). Thus, the new stars (SG) can finally have a flattened spatial distribution in the central region of the cluster.
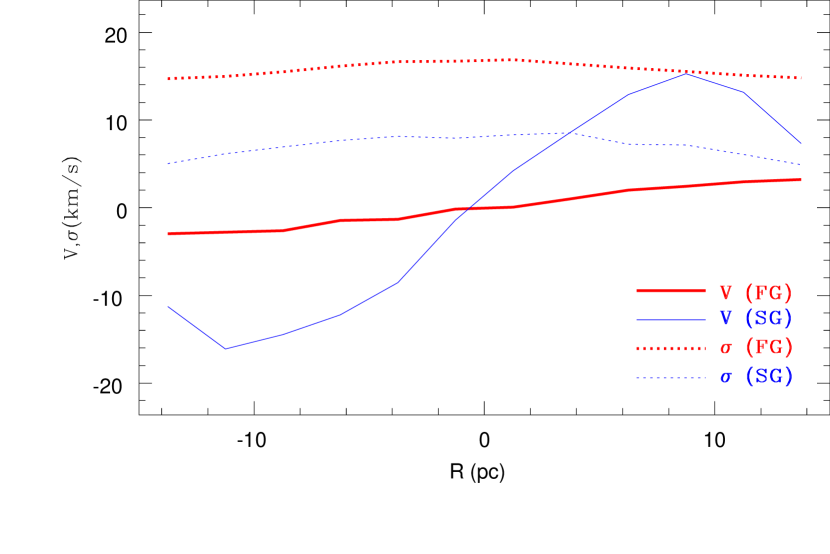
Figure 2 shows that there are significant differences in rotation () and velocity dispersion () profiles in the inner cluster (pc) between FG and SG. The maximum value of () for FG and SG are 3.2 km s-1 and 15.3 km s-1, respectively, which clearly demonstrates that the simulated SG is strongly rotating. The maximum value of () for FG and SG are 16.7 km s-1 and 7.9 km s-1, respectively, which means that for FG and SG are 0.19 and 1.93, respectively. The formation of the dynamically cold and rotating SG is due largely to gaseous dissipation during gas accretion onto the cluster center. These results clearly suggest that initial kinematical properties can be significantly different between FG and SG in forming GCs.
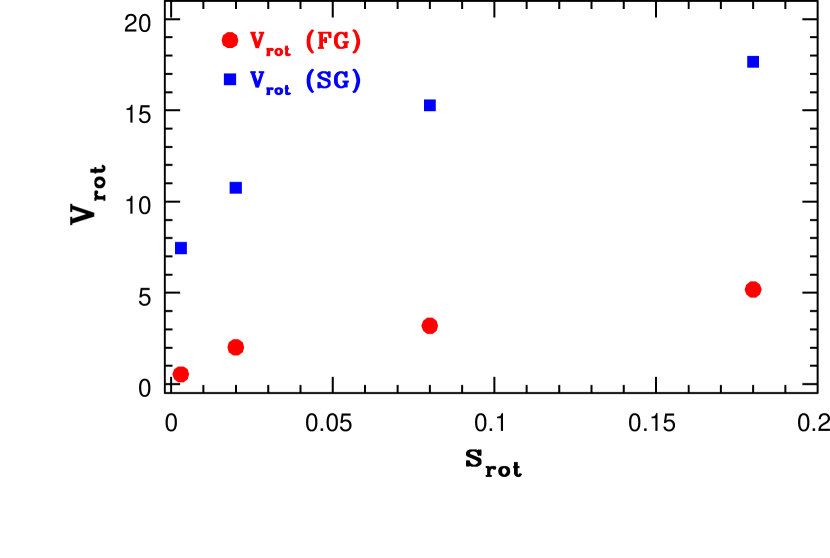
Figure 3 shows that of SG strongly depends on of FG in such a way that is larger for larger (i.e., a larger ratio of rotational energy to total kinetic one for FG). This result suggests that the original rotational properties of FG in a cluster can determine rotational amplitude of SG in the cluster. It is found that of SG is higher for larger : it is 0.75 for and 2.53 for . All of the four models with different show less than 10 km s-1, which means that SG is dynamically cold in forming clusters. It should be stressed here that even in the model with a very small (=0.003), the final SG shows a significant amount of rotation ( km s-1). This suggests that only a small amount of rotation in FG would be necessary to form rotating SG in a forming GC.
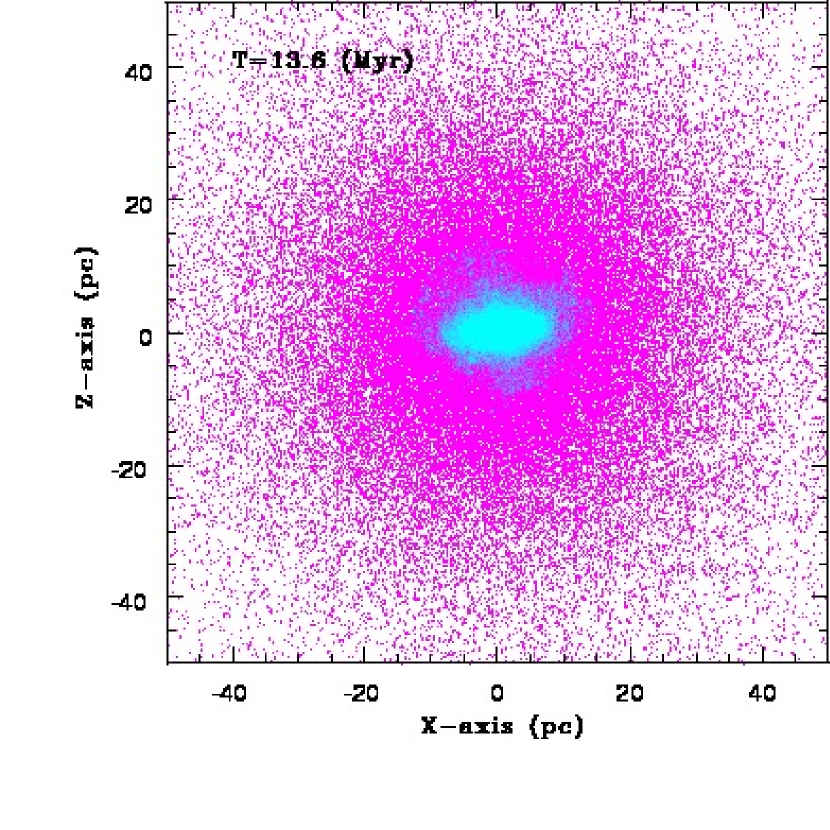
The final distributions of new stars (SG) also depend on such that they can be more flattened in models with larger . Figure 4 shows that the final shape of SG in the model with appears to be significantly flattened, though it is less flattened than the model with (shown in Figure 1). This result suggests that only a small amount of rotation of FG can result in a significantly flattened distribution of SG. It is also found that (i) gas from FG can be more efficiently converted into new stars (SG) in models with smaller and (ii) final distributions of SG are more compact in models with smaller . These results suggest that internal rotation of FG can play a role in determining structural and kinematical properties of SG in forming GCs.
4 Discussion and conclusions
We have shown that SG can have significantly flattened and compact spatial distributions and be rotating in the central regions of FG. These distinct nested structures with inner flattened components with rotation in original GCs composed of FG and SG are not observed in the present Galactic GCs. This means that later long-term ( Gyr) dynamical evolution needs to smooth out the originally nested systems with rotation to a large extent. Recent theoretical study has shown that the initially nested structures of GCs can evolve into structurally homogeneous systems due to two-body relaxation and tidal force of GCs’ host galaxies within two relaxation timescales (Decressin et al. 2008). The FG of GCs can lose most of their stars due to long-term dynamical relaxation processes and tidal stripping whereas SG can remain the same owing to the more compact distributions: the final (=present) GCs can be as massive/small as the observed ones (D’Ercole et al. 2008).
Owing to the lack of numerical simulations on dynamical evolution of nested stellar systems with flattened rotating components, it is impossible to discuss the dynamical fate of the simulated stellar systems in the present study. A large particle number () is required for investigating this for the originally very massive systems with in a fully consistent manner and thus is currently beyond our reach (See Vesperini 2010 for a comprehensive review on short- and long-terms dynamical relaxation processes of evolving GCs). However it is no doubt that our future more sophisticated high-resolution simulations will investigate whether the simulated nested systems can finally become those similar to the present GCs both in structures and kinematics.
Previous observations investigated structural and kinematical differences between stellar populations with different chemical abundances in the most massive Galactic GC Cen (e.g., Norris et al. 1997; Ferraro et al. 2002; Sollima et al. 2005, 2007; Pancino et al. 2007). For example, Sollima et al. (2005, 2007) found that (i) stars with possibly large helium abundances (Y) have a significantly more compact spatial distribution and (ii) intermediate-metallicity populations are kinematically cooler than others. The present study implies that these structurally and kinematically distinct populations would be imprint of SG formation processes driven by gas dynamics in forming GCs. Structural and kinematical differences between FG and SG for normal GCs in the Galaxy have not been extensively investigated so far: it is worthwhile for future observations to confirm whether or not SG in the present GCs show more compact spatial distributions with a larger amount of rotation in comparison with those of FG, in particular, for more massive GCs.
Although evolution of initially flattened clusters into more spherical present GCs has been discussed in many authors (e.g., Frenk & Fall 1982; Einsel & Spurzem 1999), the origin of possibly flattened shapes of GCs at their birth have not been discussed extensively. Binary clusters formed from collisions of giant molecular clouds (GMCs) in the LMC (Bekki et al. 2004) can finally merge to form flattened single clusters. Bekki and Mackey (2009) recently have shown that merging between GMCs and star clusters can end up with formation of new stars with very flattened stellar distributions. The present results imply that if FG in original GCs can be lost to a much larger extent than SG (with initially very flattened shapes) owing to more diffuse stellar distributions of FG, as shown in D’Ercole et al. (2008), then the GCs can finally look like more flattened.
Non-cylindrical differential rotation with the maximum rotational velocities of 8.0 km s-1 at 3-4 core radii for Cen and 6.5 km s-1 at 11-12 core radii for 47 Tuc were revealed by Meylan & Mayer (1986). The internal rotation with 5.7 km s-1 at a radius of 7.5 pc for 47 Tuc was derived by Anderson & King (2003) using the Hubble Space Telescope (HST). The Galactic GC M15 is observed to have an inner flattened component with possible rotation (e.g., van den Bosch et al. 2006). The observed ranges from 0.01 to 0.50 for the sampled 12 Galactic GCs, and the mean is (e.g., Meylan & Heggie 1997). However it remains observationally unclear whether SG stars in the Galactic GCs have rotational kinematics.
Recently structural and kinematical differences between the blue (bMS) and red (rMS) sequence stars in Cen have been investigated in detail by a number of authors (e.g., Sollima et al. 2007; Bellini et al. 2009; Anderson & van der Marel 2010). Given that the bMS stars are suggested to form from AGB ejecta of rMS ones (e.g., Bekki & Norris 2006), they correspond to SG in the present study and thus their rotational properties can be discussed using the present results on rotational properties of SG. Although recent observational results by Anderson & van der Marel (2010) which show clear internal rotation in the bMS stars of Cen are consistent with the present scenario, their results on the rotation amplitude of the rMS stars similar to that of the bMS can not be simply explained by the present scenario. It would be possible that initial kinematical differences between the bMS and rMS stars (i.e., more rotation in the bMS) could have diminished owing to long-term dynamical evolution within Cen.
Given that the bulk of the GCs’ present populations (typically 67%) are observationally demonstrated to be from SG (e.g., Carretta et al. 2010), the origin of internal rotation of the GCs can be closely associated with the formation of rotating SG. The present simulations have shown that the rotation of SG is due largely to dissipative accretion processes of AGB ejecta from FG with initially a small amount of rotation. Therefore the origin of the observed rotation of GCs can be closely associated with rotation in the “lost generation” of stars (i.e., FG) and thus with rotation of GMCs hosting FG. We conclude that shapes, rotational properties, and chemical abundances of the present GCs all have fossil information on the very early evolution processes (e.g., star formation and dynamics of gas from FG) in forming GCs.
References
- (1) Anderson, J., & King, I. R. 2003, AJ, 126, 772
- (2) Anderson, J., & van der Marel, R. P. 2010, ApJ, 710, 1032
- (3) Bedin, L. R., Piotto, G., Anderson, J., Cassisi, S., King, I. R., Momany, Y., & Carraro, G. 2004, ApJ, 605, L125
- (4) Bellini, A., Piotto, G., Bedin, L. R., King, I. R., Anderson, J., Milone, A. P., & Momany, Y. 2009, A&A, 507, 1393
- (5) Bekki, K. 2006, MNRAS, 367, L24
- (6) Bekki, K. 2009, MNRAS, 399, 2221
- (7) Bekki, K., Beasley, M. A., Forbes, D. A., & Couch, W. J. 2004, ApJ, 602, 654
- (8) Bekki, K, & Norris, J. E., 2006, ApJ, 637, L109
- (9) Bekki, K. Campbell, S. W. Lattanzio, J. C., & Norris, J. E. 2007, MNRAS, 377, 335
- (10) Bekki, K., & Mackey, A. D. 2009, MNRAS, 394, 124
- (11) Carretta, E., Bragaglia, A., Gratton, R. G., Recio-Blanco, A., Lucatello, S., D’Orazi, V., & Cassisi, S. 2010, A&A, 516, 55
- (12) D’Antona, F., Caloi, V., Montalbaán, J., Ventura, P., & Gratton, R. 2002, A&A, 395, 69
- (13) D’Antona, F., Bellazzini, M., Caloi, V., Pecci, F. F., Galleti, S., & Rood, R. T. 2005, ApJ, 631, 868
- (14) Decressin, T., Baumgardt, H., & Kroupa, P. 2008, A&A, 492, 101
- (15) D’Ercole, A., Vesperini, E., D’Antona, F., McMillan, S. L. W., & Recchi, S. 2008, MNRAS, 391, 825
- (16) Einsel, C., Spurzem, R., 1999, MNRAS, 302, 81
- (17) Ferraro, F. R., Bellazzini, M., & Pancino, E., 2002, ApJL, 573, 95
- (18) Ferraro, F. R., et al. 2009, Nature, 462, 483
- (19) Frenk, C. S., & Fall, S. M. 1982, MNRAS¡ 199, 565
- (20) Gnedin, Oleg Y., Zhao, H., Pringle, J. E., Fall, S. M., Livio, M., & Meylan, G., 2002, ApJL, 568, 23
- (21) Lee, J-W., Kang, Y-W., Lee, J., & Lee, Y-W. 2009, Nature, 462, 480
- (22) Lee Y. W., Gim H. B., & Dinescu D. I. 2007, ApJ, 661, L49
- (23) Meylan, G.; Mayor, M. 1986, A&A, 166, 122
- (24) Meylan, G., & Heggie, D. C. 1997, A&ARv, 8, p1
- (25) Norris, J. E., Freeman, K. C., Mayor, M., & Seitzer, P. 1997, ApJ, 487, L187
- (26) Pancino, E., Galfo, A., Ferraro, F. R., & Bellazzini, M. 2007, ApJ, 661, L155
- (27) Piotto G. et al. 2005, ApJ, 621, 777
- (28) Piotto, G. et al. 2007, ApJ, 661, L53
- (29) Prantzos, N., & Charbonnel, C. 2006, A&A, 458, 135
- (30) Renzini, A. 2008, MNRAS, 391, 354
- (31) Sollima, A., Pancino, E., Ferraro, F. R., Bellazzini, M., Straniero, O., & Pasquini, L. 2005, ApJ, 634, 332
- (32) Sollima, A., Ferraro, F. R., Bellazzini, M., Origlia, L., Straniero, O., & Pancino, E. 2007, ApJ, 654, 915
- (33) Sugimoto, D., Chikada, Y., Makino, J., Ito, T., Ebisuzaki, T., & Umemura, M. 1990, Nature, 345, 33
- (34) van den Bosch, R., de Zeeuw, T., Gebhardt, K., Noyola, E, & van de Ven, G. 2006, ApJ, 641, 852
- (35) Ventura, P., & D’Antona, F. 2008, A&A, 479, 805
- (36) Vesperini, E. 2010, RSPTA, 368, 829
- (37) Wilson, C. D., Walker, C. E., & Thornley, M. D. 1997, ApJ, 483, 210
- (38) Yong, D., Grundahl, F., D’Antona, F., Karakas, A. I., Lattanzio, J. C., & Norris, J. E. 2009, ApJ, 695, L62