observations of the hot spot galaxy NGC 2903
We report on the first deeper X-ray broad-band observation of the hot spot galaxy NGC 2903 obtained with XMM-Newton. X-ray imaging and spectra of the spiral barred galaxy NGC 2903 were obtained from XMM-Newton archival data to study its X-ray population and the conditions of the hot gas in its central region. We investigate the spectral properties of the discrete point-source population and give estimates of their X-ray spectral parameters. By analysing the RGS spectra, we derive temperature and abundances for the hot gas located in its central region. A total of six X-ray point sources (four of them ULX candidates) were detected in the energy range of 0.3–10.0 keV located within the galaxy optical disk. Three out these sources are detected for the first time, and one of them, XMM-NGC2903 X2 with a luminosity of higher than 1039 erg s-1. After fitting three different models, we were able to estimate their luminosities, which are compatible with those of binaries with a compact object in the form of black holes (BHs) rather than neutron stars (NSs). We extracted the combined first-order RGS1 and RGS2 spectra of its central region, which display several emission lines. The spectrum is dominated by a strong O viii Ly emission line along with Ne x Ly and several Fe xvii features. The O vii complex is also significantly detected, although only the forbidden and resonance lines could be resolved. Both O vii and lines seem to be of similar strength, which is consistent with the presence of the collisionally ionized gas that is typical of starburst galaxies. We fitted the spectrum to a model for a plasma in collisional ionization equilibrium (CIE) and the continuum was modelled with a power law, resulting in a plasma temperature of keV and an emission measure cm-3. We also estimated abundances that are consistent with solar values.
Key Words.:
galaxies: individual: NGC~2903 – galaxies: ISM – galaxies: starburst – X-rays: galaxies – X-rays: binaries1 Introduction
Starbursts galaxies are powerful sources of X-ray emission because of their enhanced star formation (SF) activity. Galaxies in the starburst stage appear to be a common phenomenon in the Universe on all distance scales. They possibly share the same X-ray emission processes, hence it is important to investigate these mechanisms in the local systems. The study of X-ray emission from barred galaxies is of particular interest because they are a class of spirals that appear to frequently go through starburst episodes, and its possible association with the knots of SF distributed along their bar and in their circumnuclear regions (CNRs). Bars are often invoked as a possible mechanism to fuel nuclear/circumnuclear SF (Heller & Shlosman, 1994). A significant fraction of barred galaxies have nuclear rings within 1 kpc of the nucleus of the galaxy, which are believed to be formed by gas accumulation near galactic resonances. These nuclear rings are the locations of strong density enhancements of gas about which enhanced SF is often detected (Piner, Stone & Teuben, 1995; Buta & Combes, 1996; Shlosman, 1999; Pérez-Ramírez et al., 2000)
The different energetic phenomena detected in starburst galaxies at high-energy gamma rays (e.g. NGC 253 at TeV by HESS, Acero et al., 2009; M82 at TeV by VERITAS, Acciari et al., 2009; both galaxies at GeV by Fermi, Abdo et al., 2010; NGC 4945 and NGC 1068 at GeV by Fermi, Lenain et al., 2010) are also manifested by their complex X-ray spectral characteristics. Persic & Rephaeli (2002) quantitatively assessed the roles of the various X-ray emission mechanisms and their main X-ray spectral component at different energy ranges. At low energies (2 keV), the spectrum is dominated by the contribution of a diffuse plasma (with low temperature, kT 1 keV), which originates mainly from the shock heating in the interaction of the hot low-density wind with the ambient high-density ISM (Strickland & Stevens, 2000), and, in a minor contribution, from the galactic wind. At higher energies (2–10 keV), the spectrum seems to be dominated by emission from X-ray binaries (XRBs; whose primaries are mainly neutron stars (NSs)) with a possible contribution from either non-thermal Compton emission or an AGN (Persic & Rephaeli, 2002). If a bright AGN is not present, then the X-ray emission from these galaxies is dominated by the contribution of a small number of bright extranuclear point-like sources, which appear to be XRB systems with black holes as primary components rather than NSs (Fabbiano, 1989; Miller & Colbert, 2004); in addition, they have X-ray luminosities exceeding the Eddington luminosity of a black hole, implying that they are being considered ultraluminous X-ray sources (ULXs, Makishima et al., 2000).
NGC 2903 is a large SAB(rs)bc starburst galaxy with a symmetric strong bar that is considered typical of this class of galaxies (Laurikainen & Salo, 2002). Its proximity (8.9, Drozdovsky & Karachentsev, 2000) and infrared luminosity (in 8–1000m 9.1109 ; Sakamoto et al., 1999) has made it the subject of numerous studies at all wavelengths, including radio (Tsai et al., 2006; Leon et al., 2008), infrared (Simons et al., 1988), and optical (Bresolin et al., 2005). Early NIR studies of this galaxy have shown that a considerable SF is occurring within the complex hotspot morphology in the nuclear region (e.g. Wynn-Williams & Becklin, 1985; Simons et al., 1988).
Previous X-ray studies of NGC 2903 have been based on observations (Tschöeke, Hensler & Junkes, 2003). The soft X-ray band (0.1–2.4 keV) detects a galaxy with extended X-ray emission associated with enhanced SF activity in both the disk and nuclear region, with a more significant contribution from the disk. The nucleus and three ULXs were previously reported within the energy band (Liu & Bregman, 2005; Roberts & Warwick, 2000). Moreover, weak emission outside the disk could be discerned in the PSPC image suggesting the presence of a possible halo (Tschöeke, Hensler & Junkes, 2003).
In this paper, we report the analysis of the six sources (four potential ULXs) located in NGC 2903 obtained with XMM-Newton data, as well as the results of the RGS spectral analysis of its central region.
The paper is organized as follows. Section 2 describes the observations and data reduction of the X-ray observations. Detected sources and the main results of the cross-identification search for their potential counterparts at other wavelengths are given in Section 3. Section 4 discusses the main spectral properties of the X-ray point sources detected inside the optical disk based on the fitting with main phenomenological models. Results from the analysis of the RGS spectra of the central region of NGC 2903 are presented in Section 5. We give the main conclusions of our analysis in Section 6.
2 X-ray observations and data reduction
| Source name | R.A. () | Dec. () | Position errors (′′) | Rate ( countss) |
|---|---|---|---|---|
| XMM-NGC2903 X-1 | 09h 32m 09922 | ∘ 30′ 05.55′′ | 0.3 | |
| XMM-NGC2903 X-2 | 09h 32m 06224 | ∘ 30′ 58.44′′ | 0.2 | |
| XMM-NGC2903 X-3 | 09h 32m 09719 | ∘ 31′ 02.94′′ | 1.5 | |
| XMM-NGC2903 X-4 | 09h 32m 05378 | ∘ 32′ 33.90′′ | 0.3 | |
| XMM-NGC2903 X-5 | 09h 32m 12331 | ∘ 29′ 22.35′′ | 0.5 | |
| XMM-NGC2903 X-6 | 09h 32m 08934 | ∘ 29′ 02.62′′ | 1.6 |
The dataset analysed was obtained from the XMM-Newton public data archive. XMM-Newton observed NGC 2903 during its orbit 1715 (2009 April 21st; 96 ksec on source time; Obs.ID: 0556280301; PI: A. Diaz). All three EPIC cameras were operated in “full frame” mode with the thin optical filter.
The event lists were pipeline-processed and all data products created using the SAS (Science Analysis Software) v10.0.0 and the EPIC calibration as of July 2010.
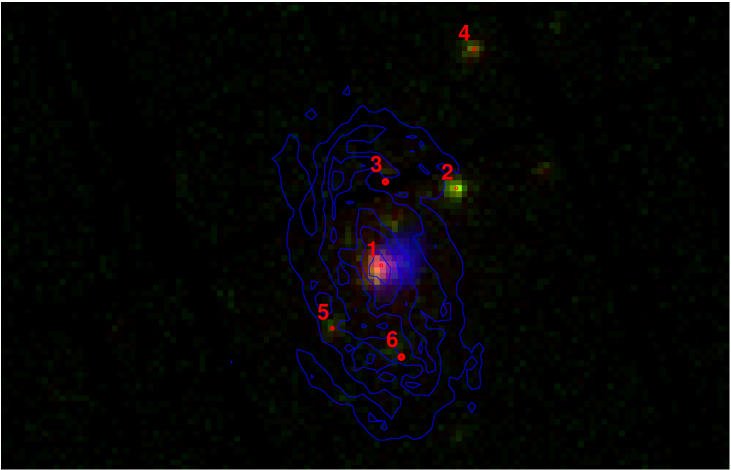
The EPIC-pn camera with a higher effective area than the EPIC-MOS cameras was selected for the source detection and spectral extraction in our analysis. We created a combined EPIC-pn image of NGC 2903 shown in Fig 1. The image was adaptively smoothed and scaled for the optimal visual presentation.
We applied the standard time and flare filtering for the observation. A high energy full-field background light curve was produced for all exposures to check for high background intervals of soft proton flares. We used this light curve at energies above 10 keV to select time intervals with low background (good time intervals, GTIs). Time intervals with count rates 0.4 ct s-1 were cut from subsequent data analysis111Information provided at ”node50.html” of the User Scientific Guide.. Only those events measured in regions away from the CCD borders or bad pixels (FLAG=0) and single and double events for the PN camera () were considered, as recommended for the PN camera. We checked for pile-up and found that this was not significant (5% for the high energy channels) for this observation. These corrections resulted in typical exposure times of 47 ks.
Source detection was performed in several bands for the PN camera simultaneously, using the psechain SAS task. This process detected a total of six sources. The source identification used in this work, the coordinates as given by the psechain task, the point-source location accuracy (PSLA), the count rate for each source in the 0.3-10keV energy range, and the intrinsic X-ray luminosity within the same range considering a distance to the galaxy of 8.9 (Drozdovsky & Karachentsev, 2000) are listed in Table 1. The pipeline also created images, background images, and exposure maps for the observation in different energy bands. In our analysis, we use the energy range 0.3-10.0 keV.
3 X-ray point sources in the NGC 2903
We detected a total of six sources within the isophotal D25 ellipse of the galaxy. We carried out a search for possible counterparts to the X-ray point sources by cross-identifying the location of the X-ray sources with specific catalogues for NGC 2903. Although we obtained the respective PSLAs by means of the psechain task for each source, we considered an absolute error of 2”, which also accounts for the pointing uncertainties of , according to the latest calibration report222http://xmm2.esac.esa.int/docs/documents/CAL-TN-0018.pdf.
We cross-correlated the sources with the catalogues of Tschöeke, Hensler & Junkes (2003) and Popping, Pérez & Zurita (2010) for the locations of HII regions and SF knots, the work by Sonbas, Akyuz & Balman (2009) with new detections of supernova remnants (SNRs), and also the catalogue of Alonso-Herrero, Ryder & Knapen (2001) with the locations of nuclear star clusters. We also cross-identified the location of the X-ray sources with the ULX catalogues of Liu & Bregman (2005) and the high resolution survey of galaxies of Roberts & Warwick (2000). We did not find any counterparts to our sources among the listed SNRs, nor the nuclear star clusters.
Only three of the six X-ray sources have been previously reported, namely XMM-NGC2903 X1, XMM-NGC2903 X3, and XMM-NGC2903 X4. The source XMM-NGC2903 X1, located at 3.68” from the centre, was classified by Liu & Bregman (2005) as an ULX, NGC 2903 X1, based on data at a distance of 2.66” from our source. Given the angular resolution (2”), this source is within the position error of our source. Eight radio sources are reported within 7” of our position by Tsai et al. (2006), two of them at a separation of 1”. Several regions are also found in the region by Planesas, Colina & Pérez-Olea (1997) two of them being also at distances of less than 2”.
At a separation of 3.18” from XMM-NGC2903 X3, NGC 2903 X-2 was reported by Roberts & Warwick (2000) based on high resolution images.
Finally for XMM-NGC2903 X4, an ULX source located at a separation of 3.63”, NGC 2903 X-1, was also reported by Roberts & Warwick (2000). A HII ionized region at a distance of 2.12” was detected by Tschöeke, Hensler & Junkes (2003) and Popping, Pérez & Zurita (2010). In the SIMBAD database, we did not find any counterpart or entry to XMM-NGC2903 X2, XMM-NGC2903 X5, nor to XMM-NGC2903 X6, within a 10” radius query.
In their ULX catalogue, Liu & Bregman (2005) reported two ULXs, namely X1, which is coincident with our central source XMM-NGC2903 X1, and X2, which is not detected in our observations.
4 Spectral analysis of X-rays sources detected in NGC 2903
We extracted the spectra for the sources from a circular region centred on the source (with centroids shown in Table 1). The background was extracted from a circular region not far from the sources and away from the boundaries of the chip and the nucleus of the galaxy. The EPIC spectra were grouped to contain a minimum of 20 counts per spectral bin to allow us to perform 2 statistics, and fit to analytical models using the XSPEC 12.0 fitting package (Arnaud, 1996). All errors are given at the 90 percent confidence level unless stated otherwise. The PN spectra were fitted in the 0.3–10.0 keV band.
We fitted the spectra from all sources with the simplest (non-composite) phenomenological models, i.e. multi-color disk emission (diskbb; Mitsuda et al., 1984) and power-law emission (best-fit parameters shown in Table 2). These models have been proven to successfully provide a phenomenological description of the and spectra of a sample of ULXs (e.g. in the galaxies M51 and NGC 4490/85; Yoshida et al., 2010; Makishima et al., 2000) . Furthermore, we applied the thermal bremsstrahlung bremss model. The obtained thermal temperatures were in the range 2-7 keV, indicative in some cases of high-energy curvature. Soft-energy emission from the diffuse galaxy was included in the model, considering fixed metal (solar) abundances (mekal model in XSPEC). The derived thermal temperature of the diffuse plasma is keV and the column density , closely in agreement with the estimated column density cm-2 (Kalberla et al., 2005) and indicative of low intrinsic column absorption to the hosting galaxy. The X-ray luminosities obtained for these sources are in the range , with XMM-NGC2903 X1 making it a strong low-luminosity AGN candidate. Further observations with higher spatial resolution are required to confirm/discard this possibility.
XMM-NGC2903 X2, XMM-NGC2903 X3, and XMM-NGC2903 X4 reach and/or exceed the Eddington luminosity of a stellar-mass black hole of (). For XMM-NGC2903 X5, and XMM-NGC2903 X6, they do not reach this level and emit as BH candidates in ther bright intermediate states (Remillard & McClintock, 2006). For three of these sources, namely XMM-NGC2903 X1, XMM-NGC2903 X5, and XMM-NGC2903 X6, the power-law model was a more accurate description than the diskbb model. For XMM-NGC2903 X1, a power-law solution is in good agreement with what we expect from a low-signal AGN spectra and accreting BHs. It implies that non-thermal processes play an important role in producing the spectra of these sources. For the remaining sources, the breaks closely resemble those previously observed in X-ray spectra from high-quality data from the X-ray curved spectra of some ULXs (e.g., M82 X-1; Miyawaki et al., 2009).
| Parameter | XMM-NGC2903 | XMM-NGC2903 | XMM-NGC2903 | XMM-NGC2903 | XMM-NGC2903 | XMM-NGC2903 |
|---|---|---|---|---|---|---|
| X-1 | X-2 | X-3 | X-4 | X-5 | X-6 | |
| P333The abbreviations for the models: “P” for phabs(mekal + powerlaw), “D” for phabs(mekal + diskbb) and “B” for phabs(mekal + bremss) | ||||||
| nH (1022cm-2) | 0.040.02 | 0.160.05 | 0.070.03 | 0.530.02 | 0.030.03 | 0.010.01 |
| 2.150.05 | 1.880.05 | 2.520.18 | 2.760.16 | 1.760.11 | 1.760.11 | |
| kT (keV) | 0.590.02 | 0.290.12 | 0.530.14 | 0.140.02 | 0.470.18 | 0.540.15 |
| 2/ | 1.07(240.68/224) | 1.52(150.58/99) | 0.64(23.08/36) | 0.69(37.18/54) | 0.94(43.20/46) | 1.06(50.91/48) |
| F(ergs/cm2/s)(10-13) | 3.48980.0123 | 2.22820.0101 | 1.61140.3893 | 0.70952.6372 | 0.64270.1143 | 0.6006 0.0140 |
| Log(Luminosity) | ||||||
| D | ||||||
| nH (1022cm-2) | 0.0050.005 | 0.0060.006 | 0.0080.008 | 0.080.03 | 0.0060.006 | 0.0050.005 |
| kTin (keV) | 0.660.05 | 1.390.08 | 0.470.07 | 0.950.11 | 1.40.4 | 1.40.3 |
| kTmekal (keV) | 0.520.02 | 0.430.13 | 0.490.16 | 0.70.5 | 0.310.03 | 0.30 0.03 |
| 2/ | 1.84(412.29/224) | 1.46(144.77/99) | 0.90(32.33/36) | 0.66(35.48/54) | 1.34(61.83/46) | 1.48(71.02/48) |
| F(ergs/cm2/s)(10-13) | 2.44530.0457 | 1.48620.0249 | 0.96350.0533 | 0.81010.6931 | 0.54742.2000 | 0.54530.6270 |
| Log(Luminosity) | ||||||
| B | ||||||
| nH (1022cm-2) | 0.0020.002 | 0.0800.020 | 0.0080.008 | 0.1600.020 | 0.0080.008 | 0.0030.003 |
| kTmekal (keV) | 0.590.02 | 0.380.17 | 0.530.13 | 0.700.70 | 0.440.12 | 0.450.15 |
| kTbremss (keV) | 2.90.4 | 5.61.2 | 1.70.6 | 2.50.3 | 6.62.5 | 4.81.4 |
| 2/ | 1.18(264.51/224) | 1.44(142.41/99) | 0.67(24.15/36) | 0.65(35.34/54) | 1.03(47.30/46) | 1.23(58.88/48) |
| F(ergs/cm2/s) (10-13) | 2.82550.0103 | 1.83110.2519 | 1.08920.0819 | 1.03470.0540 | 0.56450.3267 | 0.54590.2047 |
| Log(Luminosity) |
5 RGS spectra of NGC 2903
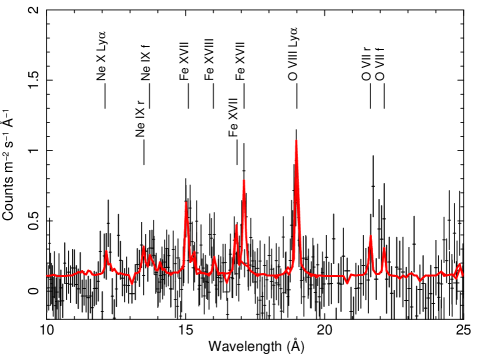
The Reflection Grating Spectrometer (RGS) onboard XMM-Newton instrument was operating during the observation. The RGS data were processed using the standard pipeline. The spectral analysis of RGS data was carried out using the fitting package SPEX444http ://www.sron.nl/spex/ v2.02 (Kaastra, Mewe, & Nieuwenhuijzen, 1996). Both RGS1 and RGS2 were fitted together, and C-statistics was adopted as the fitting method (Cash, 1979). Typical errors in the RGS data are about 68% or 1 . The combined first-order RGS1 and RGS2 spectra display several emission lines (see Fig. 2). The spectrum is dominated by a strong O viii Ly emission line along with Ne x Ly, and several Fe xvii features. The O vii complex is also significantly detected, although only the forbidden and resonance lines could be resolved. Both O vii and lines seem to be of similar strength, which is consistent with the presence of the collisionally ionized gas typical of starburst galaxies. The He-like triplet of Ne ix is also present, although its components are blended.
We therefore fitted the spectrum using a model for a plasma in collisional ionization equilibrium (CIE, see SPEX manual for details). The spectrum was rebinned by a factor of 8 in the 7-26 Å range, where the majority of the emission features fall.
Even though the quality of the spectrum left little space for a detailed quantitative analysis, we modelled the continuum with a power law corrected for local absorption along the line of sight of the source ( cm-2, Kalberla et al., 2005). The best-fit CIE model yielded a plasma temperature of keV and an emission measure cm-3. Unfortunately, the statistics of the spectrum did not allow us to test whether a multi-temperature distribution is present or not.
The presence of the He-like triplets of O vii and Ne ix in the spectrum made it possible to perform a rough line diagnostic of the plasma. In the case of O vii, the resonance and forbidden lines are clearly detected, whereas the intercombination line is missing or its significance is too low to be statistically detected. The strengths of the and lines are comparable and provide a gas ratio of , fully consistent with a collisionally ionised gas. According to Fig. 7 in Porquet & Dubau (2000), this ratio for a plasma with temperature K (as provided by our best-fit model) would correspond to a ratio of the relative ionic abundances in the O viii/O vii ground state population of 10, in agreement with the relative strengths of the oxygen lines detected in the RGS spectrum. The ratio is far more difficult to estimate since the intercombination line is not detected in our spectrum. Nevertheless, that the and lines are present and of similar strength combined with an undetectable line makes it possible to set a lower limit to the density of cm-3 (see Fig . 11 in Porquet & Dubau (2000). The Ne ix triplet is clearly detected in the spectrum but the individual lines are blended. In this situation little can be said about this triplet.
From our best-fit model, we can also measure the abundances of various elements relative to the standard set of proto-solar abundances by Lodders & Palme (2009). We find that the abundances of oxygen, neon, and iron are consistent with solar values (, , and , respectively).
6 Conclusions
We have reported on the first deeper X-ray broad-band observation of the hot spot galaxy NGC 2903 obtained with XMM-Newton. Both X-ray imaging and spectra of the spiral barred galaxy NGC 2903 were extracted from XMM-Newton archival data. A total of six X-ray sources (four of them ULX candidates) were detected in the energy range of 0.3–10.0 keV located within the optical disk, thus associated with the galaxy. Three of these sources have been detected for the first time, and one, XMM-NGC2903 X2 of luminosity higher than 1039 erg s-1. After fitting three different models, we were able to estimate their luminosities, which are compatible with binaries that contain a compact object in the form of BHs rather than a NS.
We extracted the combined first-order RGS1 and RGS2 spectra of its central region, which exhibit several emission lines. Both O vii and lines seem to be of similar strength, which is consistent with the presence of collisionally ionized gas, typical of starburst galaxies. The He-like triplet of Ne ix is also present, although its components are blended. After fitting the spectra with a model for a plasma in collisional ionization equilibrium (CIE) and modelling the continuum with a power-law, the estimate of the plasma temperature was keV and the emission measure cm-3. From our best-fit model, we have also been able to measure the abundances of various elements relative to the standard set of proto-solar abundances, and found that the abundances of oxygen, neon, and iron are consistent with solar values (, , and , respectively).
Acknowledgements.
DPR acknowledges support from the Universidad de Jaén (Spain). MCG acknowledges hospitality at Departament de Astronomia i Meteorologia (Universitat de Barcelona, Spain). The Space Research Organization of The Netherlands is supported financially by NWO, the Netherlands Organization for Scientific Research.References
- Abdo et al. (2010) Abdo, A. A., Ackermann, M., Ajello, M., Atwood, W. B., Axelsson, M., Baldini, L., Ballet, J., Barbiellini, G., Bastieri, D., Bechtol, K., et al., 2010, ApJ, 709, L152
- Acciari et al. (2009) Acciari, V. A., Aliu, E., Arlen, T., Aune, T., Bautista, M., Beilicke, M., Benbow, W., Boltuch, D., Bradbury, S. M., et al., 2009, Nature, 462, 770
- Acero et al. (2009) Acero, F., Aharonian, F., Akhperjanian, A. G., Anton, G., Barres de Almeida, U., Bazer-Bachi, A. R., Becherini, Y., et al., 2009, Science, 326, 1080
- Alonso-Herrero, Ryder & Knapen (2001) Alonso-Herrero, A., Ryder, S.D., Knapen, J.H., 2001, MNRAS, 322, 757
- Arnaud (1996) Arnaud, K. A., 1996, Astronomical Data Analysis Software and Systems V, ASP Conf. Ser., 101, 17
- Bresolin et al. (2005) Bresolin, F., Schaerer, D., Gonzalez Delgado, R. M., Stasińska, G., 2005, A&A, 441, 981
- Buta & Combes (1996) Buta, R., Combes, F., 1996, Fundam. Cosmic Phys., 17, 95
- Cash (1979) Cash, W. 1979, ApJ, 228, 939
- Dickey & Lockman (1990) Dickey, J.M., and Lockman, F.J. 1990, ARA&A, 28, 21
- Drozdovsky & Karachentsev (2000) Drozdovsky, I.O., and Karachentsev, I.D., 2000, A&AsS, 142, 425
- Fabbiano (1989) Fabbiano, G., 1989, ARA&A, 27, 87
- Kaastra, Mewe, & Nieuwenhuijzen (1996) Kaastra, J. S., Mewe, R., and Nieuwenhuijzen, H., 1996, 11th Colloquium on UV and X-ray Spectroscopy of Astrophysical and Laboratory Plasmas, p. 411 - 414
- Kalberla et al. (2005) Kalberla, P.M. W., et al., 2005, A&A, 440, 775
- Heller & Shlosman (1994) Heller, C. H., and Shlosman, I., 1994, ApJ, 424, 84
- Laurikainen & Salo (2002) Laurikainen, E., and Salo, H., 2002, MNRAS, 337, 1118
- Leon et al. (2008) Leon, S., Jeyakumar, S., Pérez-Ramírez, D., Verdes-Montenegro, L., Lee, S. W., Ocaña Flaquer, B., 2008, A&A, 491, 703
- Lenain et al. (2010) Lenain, J.-P., Ricci, C., Türler, M., Dorner, D., Walter, R., 2010, arXiv:1008.5164
- Liu & Bregman (2005) Liu, J.F., and Bregman, J.N., 2005, ApJS, 157, 59
- Lodders & Palme (2009) Lodders, K., and Palme, H. 2009, Meteoritics and Planetary Science Supplement, 72, 5154
- Makishima et al. (2000) Makishima, K., Kubota, A., Mizuno, T., Ohnishi, T., Tashiro, M., Aruga, Y., Asai, K., Dotani, T., Mitsuda, K., Ueda, Y., 2000, ApJ, 535, 632
- Miller & Colbert (2004) Miller, M.C., and Colbert, E. J. M., 2004, International Journal of Modern Physics D, Vol. 13, pp. 1-64
- Mitsuda et al. (1984) Mitsuda, K., Inoue, H., Koyama, K. et al., 1984, PASJ, 36, 741
- Miyawaki et al. (2009) Miyawaki, R., Makishima, K., Yamada, S. et al., 2009, PASJ, 61, 263
- Pérez-Ramírez et al. (2000) Pérez-Ramírez, D., Knapen, J. H., Peletier, R. F., Laine, S., Doyon, R., Nadeau, D., 2000, MNRAS, 317, 234
- Persic & Rephaeli (2002) Persic, M., and Rephaeli, Y., 2002, A&A, 843
- Piner, Stone & Teuben (1995) Piner, B.G., Stone, J.M., and Teuben, P.J., 1995, ApJ, 449, 508
- Planesas, Colina & Pérez-Olea (1997) Planesas, P. ,Colina, L., and Pérez-Olea, D., 1997, A&A, 325, 81
- Popping, Pérez & Zurita (2010) Popping, G., Pérez, I., and Zurita, A. arXiv:1004.6065v1
- Porquet & Dubau (2000) Porquet, D., and Dubau, J. 2000, A&AS, 143, 495
- Remillard & McClintock (2006) Remillard, R.A., and McClintock, J.E., 2006, ARAA, 44, 49
- Roberts & Warwick (2000) Roberts, T.P., and Warwick, R.S., 2000, MNRAS, 315, 98
- Sakamoto et al. (1999) Sakamoto, K., Okumura, S.K., Ishizuki, S., Scoville, N.Z., 1999, ApJS, 124, 403
- Shlosman (1999) Shlosman, I., 1999, in Beckman J.E., Mahoney T.J., eds, ASP Conf. Ser. Vol. 187, The Evolution of Galaxies on Cosmological Timescales. Astron. Soc. Pac., San Francisco, p. 100
- Simons et al. (1988) Simons, D. A., Depoy, D. L., Becklin, E. E., Capps, R. W., Hodapp, K.-W., Hall, D. N. B., 1988, ApJ, 335, 126
- Sonbas, Akyuz & Balman (2009) Sonbas, E., Akyuz, A., Balman, S., 2009, A&A, 493, 1061
- Strickland & Stevens (2000) Strickland, D.K., and Stevens, I.R., 2000, MNRAS, 314, 511
- Tsai et al. (2006) Tsai, C.W. , Turner, J.L., Beck, S.C., Crosthwaite, L.P., Ho, P.T.P., Meier D.S, 2006, AJ, 132, 2383
- Tschöeke, Hensler & Junkes (2003) Tschöeke, D., Hensler, G., Junkes, N., 2003, A&A, 411, 41
- Wynn-Williams & Becklin (1985) Wynn-Williams, C.G., Becklin, E.E., 1985, ApJ, 290, 108
- Yoshida et al. (2010) Yoshida, T., Ebisawa, K., Matsushita, K. et al., 2010, astro-ph/1008.4187