Recent Tau Decay Results at B Factories Lepton Flavor Violating Tau Decays
We report recent results for lepton flavor violating (LFV) decays obtained at Belle and BaBar with the world-largest data samples.
1 Introduction
An observation of the lepton flavor violation (LFV) is a clear signature of New Physics (NP) since the LFV in charged leptons has a negligibly small probability in the Standard Model (SM) even taking into account neutrino oscillations. For example, the branching fraction for the decay into and , should be proportional to squared mass difference between neutrinos and the weak boson mass squared and is calculated to be less than . Since the lepton can have many possible LFV decay modes and is expected to be sensitive to NP because it has the heaviest mass among charged leptons, we search for the LFV from the lepton as a NP phenomenon.
The model including supersymmetry (SUSY), that is the most popular as the one beyond the SM, can naturally induce LFV at one loop. In many SUSY models, a decay is expected to have the largest branching fraction among all the LFV decays while a branching fraction for a decay into or can become the largest in some cases, such as the higgs-mediated case. By evaluating the branching fractions for various LFV decays, we can distinguish what model is favored. Here, we especially focus on the three major modes, , and where or and , or .
The world-highest data samples has been collected in two B-factory experiments, by the Belle and BaBar collaborations, because the cross section for is very close to that for on the mass. Therefore, the B-factory is a good place to search for the LFV. Here, recent results with samples obtained by Belle and BaBar are reported.
2 Analysis Method
In the LFV analysis, in order to evaluate the number of signal events, two independent variables are defined, that are signal-reconstructed mass and energy in the center-of-mass (CM) frame from energies and momenta for the signal daughters. In the case, they are defined as
| (1) | |||
| (2) |
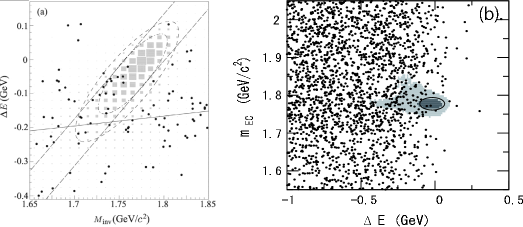
where () is a sum of the energies (a magnitude of a vector sum of the momenta) for and , the superscript indicates that the variable is defined in the CM frame and the means the initial beam energy in the CM frame. Principally, and should be ( GeV/) and 0 (GeV), respectively, for signal events while and will smoothly vary without any special structure in the background (BG) events. (BaBar often takes an energy-constrained mass rather than the usually reconstructed mass.) The signal MC distribution of on the – plane is shown in Fig. 1.
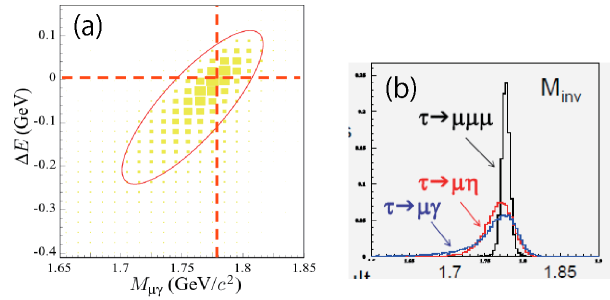
Due to the resolution, the signal events are distributed around and (GeV). Taking into account the resolution, we set the elliptic signal region. (See Fig. 1.) Finally, we evaluate the number of signal events in the signal region. Generally, when some gammas are included, the resolution become worse. Therefore, has a good resolution while has a bad resolution. This means that good (bad) is expected in the () analysis because the number of the BG events can be roughly estimated to be proportional to the size of the signal region.
To avoid any bias for our analyses, we perform the blind analysis: Before fixing the selection criteria and the evaluation for the systematic uncertainties, we cover the data events in the signal region.
3
In 2008, Belle has updated their result for with -pairs. The main BG events come from + extra events and the radiative di-muon or bhabha events. The number of the signal events is evaluated by a generalized extended unbinned maximum-likelihood to the – distribution. As a result, the upper limit on the branching fraction for is set to be () at 90% confidence level (CL). Recently, BaBar has published the new result with -pairs data sample on as well as and masses. New requirements to especially reject radiative di-muon or bhabha events are introduced. In the signal region, The signal detection efficiency for () is 6.1% (3.9%) while the expected number of the BG events is () events. Consequently, 2 (0) events are found in the () analysis and the 90% upper limit on the branching fraction is evaluated to be 4.4 . Here, the 90% CL upper limits are calculated by a counting method.
4
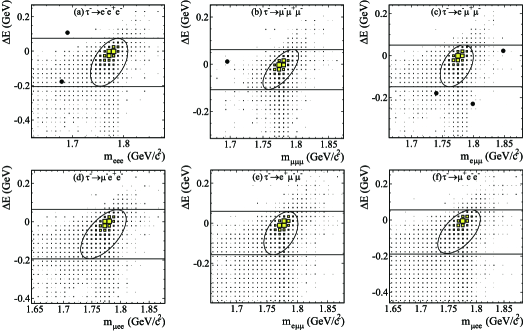
In the last summer, Belle and BaBar have shown the results for with their almost full data samples, of -pairs by Belle and ones by BaBar . BaBar improves the efficiency for the lepton-ID and the better rejection for the background is obtained. As a result, no event in the signal region is found for all modes and the 90% CL upper limits on the branching fractions are set as shown in Table 1. On the other hand, Belle takes very similar selection criteria to those for the previous analysis. Finally, for all modes, no event is observed in the signal region and the upper limits are evaluated around 2 or 3 times more sensitively than those obtained previously.
| Mode () | Eff.(%) | UL () | Mode () | Eff.(%) | UL () | ||
|---|---|---|---|---|---|---|---|
| 6.0 | 2.7 | 6.1 | 2.7 | ||||
| 8.6 | 3.4 | 6.4 | 4.6 | ||||
| 9.3 | 1.8 | 10.1 | 1.7 | ||||
| 8.8 | 3.7 | 10.2 | 2.8 | ||||
| 11.5 | 1.5 | 7.6 | 2.1 | ||||
| 12.6 | 2.2 | 6.6 | 4.0 |
5
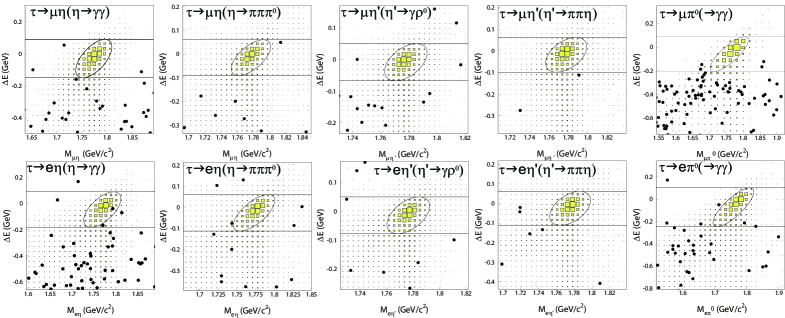
In 2007, Belle and BaBar have published their results of the search for the decay into a lepton and a neutral pseudoscalar . They have used around 400fb-1 and set the range of the upper limits of at 90% CL. This summer, Belle reports the new result with about 900fb-1. By studying the backgrounds in detail, they obtain about 1.5 times larger efficiency than previously in average and the expected number of the BG events in the signal region is achieved to be less than one for each mode. Details are summarized in Table. 2. Finally, one event is found in while no event is observed in other modes. (See Fig. 4) The evaluated 90% upper limits on the branching fraction are .
| Mode () | Eff.(%) | UL () | Mode () | Eff.(%) | UL () | ||
| 8.2 | 3.6 | 7.0 | 8.2 | ||||
| 6.9 | 8.6 | 6.3 | 8.1 | ||||
| (comb.) | 2.3 | (comb.) | 4.4 | ||||
| 8.1 | 10.0 | 7.3 | 9.4 | ||||
| 6.2 | 6.6 | 7.5 | 6.8 | ||||
| (comb.) | 3.8 | (comb.) | 3.6 | ||||
| 4.2 | 2.7 | 4.7 | 2.2 |
6 Summary
We report recent results of the various search for LFV decays obtained by Belle and BaBar. These results are about 100 times more sensitive than those by CLEO. This is achieved by not only much larger data samples but more effective BG rejection after detailed examination of the BG. At the present, we are updating results using full data samples accumulated by B-factories.
References
- [1] X. Y. Pham, Eur. Phys. J. C 8, 513 (1999).
- [2] K. Hayasaka et al. (Belle Collaboration), Phys. Lett. B 666, 16 (2008).
- [3] B. Aubert et al. (BaBar Collaboration), Phys. Rev. Lett. 104, 021802 (2010).
- [4] K. Hayasaka et al. (Belle Collaboration), Phys. Lett. B 687, 139 (2010).
- [5] J. P. Lees et al. (BaBar Collaboration), Phys. Rev. D 81, 111101 (2010).
- [6] Y. Miyazaki et al. (Belle Collaboration), Phys. Lett. B 648, 341 (2007).
- [7] B. Aubert et al. (BaBar Collaboration), Phys. Rev. Lett. 98, 061803 (2007).