Understanding Reverberation Lags in 1H0707-495
Abstract
The first reverberation lag from the vicinity of a supermassive black hole was recently detected in the NLS1 galaxy 1H0707-495. We interpreted the lag as being due to reflection from matter close to the black hole, within a few gravitational radii of the event horizon (an inner reflector). It has since been claimed by Miller et al that the lag can be produced by more distant matter, at hundreds of gravitational radii (an outer reflector). Here, we critically explore their interpretation of the lag. The detailed energy dependence of the time lags between soft and hard energy bands is well modelled by an inner reflector using our previously published spectral model. A contrary claim by Miller et al was obtained by neglecting the blackbody component in the soft band. Soft lags can be produced by a large-scale outer reflector if several, implausible, conditions are met. An additional transfer function is required in the soft band corresponding to a region that is physically close to the continuum source, or lies close to our line of sight and subtends a small solid angle at the source, challenging the production of the observed spectrum. We show that the original inner reflector interpretation of reverberation very close to the black hole provides a self-consistent and robust model which explains the energy spectrum and timing properties, including the time delays, power spectra and the shape of the coherence function. Several of these properties are opposite to the predictions from a simple large-scale outer reflection model.
keywords:
X-rays.1 Introduction
X-ray emission from black holes is known to be highly variable on short time scales, down to milliseconds in Galactic black holes, and to minutes in active galactic nuclei (Nowak et al. 1999; Revnivtsev et al. 2000; McHardy et al. 2004). The emission region must therefore be compact and close to the black hole. Further evidence is obtained from the X-ray spectra. The first relativistically broadened iron K line was detected in ASCA data (Tanaka et al. 1995), and later confirmed with XMM-Newton (Fabian et al. 2002) and in many other AGN (e.g. Nandra et al. 2007, see Miller 2007 for a review). Such broad iron lines are also seen in Galactic black holes (Miller 2007; Reis et al. 2010) and neutron stars (Cackett et al. 2008).
More recently, a broad iron L line at energies keV has been detected (Fabian et al. 2009; Zoghbi et al. 2010, hereafter F09 and Z10 respectively) in the Narrow Line Seyfert 1 (NLS1) galaxy 1H0707-495 (). The line is visible thanks to the high reflection fraction and the relatively high iron abundance. Modelling the line as part of a reflection continuum, smeared by relativistic effects, indicates that spectrum is emitted from a very small region (less than gravitational radii, , F09,Z10).
Along with this identification, came the detection of a time delay of seconds between the direct and reflected emission. It was measured between the 0.3–1.0 and 1.0–4.0 keV bands, the first being dominated by reflection (iron L line) and the second dominated by the direct power-law emission. This time lag was interpreted as a reverberation signature from the vicinity of the black hole (F09, Z10), i.e. from a small-scale reflector with a size-scale of tens of light-seconds, namely the inner disk which produces the strong reflection signatures in this source.
The lag spectrum of 1H0707-495 shows these reverberation delays (soft lags) over a broad range of high temporal frequencies ( Hz), while at low frequencies, it shows hard lags similar to those commonly seen in GBH and other AGN (Miyamoto & Kitamoto 1989; Nowak et al. 1999; Pottschmidt et al. 2000; McHardy et al. 2007; Arévalo et al. 2008). The exact origin of these hard lags is not clear (see for example Poutanen 2001). Comptonisation can possibly produce such a delay, but a picture in which soft and hard photons are emitted from slightly different regions, used within a model of fluctuations propagating through the accretion flow, is more consistent with other variability properties (Lyubarskii 1997; Kotov et al. 2001; Arévalo & Uttley 2006).
Miller et al. (2010) (hereafter M10a) put forward a model in which these hard lags are due to reflection from distant material (few hundreds to few thousands gravitational radii). This model was able to reproduce the hard lags in NGC 4051 (M10a), previously explained with the propagating fluctuations model (McHardy et al. 2004). In Miller et al. (2010) (hereafter M10b), the same model was applied to 1H0707-495 claiming that it can produce soft lags. In the model, the sharp edges in the transfer function of the new distant reflector produce oscillations that can lead to small negative lags (i.e soft lags in this case). These oscillations lead the authors to caution against interpreting the observed lags as being due to light travel time due to reverberation with an intrinsically short light travel time from the primary continuum source to the reflector. Instead, they suggest that the lags originate from a large-scale reflector, such as a disk-wind (e.g. Sim et al. 2010). No spectral model is presented in M10b.
In the present work, we critically compare the models for large-scale, outer, and small-scale, inner, reflection which are used to explain the lags in 1H0707-495 by M10b and Z10 respectively. We use the energy-dependence of the lag to show that, contrary to a claim by M10b, a small-scale reflector fits the data well, especially when we take into account lags from the thermally-reprocessed blackbody emission which is seen in the energy spectrum. We also show how the models fit the Fourier frequency-dependence of the lags and highlight the fact that both models require reflectors with a small time-delay, which can be naturally explained if the reflector is small, but leads to a constrained geometry, which is unfavourable to the required large covering fraction for the large-scale outer reflection model of M10b.
2 Modelling the lag
2.1 Lag vs Energy
In this section, we explore the energy dependence of the lag. The data presented in this section are from previous XMM-Newton observation of 1H0707-495 in 2002, 2007 and 2008. The details of the reduction are similar to that in Z10. Background-subtracted light curves in ten energy bands were produced (defined by equal distances in log-space over two broad bands). For each energy band, frequency-dependent time lags were calculated between the light curve in that band and a light curve of the whole energy band (0.3–10 keV) excluding the current band. Using the whole band as a reference maximises the signal to noise ratio, while excluding the current band from the reference ensures the noise remains uncorrelated between the bands. This however means the reference light curve is slightly different for each band, but this has very minor effect on the final results. Monte Carlo simulations showed that there is about 1 percent systematic error in the lags measured this way which is much smaller than the statistical errors of the current data. Using one of the bands as a reference (the softest band as it has the highest number of counts) gives the same result but with slightly larger error bars.
The top panel of Fig. 1 shows the variation of the lag as a function of energy in the Hz frequency band, these are the frequencies where the soft lag is at a maximum (see Fig. 18 in Z10). The choice of reference band sets a constant offset to the time-lag, but what is important are the differences in lag between energy bands: more positive values lag smaller/more-negative values. The lag is maximised between the soft band and energies of keV where the primary continuum dominates the spectrum. This shape is strikingly similar to the (inverted) shape of the fractional RMS variability spectrum presented in F09, and is different from the positive log-linear correlation of lag with energy seen in galactic black holes and other AGN (Miyamoto & Kitamoto 1989).
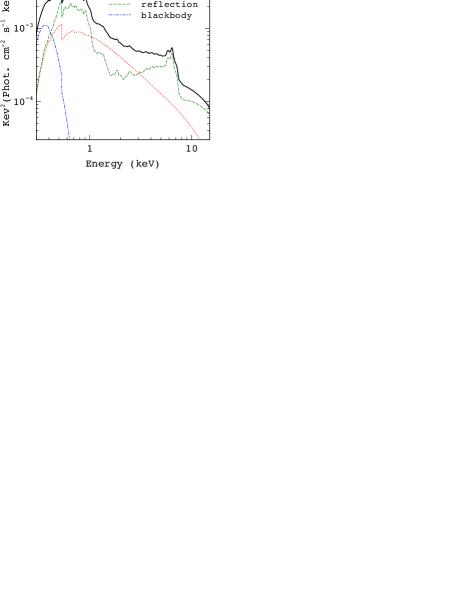
This shape can be easily understood in light of a model where soft lags are reverberation signatures from very close to the black hole. In a similar way to the interpretation of the rms spectrum, the lag is maximised between bands which are dominated respectively by reflection and direct emission (i.e. the power-law in Fig. 2). The lag at high energies (dominated by the broad iron K line) has similar values to those of the iron L line ( keV), which is expected if they are indeed representing the same reflection components. There appears also to be a positive hard lag between the 0.3–0.5 keV band and the 0.5–1 keV band. The second band is dominated by the relativistically smeared reflection, while the first is mainly blackbody emission (Fig. 2). It is natural to interpret the 0.3-0.5 keV lag as being associated with thermal reprocessing of X-ray photons absorbed by the disk, which is expected to accompany reflection from the hot inner disk in an extreme-accretion-rate AGN.
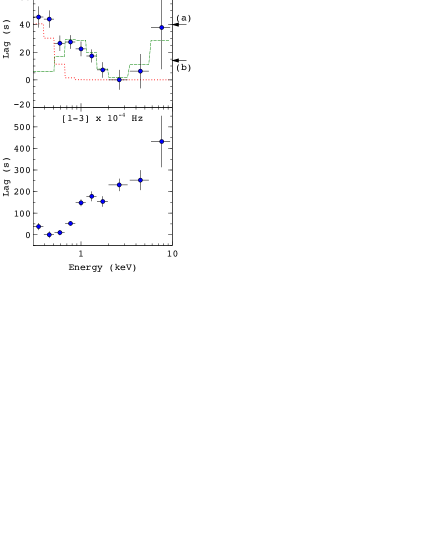
A simple model based on this interpretation is also shown in Fig. 1. This model is given by the intrinsic average time delay from the direct continuum to the reprocessed component, multiplied by the ratio of the reprocessed emission (reflection or thermally reprocessed blackbody emission) to the total emission including the power-law, both taken from the best fit model (Fig. 2) described in detail in Z10. The model naturally produces the lag between hard and soft bands and the medium-energy band where the direct power-law contribution to emission is maximised. The intrinsic lags that give the best combined fit are s for the reflector and s for the thermally-reprocessed blackbody emission, corresponding to a few gravitational radii for a black hole of mass M⊙. We expect there to be a small difference between the light-travel times to the reflector and the thermal reprocessor, because where reflection is maximised due to disk ionisation, thermal reprocessing of absorbed flux should be minimised and vice versa. Hence a radial dependence of ionisation could easily explain the small difference in the light-travel time to these components. The actual values of the lag are different from those in Fig. 1 because the energy bands include contribution from both different components whose lag is diluted, while the model fits for each individual component.
M10b calculated the lag between 0.3–1 and 4–7.5 keV and found that there is a soft delay in the Hz frequency band. This led the authors to conclude that such a significant lag between the L-line and the K-line reflection parts of the spectrum rules out the small-scale reflector interpretation, which requires that K and L lines share the same location in the inner disk. It is apparent from Fig. 1 that the lag at the iron K energies is actually consistent with that of the L-line present just below 1 keV. The energy bands chosen in M10b are broad and given the steepness of the energy spectrum, the measured lag has a significant contribution from energies below 0.5 keV, which in our spectral model is dominated by blackbody emission and not reflection. This can be seen in Fig. 1 where the average lags at the 0.3–1 and 4.–7.5 keV bands used in M10b are marked with arrows on the top-right of Fig. 1. The difference between the two is the lag that would be calculated when those two bands are considered, and shows a clear lag of the hard relative to the soft band, as reported by M10b. However, the detailed lag vs. energy spectrum in Fig. 1 shows that this result is expected due to the domination of the 4-7.5 keV band by the lower-energy photons in the band, which leads to a stronger direct continuum contribution, together with the blackbody component dominating the softest energies. M10b did not take account of the blackbody component in their comparison with the expectations of the small-scale reflector model.
The bottom panel of Fig. 1 is similar to the top panel but now showing the lags in the Hz frequency band. This, unlike the top panel, shows a lag that increases with energy, similar to that commonly seen in many accreting sources, both Galactic binaries and AGN (Miyamoto & Kitamoto 1989; Nowak et al. 1999; Arévalo et al. 2008). The energy dependence of the lag in the two frequency bands (, bottom and Hz, top in Fig. 1) is not simply an inverted version of the top panel (as would be expected if the soft lags are simply an artefact due to the sharp edge in the transfer function of a large-scale reflector) suggesting that two separate components are contributing to the lag spectrum. As we pointed out in F10 and Z10, all the evidence points towards the lag at Hz being due to reflection from a distance of a few gravitational radii. The energy-dependence of the lags at low frequencies shows no clear link with the reflection spectrum (except possibly for the very low energies where the blackbody dominates). This leads us to postulate that the long time scale lags may be driven by fluctuations in the accretion flow which modulate the blackbody disk emission before reaching the direct power-law emitting region to produce the observed long-time-scale lags (e.g. Arévalo & Uttley 2006).
2.2 Lag vs Frequency
In this section we explore the lag dependence on frequency and how it can be explained using models of a small-scale and large-scale, i.e. inner and outer reflector.
The model of a large-scale reflector presented by M10a and expanded in M10b explains the low-frequency hard lags in terms of light-travel time to a distant reflector with a significant contribution in the hard band (note that this is the opposite of the inner-reflection model, where reflection is stronger in the soft band). This produces a constant positive hard lag at low frequencies, which breaks at a time scale comparable to the light travel time at the outer radius of the scattering medium. In this model, lag transfer functions with sharp edges (e.g. a top hat function) produce oscillations in the lag spectra. If small lags from close to the line of sight are removed, these oscillations may go negative at high frequencies. However, as shown by M10b, it is difficult to obtain negative lags that are as broad in frequency as those seen in the data. There are two main reasons for this. First, the oscillations in lag have frequency-width of order , where is the largest lag produced in the transfer function. The magnitude of the negative lag itself scales with . As a consequence, making the lag more negative forces it to be narrower. The second reason is the fast decay of the response of the hard reflector at these short time scales. Fast variability is smeared out by the extended transfer function, and the lag tends to zero as the source variability is now dominated by the direct emission.
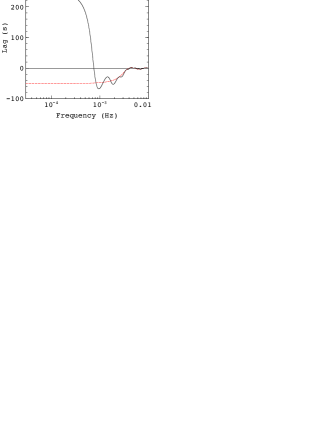
This suppression of reflected emission at high frequencies was overcome in M10b by introducing an additional top-hat transfer function in the soft band, which cuts off at a much shorter time-lag (150 s). The effect of this component is to reproduce the broad negative lag above the hard-lag cut-off in the lag spectrum, as demonstrated in Fig. 3, which shows the contributions of the transfer functions in the soft and hard bands. The soft reflection component, due to its narrow transfer-function, dominates the lag at high frequencies, up to frequencies corresponding to the maximum lag in the transfer function where the reflector variability becomes suppressed. At high frequencies, the effect of the hard lagging component is only to produce the narrow oscillations superimposed on the lags, which are not detectable in the data. Therefore, even for the large-scale reflection model, where the low-frequency hard lags are produced by reflection, a soft band reflector is required which is of much smaller scale, at least in terms of the width of the transfer function. M10b suggest that the small lags of this component need not correspond to a reflector of small intrinsic size, since the lags represent the light-travel delay between the direct continuum and the reflected signal seen by the observer, which depends on the source and reflector geometry and does not simply correspond to the actual light-travel time between the continuum source and the reflector. However, as we will argue in Section 3, a constraining geometry is required in order for the light-travel time from the continuum to the reflector to be very different from the observed delay.
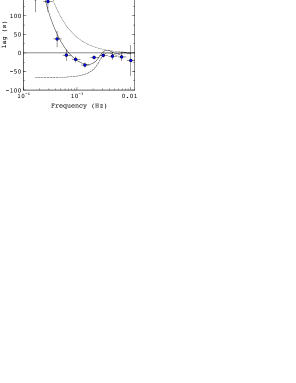
The small-scale reflection model of F09 and Z10 requires a separate, non-reflection origin for the large, low-frequency hard lags seen in the data. This interpretation is supported by the fact that, as shown in Sec. 2.1, the lags at low and high frequencies appear to be spectrally-independent. It has been shown that the propagating fluctuations model can explain most of the variability properties of accreting systems (Kotov et al. 2001; Uttley et al. 2005; Arévalo & Uttley 2006), including time lags. Although hard lags are not the main subject of this paper, we checked whether this model could explain the hard positive lags in 1H0707-495. We followed the formulation of Arévalo & Uttley (2006) (equation 3 in particular), where the lag depends on the emissivity of the disc, the fluctuations propagation speed and accretion disc parameters (see Arévalo & Uttley 2006 for details). The soft lags have to be taken as a separate component. Fig. 4 shows the model from Arévalo & Uttley (2006) along with the data. We used emission region size of few gravitational radii and a steep emissivity profile as observed. The model does not represent a fit as several combinations of parameters can reproduce the data, but it shows that it is consistent with the observation. Although in the original model, the emission region is extended, lags for a compact region can be produced if for example the Comptonising corona sees seed photons caused by accretion flucutations before they reach and modulate the emission region, or if magnetic energy is fed to the emission region from different radii. In fact, any model that is used to explain the hard lags in GBH and AGN can be used here, taking the soft lag as a separate component. In Fig. 4 we used a simple uniform reflection transfer function of the form discussed in earlier.
3 Discussion
There are fundamental differences between the small and large-scale (inner and outer) reflector interepretations of the soft lag. We have already shown that the small-scale reflection model of F09 and Z10 fits the energy spectrum, spectral variability and timing properties of the data very well. This self-consistency is particularly apparent in the striking match with the lag-energy spectrum in Fig. 1. A comparison of energy spectrum and timing properties has not yet been performed for the large-scale outer reflection model of M10b, because no self-consistent spectrum and energy-dependent transfer-function has been produced for a large-scale reflector. But it is clear that agreement between the spectrum and timing data would need to satisfy stringent constraints.
The large-scale lag model has several problems. Any reflection model predicts that there is a substantial contribution from scattered light in the energy spectrum. This would be seen as a blend of continuum and reprocessed emission features mainly from Iron and Oxygen. Absorption signatures are also expected to be imprinted in such spectra (e.g. Sim et al. 2010). Unless the reflection is relativistically smeared (as in the case of the small-scale inner reflector), these can be ruled out in 1H0707-495 because of the absence of any narrow emission or absorption features in the spectrum (Z10, Blustin & Fabian 2009).
Considering the simplicity of the models, M10b suggest that the large-scale reflector model is more parsimonious than that of the small-scale reflector, since in the small-scale reflector model, soft and hard lags are attributed to two separate processes, whereas the large-scale reflector can also produce soft lags. However, we have demonstrated that in order to reproduce soft lags over a broad frequency range as observed, the M10b model still requires a different transfer function in the soft band that is much narrower compared to that in the hard band. Therefore, mathematically the two models are identical: both require two different transfer function components to reproduce the lag-vs-frequency dependence. The difference is that in the F09/Z10 model, the soft transfer function is naturally explained by highly relativistic emission (iron L line in the soft band) from a small region. In the M10b model, it is introduced to broaden the soft lags. Its physical origin has to be a small-scale reflector or one that is close to the line of sight.
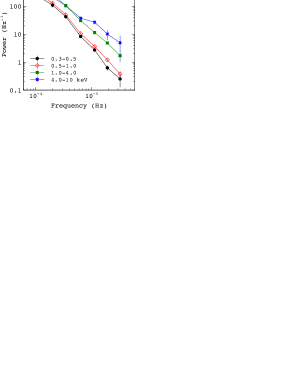
Now we consider the consistency of the models with other observations. If the variability is dominated by two different processes, as suggested by the small-scale reflection model, one might expect other timing properties to show evidence for this. In fact, this appears to be the case. In Fig. 5, we show the power spectral densities of variations of 1H0707-495 in several energy bands. The hardest band shows extra power at high frequencies, which can be explained if there is a separate high-frequency component of variability which shows a different dependence on energy than the low-frequency component. Similar behaviour has been seen in the NLS 1 Ark 564, also corresponding to frequencies where there is a sharp drop to negative lags (McHardy et al., 2007).
Further evidence for a two-component interpretation of the variability can be found in the coherence function (Fig. 18 in Z10). The coherence is high at low and high frequencies (, where 0 means the signals are not coherent and 1 means they are fully coherent) and drops in between () in the overlap which coincides with the transition from hard to soft lags. The drop in coherence can be associated with the transition between two separate variability components: where only one dominates the coherence is maximised. It is natural to associate the change in lag and coherence with the change from a variability component dominated by propagation lags, to a faster component dominated by light-travel effects, consistent with the small-scale reflection model. Large-scale reflection should produce the opposite effect in the PSD, smearing out variability in the hardest band relative to the softer bands, contrary to what is observed, and would produce no discernable effect on the coherence, since the same process is driving the variability at all frequencies.
Finally, we consider the physical plausibility of the small and large-scale reflection models for explaining the observed time lags. Crucially, both models require a soft reflection component covering a narrow range of small lags relative to the direct continuum. The lags represent the difference in path-lengths taken to the observer by light from the direct continuum, and from the continuum source via the reflector. For the disk-like geometry in the small-scale reflection model, the small lags are then indicative of the small size of the reflector (which is the inner disk within a few gravitational radii of the black hole) and its proximity to the continuum source. However, in the large-scale reflection model, the small lags do not closely correspond to the light travel-time from the continuum to the reflector, because the reflector may have a non-disk-like geometry, and the difference in path-lengths between direct and reflected light is strongly dependent on that geometry. In this way, the distance from the continuum to the reflector may be substantially larger than the light-travel time. However, as we pointed out in Section 2.2, the distant reflector model remains a mathematical description of the lag spectrum, with no self consistent physical picture. Furthermore, the model can be ruled out when hard lags in Galactic black holes are considered. Kotov et al. (2001) have shown that the predicted signatures of large-scale reflectors are not seen in the lag-energy spectra of Galactic black holes, and yet hard lags are still seen, favouring a propagation interpretation for these lags.
In conclusion, our latest timing results confirm the inner reflector model, which also gives a self-consistent spectral model. The X-ray spectra and timing of 1H0707-495 are dominated by emission and reflection from just a few gravitational radii around the central black hole.
4 Summary
-
•
The detailed lag-energy spectrum can be well modelled self-consistently with small-scale inner reflection very close to the black hole. The contrary conclusions of M10b are a consequence of not accounting for the blackbody component dominating the spectrum at very soft energies.
-
•
Time delays, power spectra and the coherence functions all indicate the presence of two variability processes: a low frequency component possibly due to propagating fluctuations, and a high frequency small-scale reflector. These cannot be explained self-consistently with a large-scale reflector, and in some cases, they are opposite to what it predicts.
-
•
The large-scale reflection model of M10b cannot produce soft lags over a broad frequency range as observed without invoking an extra small-scale soft transfer function, due to clouds close to the line of sight. This require a specific geomety putting the observer in a special position and making it difficult to produce the observed spectrum.
-
•
The M10b lag model looks at lags independently of the energy spectrum. The lag spectrum puts tight constraints on the ionisation of the distant reflector, where it has to be stronger in the hard band. The model then predicts sharp emission and absorption features which are not observed.
Acknowledgements
AZ thanks the Cambridge Overseas Trust and STFC. PU is supported by an STFC Advanced Fellowship and funding from the European Community’s Seventh Framework Programme (FP7/2007-2013) under grant agreement number ITN 215215 ”Black Hole Universe”. ACF thanks the Royal Society for support. The authors thank the anonymous referee for their comments.
References
- Arévalo et al. (2008) Arévalo P., McHardy I. M., Summons D. P., 2008, MNRAS, 388, 211
- Arévalo & Uttley (2006) Arévalo P., Uttley P., 2006, MNRAS, 367, 801
- Blustin & Fabian (2009) Blustin A. J., Fabian A. C., 2009, MNRAS, 399, L169
- Cackett et al. (2008) Cackett E. M., Miller J. M., Bhattacharyya S., Grindlay J. E., Homan J., van der Klis M., Miller M. C., Strohmayer T. E., Wijnands R., 2008, ApJ, 674, 415
- Fabian et al. (2002) Fabian A. C., Vaughan S., Nandra K., Iwasawa K., Ballantyne D. R., Lee J. C., De Rosa A., Turner A., Young A. J., 2002, MNRAS, 335, L1
- Fabian et al. (2009) Fabian A. C., Zoghbi A., Ross R. R., Uttley P., Gallo L. C., Brandt W. N., Blustin A. J., Boller T., Caballero-Garcia M. D., Larsson J., Miller J. M., Miniutti G., Ponti G., Reis R. C., Reynolds C. S., Tanaka Y., Young A. J., 2009, Nature, 459, 540
- Kotov et al. (2001) Kotov O., Churazov E., Gilfanov M., 2001, MNRAS, 327, 799
- Lyubarskii (1997) Lyubarskii Y. E., 1997, MNRAS, 292, 679
- McHardy et al. (2007) McHardy I. M., Arévalo P., Uttley P., Papadakis I. E., Summons D. P., Brinkmann W., Page M. J., 2007, MNRAS, 382, 985
- McHardy et al. (2004) McHardy I. M., Papadakis I. E., Uttley P., Page M. J., Mason K. O., 2004, MNRAS, 348, 783
- Miller (2007) Miller J. M., 2007, ARA&A, 45, 441
- Miller et al. (2010) Miller L., Turner T. J., Reeves J. N., Braito V., 2010, ArXiv e-prints
- Miller et al. (2010) Miller L., Turner T. J., Reeves J. N., Lobban A., Kraemer S. B., Crenshaw D. M., 2010, MNRAS, 403, 196
- Miyamoto & Kitamoto (1989) Miyamoto S., Kitamoto S., 1989, Nature, 342, 773
- Nandra et al. (2007) Nandra K., O’Neill P. M., George I. M., Reeves J. N., 2007, MNRAS, 382, 194
- Nowak et al. (1999) Nowak M. A., Vaughan B. A., Wilms J., Dove J. B., Begelman M. C., 1999, ApJ, 510, 874
- Nowak et al. (1999) Nowak M. A., Wilms J., Dove J. B., 1999, ApJ, 517, 355
- Pottschmidt et al. (2000) Pottschmidt K., Wilms J., Nowak M. A., Heindl W. A., Smith D. M., Staubert R., 2000, A&A, 357, L17
- Poutanen (2001) Poutanen J., 2001, Advances in Space Research, 28, 267
- Reis et al. (2010) Reis R. C., Fabian A. C., Miller J. M., 2010, MNRAS, 402, 836
- Revnivtsev et al. (2000) Revnivtsev M., Gilfanov M., Churazov E., 2000, A&A, 363, 1013
- Sim et al. (2010) Sim S. A., Miller L., Long K. S., Turner T. J., Reeves J. N., 2010, MNRAS, 404, 1369
- Tanaka et al. (1995) Tanaka Y., Nandra K., Fabian A. C., Inoue H., Otani C., Dotani T., Hayashida K., Iwasawa K., Kii T., Kunieda H., Makino F., Matsuoka M., 1995, Nature, 375, 659
- Uttley et al. (2005) Uttley P., McHardy I. M., Vaughan S., 2005, MNRAS, 359, 345
- Zoghbi et al. (2010) Zoghbi A., Fabian A. C., Uttley P., Miniutti G., Gallo L. C., Reynolds C. S., Miller J. M., Ponti G., 2010, MNRAS, 401, 2419