Backsplash Galaxies in Isolated Clusters
Abstract
At modest radii from the centre of galaxy clusters, individual galaxies may be infalling to the cluster for the first time, or have already visited the cluster core and are coming back out again. This latter population of galaxies is known as the backsplash population. Differentiating them from the infalling population presents an interesting challenge for observational studies of galaxy evolution. To attempt to do this, we assemble a sample of 14 redshift- and spatially-isolated galaxy clusters from the Sloan Digital Sky Survey. We clean this sample of cluster-cluster mergers to ensure that the galaxies contained within them are (to an approximation) only backsplashing from the centre of their parent clusters and are not being processed in sub-clumps. By stacking them together to form a composite cluster, we find evidence for both categories of galaxies at intermediate radii from the cluster centre. Application of mixture modelling to this sample then serves to differentiate the infalling galaxies (which we model on galaxies from the cluster outskirts) from the backsplash ones (which we model on galaxies in the high density core with low velocity offsets from the cluster mean). We find that the fraction of galaxies with populations similar to the low velocity cluster core galaxies is which we interpret as being the backsplash population fraction at . Although some interlopers may be affecting our results, the results are demonstrated to be in concordance with earlier studies in this area that support density-related mechanisms as being the prime factor in determining the star formation rate of a galaxy.
keywords:
galaxies: clusters: general — galaxies: evolution — galaxies: kinematics and dynamics1 Introduction
During the course of its lifetime, a galaxy may travel through several different environments and be affected by different physical mechanisms in each of them. As a very simplistic, illustrative example, consider an ‘average’ test galaxy that gets accreted on to a filament of galaxies. As the galaxy flows along the filament, it may undergo some pre-processing due to first time harassment (Moore et al. 1996) caused by the increase in local galaxy density (Porter et al. 2008). The filament will eventually funnel the galaxy to anisotropically fuel the growth of a cluster of galaxies (Pimbblet 2005; see also White, Cohn & Smit 2010). If the star formation rate of the galaxy has not already undergone significant transformation due to (slow) gas starvation (cf. van der Wel et al. 2010; Balogh, Navarro, & Morris 2000; Larson, Tinsley, & Caldwell 1980), then the cluster environment will almost certainly act to truncate it to much lower levels (e.g. Lewis et al. 2002; Gómez et al. 2003; Kauffman et al. 2004; Pimbblet et al. 2006) as higher pressure and higher density mechanisms such as ram pressure stripping (Gunn & Gott 1972) and tidal interaction with the cluster gravitational potential (Byrd & Valtonen 1990; Rose et al. 2001) become more important. Additionally, ram pressure stripping may also induce a final star star formation episode in a galaxy to remove any remaining gas (Smith et al. 2010a).
These mechanisms may also change the morphology of the galaxy by (e.g.) perturbation of spirial arms (Quilis, Moore, & Bower 2000) and the colour will get progressively redder as the star-formation rate declines and the bluer stellar population dies off. Such processes are generally posited to contribute to the well-known morphology-density and density-star formation rate relationships (e.g. Dressler 1980; Smith et al. 2005; Holden et al. 2007). Taken together, the origin of these relations appear dependant on a variety of physical mechanisms that act on distinct galaxy masses, at different epochs, and over certain time-scales.
Attempting to analyze the star formation rates of such galaxies in order to extract more general conclusions about the driving mechanisms behind galaxy evolution and the morphology-density relation is not without its trials. For example, the work of Porter et al. (2008) examines the star-formation rate of galaxies as a function of cluster-centric radius along the vector of a filament going away from a cluster core. They suggest there is a peak in star-formation rate at a few Mpc from the cluster core along filaments driven mostly by light from dwarf galaxies – this is something that would not be seen if one simply averages all vectors away from the cluster core, as works such as Lewis et al. (2002), Gómez et al. 2003, and Pimbblet et al. (2006) do.
One further complication to addressing the changes in star formation rate (whether radially averaged, or chosen along the vector of a filament as in Porter et al. 2008) is the presence of backsplash galaxies. Backsplash galaxies are those galaxies that have already entered the core regions of a galaxy cluster and have subsequently come back out again (Gill, Knebe, & Gibson 2005; see also Ludlow et al. 2009; Warnick et al. 2008; Aubert & Pichon 2007). The existence of backsplash galaxies is not unexpected: Balogh et al. (2000) find that 5020% of particles in the region of to from a cluster have passed within . Mamon et al. (2004) further compute that the maximum distance that a backsplash particle has is , and for a galaxy is . This is supported by Moore et al. (2004) who compute that half of all halos between and have passed through their parent cluster, many directly through the high density core regions of clusters Interestingly, Knebe et al. (2008) show that the backsplash population is predicted to exist in more than one cosmology.
The implication of these findings is observationally concerning: to understand the origin of (e.g.) the morphology-density relation and the mechanisms that drive galaxy evolution, we should in principle objectively disentangle the backsplash galaxy population from those that are infalling to the cluster for the first time.
Gill et al. (2005) provide a succinct observational method to detect the presence of a backsplash population in galaxy clusters. Given that the backsplash population will have a distinct velocity distribution, observers need simply to examine the distribution in a suitably large radius interval from the cluster centre, say between 1 and 2 virial radii. A backsplash population will exhibit a centrally peaked distribution for this interval, whereas a pure infalling population will possess a higher modal value.
A number of observational studies have now confirmed the existence of a backsplash population in galaxy clusters (e.g. Aguerri & Sanchez-Janssen 2010; Smith et al. 2010b; Sato & Martin 2006; Pimbblet et al. 2006; Rines et al. 2005; Sanchis et al. 2004). Yet, although these studies strongly suggest that the backsplash population exists, they have not in detail disentangled the backsplash population from the infalling one, although using galaxies with different spectral features appears to hold much promise for this (see Pimbblet et al. 2006; Rines et al. 2005).
This work revisits the backsplash concept and (observationally) attacks the question of how the backsplash fraction is expected to vary with radius from the cluster centre. In Section 2, we construct a sample of isolated galaxy clusters from the Sloan Digital Sky Survey to work with. This sample should be free of significant nearby structures and sub-clumps that may be acting to pre-process before they reach the centre of their parent galaxy clusters. In Section 3 we observe the presence of the backsplash population in our sample. We apply a mixture model to deduce how the fraction of backsplash galaxies varies with radius from the centre of clusters and compare our result with previous studies in this area. In Section 4 we generalize our results and discuss a number of caveats about our work before summarizing the main findings in Section 5.
Throughout this work, we adopt H km s-1 Mpc-1, , and .
2 Sample
For this work, we wish to use a sample of galaxy clusters that are free from significant subclustering that may skew some of the earlier observational results. For instance, Pimbblet et al. (2006) make use of very X-ray bright, massive clusters, some of which exhibit significant substructure (e.g. A1664; A3888). The issue is that inside these sub-clusters, galaxies may have been already effected by various evolutionary mechanisms as if they had fallen into a cluster already. We wish to avoid this scenario as much as possible. Fortuitously, such an ensemble already exists: Plionis et al. (2009) have assembled a large sample of galaxy clusters from Abell, Corwin & Olowin (1989) that are ‘clean’ of merging and interacting clusters. This sample should be almost ideal for studying a backsplash population with, since in principle it should be free from coherent infall (e.g. large groups and sub-clusters of galaxies) and relatively isolated in space.
From the sample of Plionis et al. (2009) we select only those clusters that are contained within Sloan Digital Sky Survey (SDSS; Abazajian et al. 2009) boundaries and appear in the SDSS C4 catalogue (Miller et al. 2005) to study further – this is a matter of convenience given SDSS has good photometry down to a reasonably faint limit for nearby galaxy clusters, coupled with quality spectra. Moreover, by using SDSS as our exclusive data source, we try to actively avoid any biases that might be present in ensembles from inhomogeneous data sources. These clusters are detailed in Table 1. Given that all of them have been detected by the C4 cluster finding algorithm (Miller et al. 2005), they are not chance superpositions along the line of sight as a non-negligible fraction of Abell clusters have been shown to be (cf. Pimbblet et al. 2010; Frenk et al. 1990; Lucey 1983).
From this sample, we discard A1452. The reason for doing so is that in the C4 catalogue of Miller et al. (2005), this cluster is noted to have a high probability of having sub-clustering, as determined from a Dressler & Shectman (1988) test, despite its inclusion in the Plionis et al. (2009) sample. Additionally, A0095 is also flagged as not being highly isolated in redshift space (based on Miller et al. 2005’s ‘structure contamination flag’). We therefore discard this cluster as well. This leaves us with a sample of 14 galaxy clusters to work with.
We detail the global parameters of these clusters in Table 1 (e.g. mean redshift, ; velocity dispersion, ; X-Ray luminosity in the 0.1–2.4 keV band, ). We note that the values presented in Table 1 (i.e. sourced from Miller et al. 2005) compare very favourably to other, sometimes more extensive and deeper, studies of galaxy clusters (e.g. A1650 also appears in the Pimbblet et al. 2006 sample and exhibits completely consistent values for as used here). From the values of , we compute the virial radius () for each cluster from the expression given by Girardi et al. (1998): (where is the radius at which the mean interior density is 200 times the critical density and is well approximated by ). Although other expressions exist for similar radii (e.g. Carlberg et al. 1997 give , assuming an isothermal sphere), this expression will suffice for ultimately placing our clusters on to a common metric.
We note that the sample spans a factor of 1000 in X-Ray luminosity; from clusters that are often thought of as being amongst some of the most massive in the local Universe (A1650; cf. Pimbblet et al. 2006) to those whose luminosity is comparable to rich groups, or lower. The velocity dispersion of these clusters, however, is more in-line with that of intermediate to massive clusters (see Table 2 of Pimbblet et al. 2006) with a median value of 849 kms-1 (see also Ortiz-Gil et al. 2004 who discuss the peculiarities of the – relationship in depth). This implies that the range in total mass of our clusters is likely to be little more than a factor of assuming is a reasonable proxy for mass. The range of spans a factor of 2.4. This is shortened to only a factor of when the highest and lowest values in the sample are ignored. In terms of look-back time, the clusters span 1 Gyr range at maximum (from A0119 to A0655), or an inter-quartile range of 0.3 Gyr – short enough that the time-scales for environmental processes driving galaxy evolution will not greatly affect the sample (e.g. Kodama & Smail 2001). Or put another way: the clusters should all be at a very similar stage in their evolution.
| Name | RA | Dec | ||||
| (J2000) | (J2000) | ( erg s-1) | (km s-1) | (km s-1) | (Mpc) | |
| A0023 | 00 21 11.7 | 00 57 40 | N/A | 31854 | 558 | 1.12 |
| A0095 | 00 45 56.8 | 00 54 30 | N/A | 32736 | 611 | 1.22 |
| A0119 | 00 56 14.3 | 01 08 40 | 3.296 | 13344 | 785 | 1.57 |
| A0655 | 08 25 17.6 | 47 10 09 | 6.651 | 38136 | 813 | 1.63 |
| A1205 | 11 13 58.1 | 02 29 56 | 1.774 | 22506 | 938 | 1.88 |
| A1346 | 11 41 11.8 | 05 44 05 | 0.371 | 29472 | 852 | 1.70 |
| A1364 | 11 43 27.1 | 01 43 51 | 0.071 | 31833 | 599 | 1.20 |
| A1424 | 11 57 26.4 | 05 05 52 | 0.866 | 22764 | 780 | 1.56 |
| A1452 | 12 03 19.6 | 51 42 16 | N/A | 18471 | 762 | 1.52 |
| A1496 | 12 13 07.8 | 59 16 03 | 0.059 | 28803 | 426 | 0.85 |
| A1620 | 12 50 03.0 | 01 33 45 | 0.004 | 25275 | 1007 | 2.01 |
| A1650 | 12 58 34.7 | 01 43 15 | 6.991 | 25176 | 864 | 1.73 |
| A1767 | 13 36 31.6 | 59 08 51 | 2.429 | 21111 | 988 | 1.98 |
| A2026 | 15 08 32.0 | 00 16 03 | 0.253 | 27186 | 846 | 1.69 |
| A2048 | 15 15 20.0 | 04 23 05 | N/A | 29451 | 971 | 1.94 |
| A2670 | 23 54 13.7 | 10 25 09 | 2.281 | 22836 | 976 | 1.95 |
| †A0095 is removed from our sample on the basis of a high structure contamination | ||||||
| flag (Miller et al. 2005). | ||||||
| ‡A1452 is removed from our sample since Miller et al. (2005) indicate a high probability | ||||||
| of subclustering. | ||||||
Consequentially, we suggest that the sample contains reasonably self-similar clusters that should have comparable backsplash populations for the purposes of this study.
3 Backsplash in the Composite Cluster
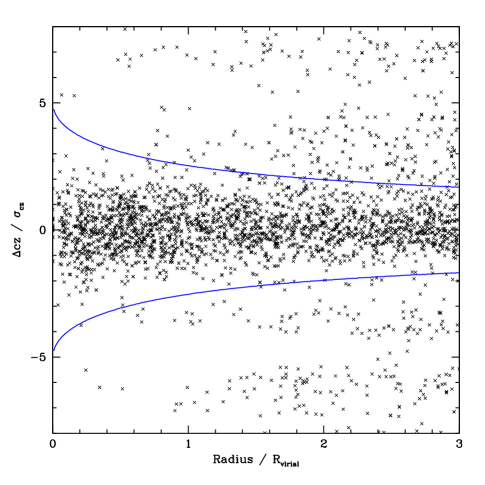
To proceed, we now extract all galaxies from SDSS that are within of their cluster centres, as given in Table 1. The homogeneity of the sample is then exploited in order to construct a stacked, composite cluster. This is done by placing the cluster on to a standard fixed metric through the use of the computed values (Table 1) and scaling each cluster by its velocity dispersion. The result of this stacking process is illustrated in Fig. 1 where all galaxies within are plotted against their scaled velocity difference from . To better define the extent of the cluster, we follow Pimbblet et al. (2006; see also Lerchster et al. 2010) and utilize the cluster mass model of Carlberg, Yee & Ellingson (1997; see also Carlberg et al. 1997; Rines & Diaferio 2010 and references therein). Only galaxies inside the mass model’s caustics (Fig. 1) are considered members and used in our subsequent analysis. The relative isolation of the composite cluster in both a radial and recession velocity sense can clearly be seen from Fig 1, even out to modestly large radii from the cluster centre; thereby validating our approach of using a reduced Plionis et al. (2009) sample.
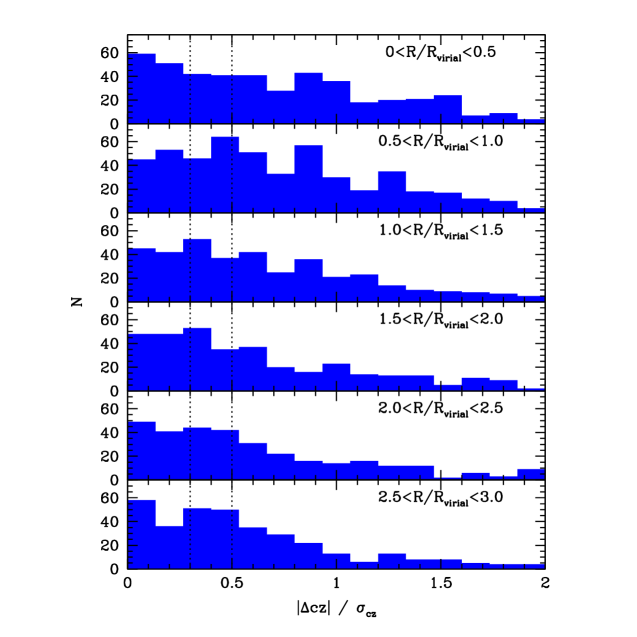
Next, we split the sample in to a number of radial bins. Following Gill et al. (2005), we create histograms of in each of these radial bins and display these distributions in Fig. 2. A pure backsplash population should appear centrally peaked in these plots, as per the predictions of Gill et al. (2005), whilst an infalling population will be peaked in the region (which we note is contained inside the mass model limits at all radii explored; Fig. 1). Indeed, the infalling population can be expected to have approximately a factor of two greater relative velocity than the backsplash ones (Gill et al. 2005) which makes the two populations kinematically distinct. Gill et al. (2005) report that if all galaxies at modest radii ( few ) are infalling, then their absolute velocity has a modal value of kms-1. For clusters such as those used in this work (and also Pimbblet et al. 2006 & Rines et al. 2005) this corresponds to approximately . Fig. 2 shows evidence for both types of populations being present, similar to previous observational studies (Rines et al. 2005; Pimbblet et al. 2006). At the centre of the composite cluster (), the distribution is markedly centrally concentrated in terms. The apparent degree of central concentration decreases with increasing radius. In the zone where we expect a mixed population (e.g., ), we see that the mode of the distribution sits in the range , as would be expected from an infalling population (Gill et al. 2005), along with many galaxies under this range (i.e. the backsplash population). As we go out to higher radii, the distinction of the modal value lessens. Furthermore, at large radii, we do not expect any backsplash galaxies to be present (Mamon et al. 2004).
3.1 Specific Star Formation Rates
In addition to the difference in the dynamics of the infall and backsplash population, a difference in star formation histories may also be present. If the backsplash population has already experienced the hostile high density core regions of a galaxy clusters (cf. Moore et al. 2004), then it follows that their star formation rate distribution should reflect this. This provides us with a method to potentially deduce the minimum fraction of backsplash galaxies present in the mixed population (Fig. 2). The reason that it will be a minimum fraction is that not 100% of the backsplash galaxies will have experienced star-formation truncation comparable to core-region galaxies – some may have more fortunate orbits around the cluster centre and retain an appreciable star formation rate. Indeed, this is supported by Rines et al. (2005) who demonstrate that some backsplash galaxies must be emission line galaxies. Hence the status of a given galaxy as being a backsplash one may not be the prime determinant of their star formation. Therefore in the analysis below we examine the specific star formation rate distribution of a large number of galaxies at various locations inside the Carlberg, Yee & Ellingson (1997; Fig. 1) cluster membership caustic.
If the galaxy population located at is considered to be a mixture of both infalling and backsplash galaxies, then we should be able to model it as a superposition of both and determine the how the fraction of backsplash galaxies varies as a function of radius from the cluster centre (cf. Rines et al. 2005; see also Pimbblet et al. 2006).
Arguably the simplest population to get a handle on is the infalling population. The simulations of Mamon et al. (2004) demonstrate almost no backsplash galaxy will reside at . We therefore assume that at radii greater than (Fig. 2), the galaxy population consists of approximately pure first-time infallers. For galaxies in the range 2–3 , we find the logarithm of the mean specific star formation rate (SSFR; in units of ; see Brinchmann et al. 2004 and www.mpa-garching.mpg.de/SDSS for details of this parameter’s derivation) is with an inter-quartile range of 1.79. If we restrict this sample to (i.e. well outside the centrally concentrated peak one might expect for backsplash galaxies, and outside the plausible maximum backsplash radii) the result does not vary considerably: with an inter-quartile range of 1.78.
We next turn to the core population. There may be some ambiguity in defining the core population due to infall interlopers at whose three dimensional radius from the cluster centre is (Diaferio et al. 2001; Rines et al. 2005). The fraction of such interlopers is expected to be low, however (perhaps 10 to 20%). Therefore in order to get a handle on the specific star formation rates in the cluster core, we restrict ourselves to not only small radii from the cluster centres (), but also to those galaxies that are highly centrally peaked (explicitly: ). This is reasonable given the predictions of the large number of backsplash galaxies and particles that have visited this zone (Balogh et al. 2000; Moore et al. 2004). For these galaxies, the mean SSFR is found to be with an inter-quartile range of 0.67.
In Fig. 3, we demonstrate how the specific star formation rate of the mixed population () varies with distance from the cluster centre. In line with other results (cf. Gómez et al. 2003), we observe a decline of SSFR at the centre of the composite cluster. Importantly, from Fig. 3, it appears to be the case that the variation of the mixed galaxy population with radius can be effectively thought of as a superposition of the core and infalling population.

3.2 Mixture Modelling
We have thus far not attacked the central question of the relative fraction of backsplash galaxies with radius in the composite cluster. To do this, we will need to evaluate what relative proportions of galaxies in the composite cluster have SSFRs that are consistent with either the core population (i.e. consistent with having their star formation rates truncated due to interactions with the hostile cluster core) or the infalling population as computed above (cf. Fig 3). This can be readily achieved using a mathematical mixture model. One of the most frequently used mixture models in galaxy cluster analysis is Kaye’s Mixture Model (KMM; Ashman et al. 1994). Although KMM is extensively used in the literature to segregate substructure in clusters (e.g. Pimbblet et al. 2010; Owers et al. 2009), it is very much a general purpose tool that can be applied to the present situation.
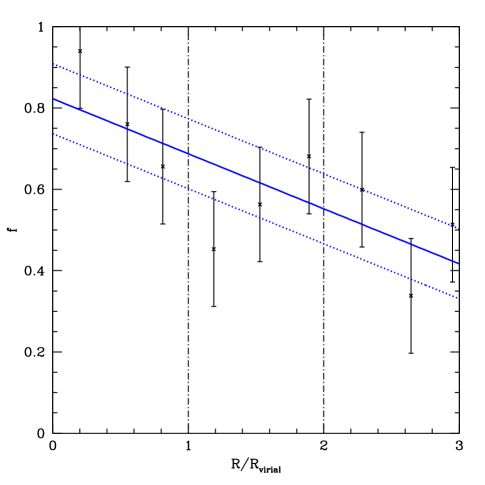
As Gaussian inputs to the KMM algorithm we supply the means and standard deviations of the SSFR for the core and infalling population that we found above. Then for radial bins in the slice, we implement KMM to partition the data and inform us of the relative fractions of galaxies that are consistent with either the low velocity offset, core region population or infalling population (as defined above). The result of this analysis is presented in Fig.4. Although there is scatter in the points, the trend shows a downward trajectory with radius. In the mixed population radial regime (), we find that the fraction of galaxies with SSFRs similar to the low velocity offset cluster core region that we are interpreting as backsplash galaxies varies from (at ) to (at ).
We note that the relationship presented in Fig.4 tells us only about the fraction of galaxies that have SSFRs consistent with the low velocity core galaxies. If we interpret these as backsplash galaxies (i.e. by assuming they have visited the hostile cluster core and had their rates truncated), we caution that the relation should only be applied at radii where mixed backsplash and infall galaxy populations are expected: especially . Outside of this regime (), there are only low (or zero) backsplash galaxies expected (cf. Mamon et al. 2004) whereas below , we are only detecting the core population that we modelled the backsplash galaxies on in the first instance.
We now ask whether our calculated backsplash values agree with previous works? One of the few predictions on this value comes from Gill et al. (2005; their Fig. 8). That prediction (reproduced in Rines et al. 2005; their Fig. 8, top panel) show that the backsplash fraction is expected to be at and . This is in agreement with our best fit line (Fig. 4).
4 Discussion
To extend the utility of our results, we show in Fig. 5 how the fraction varies as a function of radius for the entire cluster population – i.e. with no cut made on other than they fall within the cluster membership caustic (Fig. 1). The form of the slope () is much shallower than for the slice (Fig. 4). At , Fig. 5 suggests a fraction of galaxies are backsplash, dropping to at . We suspect the reason for this shallower relationship is the increase in the infalling interloper fraction due to making no cut in . Indeed, Rines et al. (2005) demonstrate that up to 60% of emission line galaxies below () are probably interlopers that have a three dimensional radius from the cluster of . Given that such emission line galaxies have significantly higher values of in clusters (Pimbblet et al. 2006; Rines et al. 2005; see also Biviano & Katgert 2004), we regard it as very likely that this is the prime cause of the change between Fig. 4 and Fig. 5.

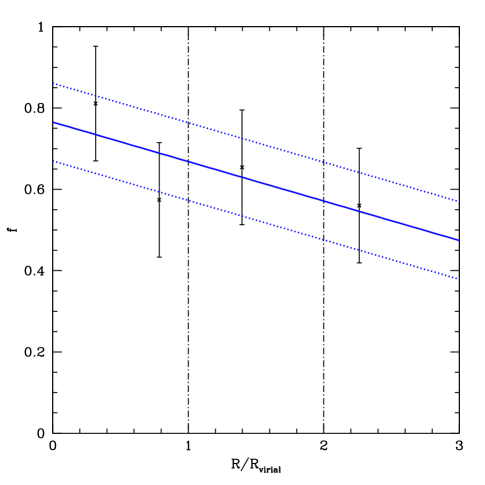
From the outset, we caution that the sample of galaxies that we have used has not been volume limited. Although we may have, in principle, circumvented this by the use of specific star formation rates (Fig. 3), it remains the case that some environmental galaxy evolution mechanisms may preferentially operate on lower mass galaxies at different radii and densities than more massive ones (e.g. Penny et al. 2010 and references therein). However, if anything, we suspect that the star formation suppression that occurs in lower mass galaxies may be more severe than in high mass ones (e.g. Boselli et al. 2008), leading to a higher fraction of backsplash galaxies in dwarf regimes at comparable radii than for their more massive cousins. To test this and create a volume-limited sample, we must necessarily truncate the clusters used to the same portion of the luminosity function. For SDSS spectroscopy of the main galaxy sample, we note that the limiting magnitude for % completeness is (Abazajian et al. 2009; Strauss et al. 2002). We use a simple stellar population coupled with a solar metallicity and formation time as input to Bruzual & Charlot’s (2003) code to predict how this magnitude limit varies as a function of redshift. Between our highest redshift cluster (A0655) and lowest (A0119), the limit corresponds to a change in absolute magnitude of . Such a large change would mean that our lowest redshift clusters would contribute only very small numbers of galaxies (1’s to 10’s of galaxies) to the composite, and overall we would be reduced to a small ( galaxies) sample size. To alleviate this issue, we consider clusters in a narrower redshift slice: from A1620 () to A1767 (). This reduced sample totals 6 clusters and spans a change of absolute magnitude of . For A1620 (the highest redshift cluster in the reduced range), the SDSS apparent magnitude completeness limit corresponds to an galaxy. We now truncate the galaxies in the other 5 clusters in the narrower redshift regime to the same limit and reproduce the above analysis on the reduced sample. Fig. 6 displays these results. At , the backsplash fraction from the fitted line is , decreasing to at . We therefore regard these volume limited results as compatible (i.e. within ) with the previous results (Fig. 5).
Lastly, we note here that changing the exact choice of the cluster centre to (e.g.) the brightest cluster member has no significant effect on the fits given in Figs. 4 through 6.
5 Summary
The main findings of this work are summarized below.
(1) We have detected a mixed population of infalling and backsplash galaxies in isolated (in both redshift space and the plane of the sky) galaxy clusters that are free from recent cluster-cluster merger activity.
(2) We have modelled the backsplash population on low velocity offset core population members under the assumption that backsplash galaxies will have had their SSFRs reduced from interaction with the hostile cluster core. This is reasonable given the predictions of the sheer numbers of backsplash galaxies that have visited this zone (cf. Moore et al. 2004). By using a mixture model, we suggest that this population follows the relation for all cluster members.
We explicitly note that this equation should only be applied where there is a mixed population expected – i.e. not in the very high density core, and not at the outskirts of the cluster where backsplash galaxies are unexpected to reside. Ideal radii for application is over the range to . We caution that this relation makes no account of infall interlopers.
(3) Our results are in broad agreement with previous observational works in this area (e.g. Pimbblet et al. 2006; Rines et al. 2005) who do not use such idealized isolated samples.
Taken together, our results support the viewpoint that mechanisms tied to local galaxy density should be more important drivers of star formation than distance to galaxy clusters. This is in agreement with, and adds weight to, our earlier results (Pimbblet et al. 2006) and is opposite to (e.g.) Whitmore, Gilmore & Jones (1993).
In the near future, it will be interesting to closely examine the results of the Galaxy and Mass Assembly survey (GAMA; Driver et al. 2010) to see what is happening in the more dwarfier regimes, and the on-going investigations of Owers et al. (2009) who have obtained very high spectroscopic completeness in a batch of clusters.
Acknowledgements
KAP thanks Michael Brown, John Stott, Isaac Roseboom & Matt Owers for useful conversations during the course of this work and also Ruth Pimbblet for inspiring it.
I would like to express my gratitude to the referee, Alexander Knebe, for rapid, useful comments and constructive advice on the earlier version of this manuscript.
This work has been generously supported through Monash University grant number 3934275.
Funding for the SDSS and SDSS-II has been provided by the Alfred P. Sloan Foundation, the Participating Institutions, the National Science Foundation, the U.S. Department of Energy, the National Aeronautics and Space Administration, the Japanese Monbukagakusho, the Max Planck Society, and the Higher Education Funding Council for England.
The SDSS is managed by the Astrophysical Research Consortium for the Participating Institutions. The Participating Institutions are the American Museum of Natural History, Astrophysical Institute Potsdam, University of Basel, Cambridge University, Case Western Reserve University, University of Chicago, Drexel University, Fermilab, the Institute for Advanced Study, the Japan Participation Group, Johns Hopkins University, the Joint Institute for Nuclear Astrophysics, the Kavli Institute for Particle Astrophysics and Cosmology, the Korean Scientist Group, the Chinese Academy of Sciences (LAMOST), Los Alamos National Laboratory, the Max-Planck-Institute for Astronomy (MPIA), the Max-Planck-Institute for Astrophysics (MPA), New Mexico State University, Ohio State University, University of Pittsburgh, University of Portsmouth, Princeton University, the United States Naval Observatory, and the University of Washington.
References
- [\citeauthoryearAbazajian et al.2009] Abazajian K. N., et al., 2009, ApJS, 182, 543
- [\citeauthoryearAbell, Corwin, & Olowin1989] Abell G. O., Corwin H. G., Jr., Olowin R. P., 1989, ApJS, 70, 1
- [\citeauthoryearAguerri & Sanchez-Janssen2010] Aguerri J. A. L., Sanchez-Janssen R., 2010, A&A in press, arXiv:1007.3497
- [\citeauthoryearAshman, Bird, & Zepf1994] Ashman K. M., Bird C. M., Zepf S. E., 1994, AJ, 108, 2348
- [\citeauthoryearAubert & Pichon2007] Aubert D., Pichon C., 2007, MNRAS, 374, 877
- [\citeauthoryearBalogh, Navarro, & Morris2000] Balogh M. L., Navarro J. F., Morris S. L., 2000, ApJ, 540, 113
- [\citeauthoryearBiviano & Katgert2004] Biviano A., Katgert P., 2004, A&A, 424, 779
- [\citeauthoryearBoselli et al.2008] Boselli A., Boissier S., Cortese L., Gavazzi G., 2008, ApJ, 674, 742
- [\citeauthoryearBruzual & Charlot2003] Bruzual G., Charlot S., 2003, MNRAS, 344, 1000
- [\citeauthoryearByrd & Valtonen1990] Byrd G., Valtonen M., 1990, ApJ, 350, 89
- [\citeauthoryearBrinchmann et al.2004] Brinchmann J., Charlot S., White S. D. M., Tremonti C., Kauffmann G., Heckman T., Brinkmann J., 2004, MNRAS, 351, 1151
- [\citeauthoryearCarlberg et al.1997] Carlberg R. G., et al., 1997, ApJ, 476, L7
- [\citeauthoryearCarlberg, Yee, & Ellingson1997] Carlberg R. G., Yee H. K. C., Ellingson E., 1997, ApJ, 478, 462
- [\citeauthoryearDiaferio et al.2001] Diaferio A., Kauffmann G., Balogh M. L., White S. D. M., Schade D., Ellingson E., 2001, MNRAS, 323, 999
- [\citeauthoryearDressler1980] Dressler A., 1980, ApJ, 236, 351
- [\citeauthoryearDressler & Shectman1988] Dressler A., Shectman S. A., 1988, AJ, 95, 985
- [\citeauthoryearDriver et al.2010] Driver S. P., et al., 2010, MNRAS, submitted (arXiv:1009.0614)
- [\citeauthoryearEbeling et al.1996] Ebeling H., Voges W., Bohringer H., Edge A. C., Huchra J. P., Briel U. G., 1996, MNRAS, 281, 799
- [\citeauthoryearFrenk et al.1990] Frenk C. S., White S. D. M., Efstathiou G., Davis M., 1990, ApJ, 351, 10
- [\citeauthoryearGill, Knebe, & Gibson2005] Gill S. P. D., Knebe A., Gibson B. K., 2005, MNRAS, 356, 1327
- [\citeauthoryearGirardi et al.1998] Girardi M., Giuricin G., Mardirossian F., Mezzetti M., Boschin W., 1998, ApJ, 505, 74
- [\citeauthoryearGómez et al.2003] Gómez P. L., et al., 2003, ApJ, 584, 210
- [\citeauthoryearGunn & Gott1972] Gunn J. E., Gott J. R., III, 1972, ApJ, 176, 1
- [\citeauthoryearHolden et al.2007] Holden B. P., et al., 2007, ApJ, 670, 190
- [\citeauthoryearKauffmann et al.2004] Kauffmann G., White S. D. M., Heckman T. M., Ménard B., Brinchmann J., Charlot S., Tremonti C., Brinkmann J., 2004, MNRAS, 353, 713
- [\citeauthoryearKnebe et al.2008] Knebe A., Arnold B., Power C., Gibson B. K., 2008, MNRAS, 386, 1029
- [\citeauthoryearKodama & Smail2001] Kodama T., Smail I., 2001, MNRAS, 326, 637
- [\citeauthoryearLarson, Tinsley, & Caldwell1980] Larson R. B., Tinsley B. M., Caldwell C. N., 1980, ApJ, 237, 692
- [\citeauthoryearLerchster et al.2010] Lerchster M., et al., 2010, MNRAS, submitted (arXiv:1009.3930)
- [\citeauthoryearLewis et al.2002] Lewis I., et al., 2002, MNRAS, 334, 673
- [\citeauthoryearLucey1983] Lucey J. R., 1983, MNRAS, 204, 33
- [\citeauthoryearLudlow et al.2009] Ludlow A. D., Navarro J. F., Springel V., Jenkins A., Frenk C. S., Helmi A., 2009, ApJ, 692, 931
- [\citeauthoryearMamon et al.2004] Mamon G. A., Sanchis T., Salvador-Solé E., Solanes J. M., 2004, A&A, 414, 445
- [\citeauthoryearMiller et al.2005] Miller C. J., et al., 2005, AJ, 130, 968
- [\citeauthoryearMoore et al.1996] Moore B., Katz N., Lake G., Dressler A., Oemler A., 1996, Natur, 379, 613
- [\citeauthoryearMoore, Diemand, & Stadel2004] Moore B., Diemand J., Stadel J., 2004, Outskirts of Galaxy Clusters: Intense Life in the Suburbs. Edited by Antonaldo Diaferio, IAU Colloquium #195, 513
- [\citeauthoryearOrtiz-Gil et al.2004] Ortiz-Gil A., Guzzo L., Schuecker P., Böhringer H., Collins C. A., 2004, MNRAS, 348, 325
- [\citeauthoryearOwers, Couch, & Nulsen2009] Owers M. S., Couch W. J., Nulsen P. E. J., 2009, ApJ, 693, 901
- [\citeauthoryearPenny et al.2010] Penny S. J., Conselice C. J., de Rijcke S., Held E. V., Gallagher J. S., O’Connell R. W., 2010, MNRAS, in press (arXiv:1001.1755)
- [\citeauthoryearPimbblet2005] Pimbblet K. A., 2005, MNRAS, 358, 256
- [\citeauthoryearPimbblet et al.2006] Pimbblet K. A., Smail I., Edge A. C., O’Hely E., Couch W. J., Zabludoff A. I., 2006, MNRAS, 366, 645
- [\citeauthoryearPimbblet et al.2010] Pimbblet K. A., Andernach H., Fishlock C. K., Roseboom I. G., Owers M. S., 2010, MNRAS, in press (arXiv:1008.3426)
- [\citeauthoryearPlionis, Tovmassian, & Andernach2009] Plionis M., Tovmassian H. M., Andernach H., 2009, MNRAS, 395, 2
- [\citeauthoryearPopesso et al.2007] Popesso P., Biviano A., Böhringer H., Romaniello M., 2007, A&A, 461, 397
- [\citeauthoryearPorter et al.2008] Porter S. C., Raychaudhury S., Pimbblet K. A., Drinkwater M. J., 2008, MNRAS, 388, 1152
- [\citeauthoryearQuilis, Moore, & Bower2000] Quilis V., Moore B., Bower R., 2000, Sci, 288, 1617
- [\citeauthoryearReiprich, Bohringer2002] Reiprich T. H., Böhringer H., 2002, ApJ, 567, 716
- [\citeauthoryearRines et al.2005] Rines K., Geller M. J., Kurtz M. J., Diaferio A., 2005, AJ, 130, 1482
- [\citeauthoryearRines & Diaferio2010] Rines K., Diaferio A., 2010, AJ, 139, 580
- [\citeauthoryearRose et al.2001] Rose J. A., Gaba A. E., Caldwell N., Chaboyer B., 2001, AJ, 121, 793
- [\citeauthoryearSadat et al.2004] Sadat R., Blanchard A., Kneib J.-P., Mathez G., Madore B., Mazzarella J. M., 2004, A&A, 424, 1097
- [\citeauthoryearSanchis et al.2004] Sanchis T., Mamon G. A., Salvador-Solé E., Solanes J. M., 2004, A&A, 418, 393
- [\citeauthoryearSato & Martin2006] Sato T., Martin C. L., 2006, ApJ, 647, 946
- [\citeauthoryearSmith et al.2005] Smith G. P., Treu T., Ellis R. S., Moran S. M., Dressler A., 2005, ApJ, 620, 78
- [\citeauthoryearSmith et al.2010] Smith G. P., et al., 2010a, A&A, 518, L18
- [\citeauthoryearSmith et al.2010] Smith R. J., et al., 2010b, MNRAS, in press (arXiv:1006.4867)
- [\citeauthoryearStrauss et al.2002] Strauss M. A., et al., 2002, AJ, 124, 1810
- [\citeauthoryearvan der Wel et al.2010] van der Wel A., Bell E. F., Holden B. P., Skibba R. A., Rix H.-W., 2010, ApJ, 714, 1779
- [\citeauthoryearWarnick, Knebe, & Power2008] Warnick K., Knebe A., Power C., 2008, MNRAS, 385, 1859
- [White et al.(2010)] White M., Cohn J. D., Smit R., 2010, MNRAS, in press (arXiv:1005.3022)
- [\citeauthoryearWhitmore, Gilmore, & Jones1993] Whitmore B. C., Gilmore D. M., Jones C., 1993, ApJ, 407, 489