Virtual Observatory based identification of AX J194939+2631 as a new cataclysmic variable††thanks: Based on observations collected at the German-Spanish Astronomical Center, Calar Alto, jointly operated by the Max-Planck-Institut für Astronomie Heidelberg and the Instituto de Astrofísica de Andalucía (CSIC).
We report the discovery of a new cataclysmic variable (CV) among unidentified objects from the ASCA Galactic Plane Survey made using the Virtual Observatory data mining. First, we identified AX~J194939+2631 with IPHAS J194938.39+263149.2, the only prominent H emitter among 400 sources in a 1 arcmin field of the IPHAS survey, then secured as a single faint X-ray source found in an archival Chandra dataset. Spectroscopic follow-up with the 3.5-m Calar Alto telescope confirmed its classification as a CV, possibly of magnetic nature. Our analysis suggests that AX J194939+2631 is a medium distance system ( kpc) containing a late- or early- type dwarf as a secondary component and a partially disrupted accretion disc revealed by the double-peaked H line. However, additional deep observations are needed to confirm our tentative classification of this object as an intermediate polar.
Key Words.:
stars: novae, cataclysmic variables – X-rays: binaries – X-rays: individual: AX J194939+2631 – stars: individual: IPHAS J194938.39+263149.21 Introduction
Cataclysmic variables are interacting binary systems containing a white dwarf (WD) primary star and a low-mass secondary, usually late-type main sequence star. Moving about the primary star with a typical orbital period of 1 day, the secondary star fills its Roche lobe and experiences the mass loss. This matter then spirals down to the non-magnetic WD, forming an accretion disc. These systems are roughly divided into 3 main subtypes: novae (CVs exhibiting thermonuclear bursts on a WD surface resulting in a 6–19 mag increase of their optical luminosities), dwarf novae (CVs where pure disc instability causes quasiperiodic outbursts that temporarily increase optical fluxes by 2–8 mag), and nova-like CVs (non-eruptive CVs characterized by an approximately constant, high rate mass transfer, a prominent accretion disc, and a high luminosity). Magnetic CVs by definition are those, where magnetic field of the primary companion disrupts the accretion disc, either partially (intermediate polars) or totally (polars). The comprehensive and ultimate overview of CV subclasses and their properties are given in Warner (1995).
Over recent years, numerous authors undertook comprehensive CV searches in large publicly available surveys (e.g. Szkody et al. 2002; Witham et al. 2007, 2008; Denisenko & Sokolovsky 2010). New generation H surveys are especially convenient for studies like these. The recent Isaac Newton Telescope (INT) Photometric H Survey of the northern Galactic plane (IPHAS) covers latitude range providing two broad-band SDSS and and a narrow-band H magnitudes for about 300 million sources up to mag. A detailed introduction to the survey is given in (Drew et al. 2005).
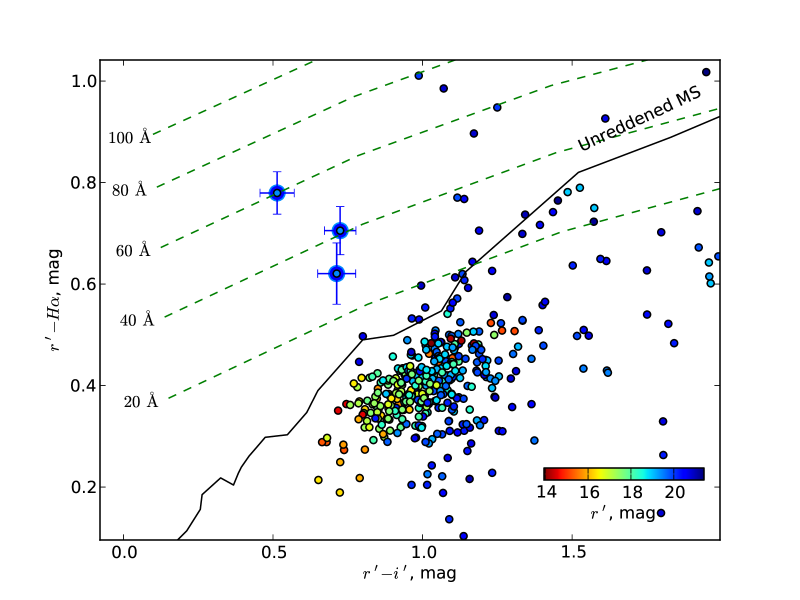
Using the two-colour diagram vs. as a primary analysis method, Witham et al. (2006) reported 70 per cent recovery rate of known CVs in IPHAS, because most of them demonstrate H emission steadily detectable in the IPHAS photometric system. Hence, this method provides a highly efficient selection criterion to distinguish between CV candidates and field stars.
2 Identification of AX J194939+2631
Generally interested in optical/NIR identification of X-ray sources with arcsec-scale error boxes (Zolotukhin et al. 2010; Zolotukhin & Revnivtsev 2010), we decided to employ the Witham et al. (2006) approach in attempt to identify CVs among unidentified X-ray sources with challenging positional uncertainties, unlikely to be studied by conventional identification techniques.
We use the ASCA Galactic Plane Survey (Sugizaki et al. 2001) carried out in 1996–1999 in a stripe partially overlapping the IPHAS footprint. This survey, originally intended to study the extended Galactic ridge X-ray emission recently explained by Revnivtsev et al. (2009), produced 163 point sources brighter than erg cm-2 s-1 in the 0.7–10 keV range, 107 of which remained unidentified. Since then, some authors attempted to explore unidentified ASCA sources using dedicated observations (see e.g. Kaur et al. (2010)), although those studies were hampered by large source density and high probability of random coincidence in 1 arcmin-scale X-ray error boxes of ASCA detections in the Galactic plane.
In our study we decided to adopt the innovative VO-powered research concept (Chilingarian et al. 2009a) including the three steps: (1) search for candidate object(s) using VO technologies and infrastructure in a semi-automatic way; (2) follow-up observations; (3) interpretation of newly obtained data together with all the information available from the VO. Worth mentioning, that the VO-based identification of an X-ray source presented hereafter was made during the tutorial for undergraduate students held at the Sternberg Astronomical Institute in May 2009111The complete step-by-step tutorial description is published at the Euro-VO web-site at http://www.euro-vo.org/pub/fc/workflows.html.
As we were to search CVs among unidentified ASCA sources, we first maximized the corresponding probability by preselection of those (1) falling into the IPHAS Initial Data Release (IDR) footprint (33 sources) (2) having hard X-ray spectra (spectral photon index ) and (3) high estimated column densities ( cm-2) indicative of large distances from the Sun. Thus we obtained a list of 6 sources which were not expected to be coronal active stars due to the imposed criteria. Then we manually explored colour–colour diagrams of IPHAS datasets in 1.3 arcmin circular fields around ASCA coordinates of these sources using VO tools, namely cds aladin (Bonnarel et al. 2000) and topcat (Taylor 2005) for quick-look purposes. We somewhat arbitrarily increased the ASCA error box radius from 1 arcmin uncertainty declared by Sugizaki et al. (2001) to 1.3 arcmin due to our own considerations. On average, there are IPHAS sources falling inside such a positional uncertainty.
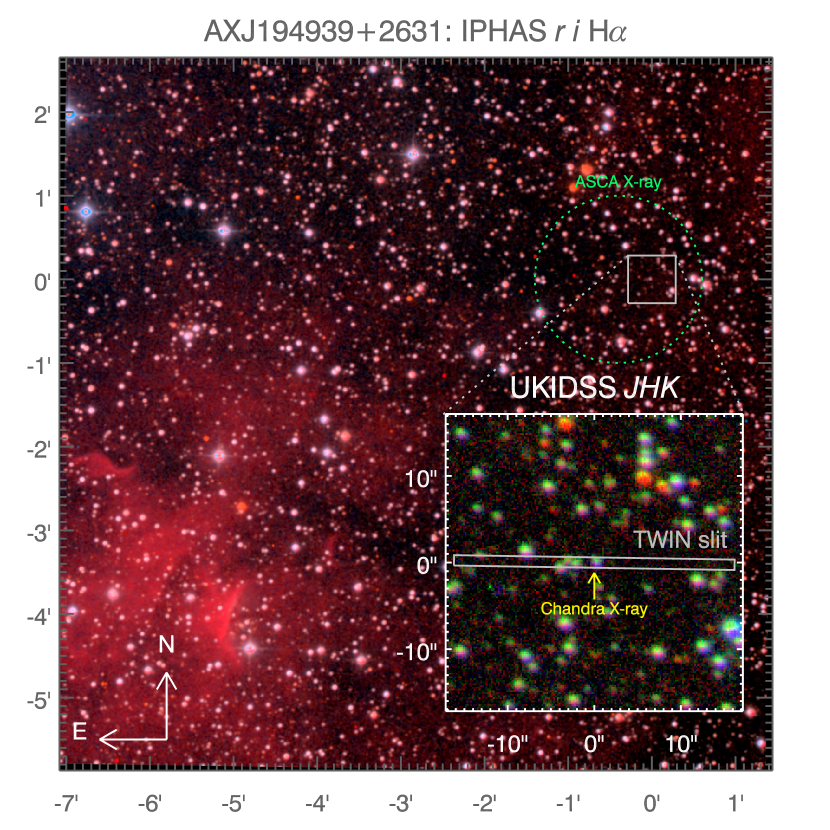
For one of the sources, AX J194939+2631, we found single easily detectable prominent H emitter in IPHAS data (see Fig. 1). Despite of the presence of other sources with signs of the H emission excess, IPHAS J194938.39+263149.2 is the only one in the field exhibiting permanent excess of high enough confidence level (see typical errors for its magnitude in Fig. 1). The photometric data gave the H EW estimate of 30–60 Å, quite typical for a CV. As the candidate falls to the corners of individual IPHAS CCD frames, it was observed 3 times on Jul 14, 2005 from 01:04 UT to 02:24 UT, giving clear signs of 0.2 mag variability in and H (see Table 1). The source is also present in UKIRT Infrared Deep Sky Survey (UKIDSS) Data Release 4 data (Lawrence et al. 2007). This way, using only VO resources, we constructed its optical/NIR spectral energy distribution (SED) shown in Fig. 3. Additional important information on the source was also found in the USNO-B1.0 catalogue (Monet et al. 2003).
Based on these data, we considered IPHAS J194938.39+263149.2 to be a tentative counterpart of AX J194939+2631 and attempted to get more evidences of their probable association.
3 Additional data

3.1 Chandra X-ray data
Having performed the preliminary VO-based identification with the most prominent H emitter in the field, we found and analysed yet unpublished publicly available X-ray data of this region obtained with the Chandra satellite on Jan 8, 2008 in the framework of the Murray (2006) programme (dataset ID 8236).
The Chandra/ACIS X-ray image taken with 1.74 ksec exposure contains a single faint object within the ASCA error box at the position RA=19:49:38.39, Dec=26:31:49.1 (J2000) determined with the 0.6 arcsec uncertainty (90 per cent confidence), that agrees well with the optical position of IPHAS J194938.39+263149.2. The X-ray dataset contains only 116 photons. Translated into 0.5-10 keV flux of erg cm-2 s-1, it does not allow us to characterize its spectrum reliably (see Fig. 4). The best-fitting model has a spectral photon index of 1.5 with column density cm.

Therefore, the Chandra data allowed us to confirm the association of a prominent H emitter with AX J194939+2631, corroborating ASCA estimates of and an X-ray flux. Hence, after careful inspection of VO resources we obtained sufficient information for reliable follow-up studies by dedicated observations (see Table 1). At that stage it already became clear, that the source was either a CV, or a high-mass X-ray binary (HMXB), based on its photometric H EW estimate and hard X-ray spectrum.
| ASCA | |
|---|---|
| Name | AX J194939+2631 |
| (, ) | (, ) |
| Flux, 0.7–10 keV | erg cm-2 s-1 |
| Spectral index | |
| Column density | cm-2 |
| IPHAS and UKIDSS | |
| Name | IPHAS J194938.39+263149.2 |
| R.A., Dec. (J2000) | (, ) |
| H | |
| H EW estimate | variable, 30–60 Å |
| USNO-B1.0 | |
| Name | USNO-B1.0 1165-0456015 |
| 20.04 mag | |
| 20.20 mag | |
| 20.12 mag | |
| 19.42 mag | |
| proper motion, RA | mas/year |
| proper motion, Dec | mas/year |
| Chandra | |
| Flux, 0.5–10 keV | erg cm-2 s-1 |
| Column density | cm-2 |
| Spectral index | 1.5 |
3.2 Optical spectroscopic data
To choose between HMXB and CV we performed dedicated optical spectroscopic follow-up observations. The data were collected on Jul 12, 2009 in the service mode with the TWIN long-slit spectrograph mounted at the 3.5 m telescope of the German–Spanish Astronomical Centre (Calar Alto Observatory) in the framework of the Director’s Discretionary Time proposal “Optical spectroscopy of AX J1949.6+2631” (P.I.: IZ). The total integration time of 2.5 h was splitted into five 1800 sec-long exposures. The T08 and T10 gratings were used in the blue and red arms of the TWIN spectrograph simultaneously with the dichroic beam-splitter covering the wavelength bands 3800–5600 Å and 5550–6900 Å with the spectral resolving power and respectively for a slit width of 1.2 arcsec. The night time calibration included bias frames, dome flat fields, He-Ar arc line spectra, and a spectrum of the Feige 110 standard star.
We reduced the data using the generic IFU/longslit data reduction pipeline implemented in idl following the same steps as those described in Chilingarian et al. (2009b). The only significant difference was the sky subtraction procedure. The TWIN data in our configuration are moderately undersampled in the blue arm and strongly undersampled in the red arm (FWHM 1 pix). Therefore, in order to prevent artifacts originating from the interpolation of undersampled air glow lines, we used the sky subtraction technique proposed by Kelson (2003). We used the entire slit length of 6 arcmin to estimate the oversampled sky spectrum, which we then approximated using the 4-th order -splines with equidistant nodes every 0.3 Å. This procedure resulted in a nearly Poisson sky subtraction quality.
The source is projected on-to a peripheral part of a Hii region well visible in Fig. 2. Therefore, its spectra are contaminated with narrow nebular emission lines. Since the nebula surface brightness changes along the slit, our sky subtraction technique left significant [positive] residuals at the source position in the following spectral lines: H, [Nii] ( Å), [Sii] ( Å). We used two 6 arcsec long segments taken on both sides of the source, interpolated the line residuals in five narrow wavelength regions ( Å) around these lines, and subtracted them from the source spectrum. The absence of any noticeable residuals in the final extracted source spectrum at the position of the four narrow forbidden lines suggests the high reliability of this procedure in the H line as well.
Then, the sky subtracted spectra were linearised using the wavelength solution defined from the automatic identification of the arc line spectra. The systematic errors of the wavelength solution are about 0.07 Å and 0.05 Å in the blue and red arms respectively.
Interestingly, the residuals of the sky subtraction with the Kelson (2003) technique did not exceed the Poisson noise in the blue arm spectra even in the H and [Oiii] lines, suggesting high interstellar extinction and, consequently, a large distance to the Hii region.
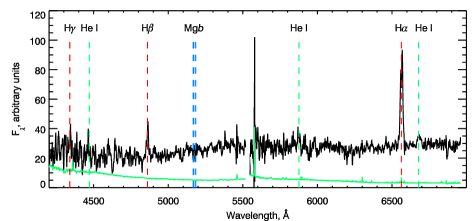
The co-added, extracted, merged spectrum of IPHAS J194938.39+263149.2, flux calibrated up-to an arbitrary constant is displayed in Fig. 5. Several broad emission lines of neutral hydrogen and helium are clearly visible. Hei line (=4471 Å) is detected only marginally, as our measurements are hampered by the low sensitivity in the blue spectral range. Where possible, we computed lines fluxes and equivalent widths by estimating the pseudo-continuum level at the regions beyond 1000 km s-1 from the expected line central wavelength assuming zero line-of-sight velocities. The obtained equivalent widths and flux ratios are provided in Table 2.
| Line | EW, Å | line ratio |
|---|---|---|
| H | 1.0 | |
| H | 3.51.0 | |
| H | 5.52.0 | |
| He i 4471 | 1411 | |
| He i 5876 | 8.04.2 | |
| He i 6678 | 7.32.8 |
4 Discussion
Detected at their restframe wavelengths, He emission lines and central H absorption, as well as the non-zero proper motion of the object in USNO-B1.0 (at least along one coordinate, see Table 1), clearly indicate that this optical source belongs to the Galaxy. The central absorption in H has zero velocity within km s-1. If the source had been distant, at this Galactic longitude ( deg) its radial velocity would have significant non-zero value due to the Galactic differential rotation. Sign of its RA proper motion is also in favour of it to reside in the foreground part of the Galaxy, i.e. much closer than 8 kpc. Relatively nearby location automatically rules out the high-mass X-ray binary nature of our object, as its derived X-ray luminosity is too low for this class of sources: kpc erg cm-2.
The observed small Balmer decrement likely means insignificant interstellar reddening. The assumptions of typical conditions in the emitting region (/ flux ratio of 2.86) and the standard extinction law are translated into and . In this case, the mismatch with X-ray data showing significant line-of-sight absorption can be explained by the difference in the geometry of emitting regions: harder radiation comes from the central source with local absorption material, whereas the optical spectrum originates from outer parts of the accretion disc subject to much lower intrinsic extinction. The circumstellar nature of the X-ray absorption is supported by the fact that the whole line-of-sight Galactic extinction of mag (Schlegel et al. 1998) is not enough to account for ASCA and Chandra values of cm-2, assuming the standard extinction law with . The 3D Galaxy extinction map (Marshall et al. 2006) provides an estimate of mag at 1.5 kpc distance in this direction, suggesting that the source resides at pc, if we scale the extinction linearly.
The optical/NIR SED of the source (see Fig. 3) closely matches that of an early-M dwarf, with a pronounced blue excess in the colour (Hewett et al. 2006), which actually falls into the most densely populated region in the colour distribution of known CVs (Witham et al. 2006). Weak barely detected Mg absorption together with the lack of strong molecular bands and red continuum suggests the same classification. Early-M dwarfs are faint objects with a relatively narrow range of absolute magnitudes (). Hence, we estimate the distance to the object in a relatively extinction-free NIR band as pc, which is in a good agreement with the value derived above. The source therefore possesses quite moderate X-ray luminosity in the 0.7–10 keV range, erg cm-2 at 600 pc, though it is not certain how the intrinsic extinction can affect the observed value.
We detect hydrogen emission lines up-to H in the optical spectrum of the source as well as some Hei lines, both almost unambiguously characteristic to CVs. However, similar features can be present in optical spectra of other object classes such as active late-type stars, symbiotics and Be stars. Symbiotics do exhibit absorptions of a late-type giant and significantly broader EW of H (hundreds of Å), which we do not observe here. Be stars can be discerned on a basis of their continua: they show a pure SED of an early-type star, clearly not the case for our data. Active late-type stars typically have much narrower H, known to be less than 10 Å (Pettersen & Hawley 1989), as well as strong molecular absorptions, which we do not detect. We stress that these object types are not known to produce such hard X-ray spectra as demonstrated in Fig. 4. Finally, the Hei (6678 Å) emission line is present in the spectrum, which is not expected for other types of systems (Witham et al. 2007). We therefore clearly classify the source as a CV.
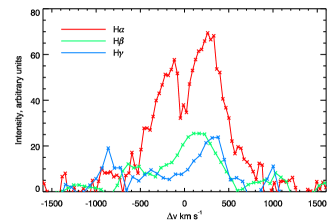
Assuming , we can estimate the intrinsic ratio to be around 10, corrected for intervening Galactic extinction in the optical. This quite high X-ray to optical ratio, as well as the hard spectrum and significant intrinsic extinction in X-ray, rule out the dwarf nova classification, suggesting the source to be a nova-like variable, either magnetic or not (Warner 1995). The double-peaked H profile (see Fig. 5, right panel) indicates the presence of an accretion disc, so the polar nature looks unfavourable. However, an intermediate polar with an accretion ring at inclinations deg is able to produce such a profile with deep absorption and moderate separation between the peaks. We cannot explain single-peaked redshifted profiles of other hydrogen emission lines without risk of overinterpreting our low signal-to-noise data, but this is possibly caused by different geometries of emitting regions (though H peaks are also asymmetric, the red one being stronger) and a 2.5 h long integration during the corresponding phase of a spin wave. At the same time, if the orbital period is comparable to or lower than 2.5 h, this asymmetry can suggest the emission to originate predominantly from only one pole (Warner 1995; Hellier 1999).
We notice, however, that the main difficulty with the magnetic CV explanation is the lack of high ionisation lines (Heii, Ciii, Niii) in the observed spectrum. Although, this can be explained by the low signal-to-noise ratio of our optical data. Additional data of better quality should be obtained to make solid conclusions about the nature of this system. X-ray timing studies to possibly detect periodicities and/or phase-resolved deep spectroscopic observations are required to confirm our tentative classification of this system as an intermediate polar.
Acknowledgements.
We thank Calar Alto Observatory for allocation of director’s discretionary time to this programme. We would like to thank M. Revnivtsev for his invaluable help with processing of the Chandra dataset. This research has made use of the VizieR catalogue access tool, CDS, Strasbourg, France. IZ was supported by Russian state contract No. 02.740.11.0575 and a grant of VO-Paris Data Centre.References
- Bonnarel et al. (2000) Bonnarel, F., Fernique, P., Bienaymé, O., et al. 2000, A&AS, 143, 33
- Chilingarian et al. (2009a) Chilingarian, I., Cayatte, V., Revaz, Y., et al. 2009a, Science, 326, 1379
- Chilingarian et al. (2009b) Chilingarian, I. V., Novikova, A. P., Cayatte, V., et al. 2009b, A&A, 504, 389
- Denisenko & Sokolovsky (2010) Denisenko, D. V. & Sokolovsky, K. V. 2010, submitted to Astronomy Letters, arXiv:1007.1798
- Drew et al. (2005) Drew, J. E., Greimel, R., Irwin, M. J., et al. 2005, MNRAS, 362, 753
- Hellier (1999) Hellier, C. 1999, ApJ, 519, 324
- Hewett et al. (2006) Hewett, P. C., Warren, S. J., Leggett, S. K., & Hodgkin, S. T. 2006, MNRAS, 367, 454
- Kaur et al. (2010) Kaur, R., Wijnands, R., Paul, B., Patruno, A., & Degenaar, N. 2010, MNRAS, 402, 2388
- Kelson (2003) Kelson, D. D. 2003, PASP, 115, 688
- Lawrence et al. (2007) Lawrence, A., Warren, S. J., Almaini, O., et al. 2007, MNRAS, 379, 1599
- Lupton et al. (2004) Lupton, R., Blanton, M. R., Fekete, G., et al. 2004, PASP, 116, 133
- Marshall et al. (2006) Marshall, D. J., Robin, A. C., Reylé, C., Schultheis, M., & Picaud, S. 2006, A&A, 453, 635
- Monet et al. (2003) Monet, D. G., Levine, S. E., Canzian, B., et al. 2003, AJ, 125, 984
- Murray (2006) Murray, S. 2006, in Chandra Proposal, 2272–+
- Pettersen & Hawley (1989) Pettersen, B. R. & Hawley, S. L. 1989, A&A, 217, 187
- Revnivtsev et al. (2009) Revnivtsev, M., Sazonov, S., Churazov, E., et al. 2009, Nature, 458, 1142
- Schlegel et al. (1998) Schlegel, D. J., Finkbeiner, D. P., & Davis, M. 1998, ApJ, 500, 525
- Sugizaki et al. (2001) Sugizaki, M., Mitsuda, K., Kaneda, H., et al. 2001, ApJS, 134, 77
- Szkody et al. (2002) Szkody, P., Anderson, S. F., Agüeros, M., et al. 2002, AJ, 123, 430
- Taylor (2005) Taylor, M. B. 2005, in Astronomical Society of the Pacific Conference Series, Vol. 347, Astronomical Data Analysis Software and Systems XIV, ed. P. Shopbell, M. Britton, & R. Ebert, 29–+
- Warner (1995) Warner, B. 1995, Cataclysmic variable stars, Cambridge Astrophysics Series, Cambridge, New York: Cambridge University Press, ed. B. Warner
- Witham et al. (2007) Witham, A. R., Knigge, C., Aungwerojwit, A., et al. 2007, MNRAS, 382, 1158
- Witham et al. (2008) Witham, A. R., Knigge, C., Drew, J. E., et al. 2008, MNRAS, 384, 1277
- Witham et al. (2006) Witham, A. R., Knigge, C., Gänsicke, B. T., et al. 2006, MNRAS, 369, 581
- Zolotukhin & Revnivtsev (2010) Zolotukhin, I. & Revnivtsev, M. 2010, accepted to MNRAS, arXiv:1009.2454
- Zolotukhin et al. (2010) Zolotukhin, I. Y., Revnivtsev, M. G., & Shakura, N. I. 2010, MNRAS, 401, L1