11email: cowley@umich.edu 22institutetext: AIP, An der Sternwarte 16, 14482 Potsdam, Germany
22email: shubrig@aip.de 33institutetext: Instituto de Ciencias Astronómicas, del la Tierra y del Espacio, Casilla 49, 5400 San Juan, Argentina
33email: fgonzalez@icate-conicet.gob.ar
Lanthanides and other spectral oddities in a Centauri††thanks: Based on observations collected at the European Southern Observatory, Paranal, Chile (ESO programmes 65.L-0316(A), 073.D-0504(A), and 076.B-0055(A))
Abstract
Context. There is considerable interest in the helium variable a Cen as a bridge between helium-weak and helium-strong CP stars.
Aims. We investigate Ce iii and other possible lanthanides in the spectrum the of hottest chemically peculiar (CP) star in which these elements have been found. A Kr ii line appears within a broad absorption which we suggest may be due to a high-level transition in C ii.
Methods. Wavelengths and equivalent widths are measured on high-resolution UVES spectra, analyzed, and their phase-variations investigated.
Results. New, robust identifications of Ce iii and Kr ii are demonstrated. Nd iii is likely present. A broad absorption near 4619 is present at all phases of a Cen, and in some other early B stars.
Conclusions. The presence of lanthanides in a Cen strengthens the view that this star is a significant link between the cooler CP stars and the hotter helium-peculiar stars. Broad absorptions in a Cen are not well explained.
Key Words.:
Stars: chemically peculiar – stars: variable – stars: individual(a Cen) – line: identification1 Introduction
Upper main sequence stars exhibit a rich variety of chemical peculiarities. The anomalies seem significantly constrained by the temperature domains within which the given peculiarities are found. For example, stars with Am characteristics have temperatures below 10000K, while the Hg-Mn stars are found at higher temperatures. It is well known that the ability to find such peculiar objects spectroscopically is greatly enhanced for objects within their known and characteristic temperature domains. Increasing interest attaches to instances where the abundance or physical characteristics of one peculiar species is found across the boundary to another (Wahlgren 2004).
The helium variable, a Cen (HR 5378, HD 125823) is an interesting example of an object that crosses traditional boundaries. It has an effective temperature in the range 19,000 to 20,000K (Bohlender, Rice, and Hechler 2010, henceforth BRH). This would place it among the helium-strong chemically peculiar stars. Yet the star has long been known to vary in type from helium strong to helium weak (cf. Gray and Corbally 2009). BRH show that this variation occurs because of helium-rich and helium-poor areas on the stellar surface, which they have mapped using Doppler imaging. Interestingly, BRH identify 3He, found in other helium-weak stars such as the highly unusual phosphorus-gallium star 3 Cen A (Castelli, et al. 1997, Adelman & Pintado 2000).
In the present note, we announce the identification of the lanthanide rare earth spectrum Ce iii along with the possible presence of Nd iii. These results would associate a Cen with the cooler, traditional magnetic CP stars. We are unaware of the identification of any lanthanide spectrum in a star with this high a temperature.
2 Observations
Several UVESPOP spectra (Bagnulo, et al. 2003) of a Cen were measured for wavelengths. The spectra were all obtained on 3 March 2001, at phase 0.089 according to the ephemeris of Catalano & Leone (1996). This is near the maximum of the helium line strengths. Most of the present results rest on these spectra. Additional UVES spectra were examined to investigate phase variations. These were all obtained from 3 to 13 May of 2005, and span the 8.8-day period of the star.
3 Background
Norris (1971) reported the identification of C ii, N ii, O ii, Ne i, Mg ii, Al iii, Si ii, Si iii, S ii, and Fe iii in the spectrum of a Cen. Additionally, Fe ii and Sr ii were judged to be weakly present. We can confirm these findings. Hubrig and Gonzalez (2007) identified additional spectra: Cl ii, Ca ii, Mn ii, and Ar ii. They found Mn ii lines near 6122 Å to be in emission from phases 0.260 to 0.784. At phase 0.089, when the UVESPOP spectra were obtained, the Mn ii absorption spectrum is very weak. However, we could find several of the very strongest lines in Mn ii Multiplet 3.
We also find numerous weak Ti ii lines. Ti iii may be present at threshold, but cannot be confirmed. We find an “average” (see §4) standard deviation (sd). This is an excess of 0.8 dex above solar.
The most unusual identification by Hubrig and Gonzalez is that of Cl ii, which we confirm. The strong presence of this spectrum from ground-based spectra is not unprecedented (Cohen, et al. 1969, Sadakane 1992), but not common. Oddly, Cl ii is weak or absent in 3 Cen A and HD 65949, stars with strong P ii, but strong in HR 6870, which has modest P ii (Cowley, et al. 2010, Little 1974, Collado & López-Garcia 2009). The capricious behavior of two neighboring odd-Z elements (P: Z=15, Cl: Z=17) in similar stars argues strongly for a chemical explanation.
4 Analysis
We measured 2492 wavelengths from the UVESPOP spectrum of a Cen. These were analyzed by wavelength coincidence statistics (WCS, Cowley & Hensberge 1981). WCS gives a Monte Carlo estimate of the probability that the wavelength coincidences are due to chance. This probability, also called the “significance” of the result, depends on the tolerance for a coincidence, . In the present case, we used Å. In addition to elements found in older studies, the WCS showed a highly significant result (0.0004) for Ce iii, along with highly suggestive results for Nd iii and Kr ii.
BRH find abundance variations in helium, nitrogen, oxygen, and iron of 2 to 3 dex in different locations on the surface of a Cen. In view of these results, any abundance based on an LTE calculation with a homogeneous model atmosphere has only semi-quantitative meaning. Nevertheless, we made formal calculations, based on a plane-parallel model atmosphere with K, and for several elements. The relevant LTE codes have been in use by CRC and colleagues at Michigan for several decades (see Cowley, et al. 2000, §7, and references therein). The abundances must be considered a kind of average for the photosphere, with the nature of the average being unspecified. When the surface has been mapped, as in BRH, the nature of the average may become clarified. We refer here to “average” abundances with this qualification, and appropriate caveats for the use of LTE.
5 Ce iii
Table 1 shows laboratory () and stellar wavelengths (), excitation potentials, equivalent widths, and LTE “average” abundance calculations for 12 Ce iii lines. Oscillator strengths are from the Li, et al. (2000) when available, or the DREAM site (Biémont, et al 2002).
| (eV) | [mÅ] | |||
|---|---|---|---|---|
| 3085.10 | .07 | 2.38 | 8.2 | -8.31 |
| 3121.56 | .57 | 2.38 | 12.1 | -8.25 |
| 3141.28 | .29 | 2.41 | 5.5 | -8.36 |
| 3143.97 | .97 | 2.41 | 10.2 | -8.10 |
| 3353.29 | .32 | 2.66 | 9.9 | -8.21 |
| 3427.36 | .39 | 2.38 | 9.5 | -7.94 |
| 3443.63 | .66 | 2.38 | 10.9 | -8.02 |
| 3454.39 | .39 | 2.40 | 10.3 | -8.03 |
| 3459.39 | .41 | 2.66 | 7.7 | -8.28 |
| 3470.92 | .93 | 2.41 | 11.8 | -8.04 |
| 3504.63 | .67 | 2.71 | 11.2 | -7.85 |
| 3544.06 | .08 | 2.71 | 6.6 | -8.17 |
The result, based on the lines in Table 1 is sd which corresponds to an excess of cerium over solar of 2.3 dex (Asplund, et al. 2009). This result falls well within the range of cerium abundances found for magnetic Ap stars (Ryabchikova, et al. 2004), and for some HgMn stars (Adelman, et al. 2001ab).
The Ce iii lines vary in strength and slightly in wavelength with phase, as is illustrated in Fig. 1.

6 Nd iii, Kr ii
6.1 Neodymium
The Nd iii identification is marginal. Of the six strongest lines predicted with the DREAM oscillator strengths for K, 5 are within 0.1Å. There is no indication at all of the missing line, which probably means the others are present only because of blending–the blend strengthens the feature. The blending would account for the wavelength distortions. The strongest WCS result is 4 out of 16 strong lines within 0.06Å from a list provided to CRC by H. M. Crosswhite privately in 1976. The coincidences have a significance of 0.003. These results are typical of a spectrum plausibly present near the threshold of detectability, and requiring confirmation.
6.2 Krypton
The Kr ii identification is robust. There are seven “persistent” (P) lines in the NIST Handbook (Sansonetti & Martin 2003) within the wavelengths measured. The intensities range from 1000 to 150. The five strongest of these lines were measured, though shifted in wavelength on the UVESPOP spectrum (phase = 0.89) by an average of 0.06 Å, or about 4.5 km s-1. The lines are shown in Table 2.
| Int | (eV) | [mÅ] | |||
|---|---|---|---|---|---|
| 4355.48 | .05 | 100P | 13.99 | 6.8 | 6.01 |
| 4619.17 | .06 | 300P | 14.69 | blend | – |
| 4658.88 | .05 | 700P | 13.99 | 3.0 | 6.18 |
| 4739.00 | .07 | 1000P | 13.99 | 5.7 | 5.98 |
| 4765.74 | .06 | 300P | 14.27 | 4.5 | 6.13 |
| 4832.08 | .07 | 250P | 14.27 | 2.8 | 5.79 |
Table 2 gives gives wavelengths and intensities (Int) from the NIST Handbook of Sansonetti and Martin (2003), along with shifts from the laboratory positions. Lower excitation potentials, measured equivalent widths, and abundance estimates are also given. The five abundances are consistent within the accuracy of determinations of the present kind: sd. This is an excess of 2.8 dex over the solar abundance, similar to the Kr excess (2.9 dex) of the mid-late B star, HD 65949 (Cowley, et al. 2010).
An additional 5 non-persistent Kr ii lines with intensities from 100 to 250 were measured, or may be found on the UVES spectra: 4431.685, 4436.812, 4577.209, 4615.29, and 4762.453. Only 4431 deviates from its laboratory wavelength by more than 0.03 Å, if we use a rest radial velocity frame defined by the lines of Table 2. Moreover, this deviation may be attributed, from the broad profile, to a blend. The Kr ii identification is secure.
Kr ii, 4355 is shown at three phases in Fig. 2. The splitting at phase 0.309 (111∘) as well as the shifts of Table 2 are reasonably interpreted as due to abundance patches combined with stellar rotation. BRH’s Fig. 6, shows iron spots at phases 0.250 (90∘) and 0.375 (135∘) on leading and following hemispheres. Note that both the Kr ii and the Fe ii double at our phase 0.309. The value km s-1 is adequate to produce the 0.20Å splitting seen at phase 0.309. This interpretation assumes the krypton and iron spots are similarly placed on the stellar disk.

7 Broad absorption features
7.1 The broad absorption near 4619
One of the persistent Kr ii lines falls within a broad, shallow absorption region. The feature is present at all phases of a Cen, and is seen in some other early B spectra. For example, it may be noted by displaying the top 5 or 10% of the continuum of UVESPOP spectra of HD 133518 (B2 IV) and HD 89587 (B3 III). In Fig. 3 we illustrate the broad absorption in this region of the spectrum of the well-known B2 IV star, Peg.

Fig. 4 shows an attempt to synthesize the region. It is clear that the atomic lines used in the calculation are unable to reproduce the feature. One of the three lines within the broad region coincides with Ti iii, 4619.79, but to fit the feature, we need an abundance that yields a strong Ti iii line at 4615.93, which does not appear at all in the stellar spectrum. Neither line appears if we use the average Ti abundance from §3.
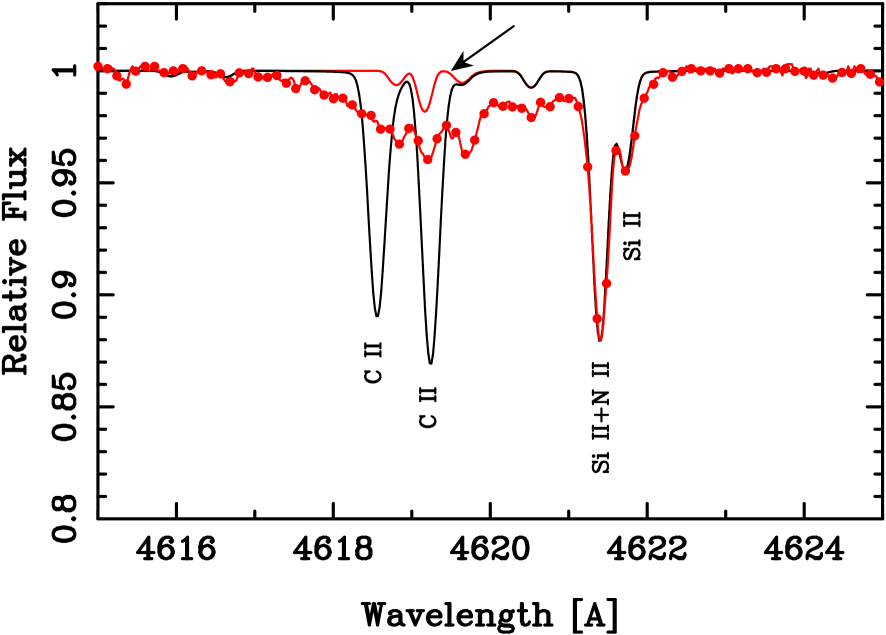
It is tempting to assign the broad feature to C ii. The two prominent calculated C ii lines in Fig. 4 were made using a carbon abundance of which was determined from 19 other C ii lines. If the feature is not due to C ii, why do these lines not appear? C ii 4618.56 and 4619.25 arise from a high-level multiplet (24.79 eV) 2s2p(3P)3d2F∘—2s2p(3P)4f 2G, with lower levels above the first ionization energy of C ii (24.38 eV). Moreover, the total absorption of the broad feature, 50 to 60mÅ, is comparable to that of the calculated C ii lines. However, the centroid of the broad feature is shifted away from the C ii lines, and the relevant energy levels for the lines are given to the hundredth of a cm-1. This does not suggest levels broadened by autoionization. The broad feature requires an explanation that must realistically include an NLTE calculation.
7.2 The putative broad Fe i absorption
Underhill and Klinglesmith (1973, see also Underhill et al. 1975) found broad absorption features in a Cen which they attributed to Fe i. Norris and Baschek (1974) were unable to confirm the presence of Fe i in their spectra. These studies were based on photographic material, but averaged to reduce the noise. While we also cannot confirm the association with Fe i, we do see broad features near two of the positions of strong Fe i lines: 4045, and 4383. These absorptions were readily detectable on UVES spectra taken at phases 0.795 and 0.944. The case that these absorptions are due to Fe i, does not seem strong, but the broad absorptions in a Cen deserve further attention.
8 Conclusions
The presence of lines of lanthanide rare earths in a star as hot as a Cen indicates that these anomalies can “cross a boundary” (Wahlgren 2004) into a temperature domain where they are not normally recognized. The likelihood that this is because of the difficulty of observing lines from these elements rather than their absence is important to note.
Acknowledgements.
CRC thanks colleagues at NIST, M. Dimitrijević and M. Bautista for useful correspondence concerning the broad absorption feature near 4619. G. M. Wahlgren kindly pointed out the reference for Ce iii oscillator strengths. This research has made use of the SIMBAD database, operated at CDS, Strasbourg, France. Our calculations made extensive use of the VALD atomic data base (Kupka, et al. 1999). Special thanks are due to the ESO staff for the UVES public data archive.References
- (1) Adelman, S. J., & Pintado, O. I. 2000, A&A, 354, 899
- (2) Adelman, S. J., Gulliver, A. F., & Rayle, K. E. 2001a, A&A, 367, 597
- (3) Adelman, S. J., Snow, T. P., Evans, I. I., et al. 2001b, MNRAS, 328, 1144
- (4) Asplund, M., Grevesse, N., Sauval, A. J., & Scott, P. 2009, Ann. Rev. Astron. Ap., 47, 481
-
(5)
Bagnulo, S., Jehin, E., Ledoux, C, et al. 2003,
ESO Msngr, 114, 10
http://www.sc.eso.org/santiago/uvespop - (6) Biémont, E., Quinet, P., & Ryabchikova, T. A. 2002, MNRAS, 336, 1155
- (7) Bohlender, D. A., Rice, J. B., & Hechler, P. 2010, A&A,520,44 (BRH)
- (8) Castelli, F., Parthasarahy, M., & Hack, M. 1997, A&A, 321, 254
- (9) Catalano, F. A., & Leone, F. 1996, A&A, 311, 230
- (10) Cohen, J. G., Deutsch, A. J., & Greenstein, J. L. 1969, ApJ, 156, 629
- (11) Collado, A., & López-García, Z. 2009, RMxAC, 45, 95
- (12) Cowley, C. R., & Hensberge, H. 1981, ApJ, 224, 252
- (13) Cowley, C. R., Hubrig, S., Palmeri, P., et al. 2010, MNRAS, 405, 1271
- (14) Cowley, C. R., Ryabchikova, T., Kupka, F., et al. 2000, MNRAS, 317, 299
- (15) Gray, R. O., & Corbally, C. J. 2009, Stellar Spectral Classification (Princton, NJ: Princeton University Press), see p. 133
- (16) Hubrig, S., & González, J. F. 2007, A&A, 466, 1083
- (17) Kupka, F., Piskunov, N., Ryabchikova, T. A., Stempels, H. C., Weiss, W. W. 1999, A&AS, 138, 119
- (18) Li, Z. S., Lundberg, H., Wahlgren, G. M., Silkström, C. M. 2000, Phys. Rev. 62A, 032505
- (19) Little, S. J. 1974, ApJ, 193, 639
- (20) Norris, J. 1971, ApJS, 23, 235
- (21) Norris, J., & Baschek, B. 1974, ApJ, 193, 133
- (22) Ryabchikova, T., Nesvacil, N., Weiss, W. W., et al. 2004, A&A, 423, 705
- (23) Sadakane, K. 1992, PASJ, 44, 125
- (24) Sansonetti, J. E., & Martin, W. C. 2003, online Handbook of Basic Atomic Spectroscopic Data: www.nist.gov/physlab/data/handbook/index.cfm
- (25) Underhill, A. B., & Klinglesmith, D. A. 1973, A&A, 25, 405
- (26) Underhill, A. B., Fahey, R. P., & Klinglesmith, D. A. 1975, ApJ, 197, 393
- (27) Wahlgren, G. M. 2004, in IAU Symp. 224, ed. J. Zverko, J. Žižnovský, S. J. Adelman, & W. W. Weiss (Cambridge: University Press), p. 291