Spectral Energy Distribution of Type Ia Supernova Hosts in GOODS: Constraints on Evolutionary Delay and the Initial Mass Function
Abstract
We identify a sample of 22 host galaxies of Type Ia Supernovae (SNe Ia) at redshifts discovered in the Hubble Space Telescope (HST) observations of the Great Observatories Origins Deep Survey (GOODS) fields. We measure the photometry of the hosts in Spitzer Space Telescope and ground-based imaging of the GOODS fields to provide flux densities from the U-band to 24 m. We fit the broad-band photometry of each host with Simple Stellar Population (SSP) models to estimate the age of the stellar population giving rise to the SN Ia explosions. We break the well-known age-extinction degeneracy in such analyses using the Spitzer m data to place upper limits on the thermally reprocessed, far-infrared emission from dust. The ages of these stellar populations give us an estimate of the delay times between the first epoch of star-formation in the galaxies and the explosion of the SNe Ia. We find a bi-modal distribution of delay times ranging from 0.06 - 4.75 Gyrs. We also constrain the first-epoch of low mass star formation using these results, showing that stars of mass M⊙ were formed within 3 Gyrs after the Big Bang and possibly by . This argues against a truncated stellar initial mass function in high redshift galaxies.
1 Introduction
It has been shown that SNe Ia are standardizable candles in that there is a very tight relation between the peak luminosity and the width of the light-curve (Phillips, 1993). For this reason SNe Ia have been used to measure the cosmic distance scale and to probe the expansion properties of the universe, leading to the discovery that its expansion rate is accelerating due to the existence of a repulsive force, given the name Dark Energy (Riess et al., 1998; Perlmutter et al., 1999). It is important to fully understand how SNe Ia are produced in order to minimize the systematic uncertainties associated with these measurements and enable the properties of the Dark Energy to be investigated as a function of cosmic time.
It is widely believed that SNe Ia are the explosion of a White Dwarf (WD) star that has reached a critical mass (the Chandrasekhar mass, Chandrasekhar, 1931). The physical mechanism leading to the WD reaching this mass is still highly debated. Broadly, there are two leading ideas for SN Ia progenitors. The first is that the WD star gains mass via accretion of material from a normal companion star which has filled its Roche Lobe, referred to as the Single Degenerate (SD) scenario. The second, the Double Degenerate (DD) scenario involves the merger of two WD stars after formation and ejection of a common envelope in a binary system (see Livio, 2001; Podsiadlowski et al., 2008, for a review).
In order to try to differentiate between these possible scenarios it is important to constrain the SN Ia delay time, i.e. the time between the formation of the stellar system and the supernova explosion. Evidence for a range of delay times has existed for some time. For example, observations show that SNe Ia are preferentially found in late type rather than early type galaxies, suggesting they are associated with young stellar populations with ages of Myrs (van den Bergh, 1990; Mannucci et al., 2005). Wang et al. (1997) showed that SNe Ia are more likely to be found in the disk of a galaxy rather than the bulge, indicating an association with recent star formation and short delay times. Studies which calculate the delay time by convolving an assumed star formation history (SFH) with a delay time distribution (DTD) have suggested longer delay times of a few Gyrs (Gal-Yam & Maoz, 2004; Strolger et al., 2004; Dahlen et al., 2004; Barris & Tonry, 2006; Dahlen et al., 2008; Strolger et al., 2010). However, Förster et al. (2006) show that these analyses depend strongly on the assumed SFH, giving large systematic errors, prompting Oda et al. (2008) to fit both the SFH and the DTD. However, those authors were only able to place weak constraints on the DTD. From a spectroscopic study of the star-formation histories of local SN Ia hosts Gallagher et al. (2005) put a lower limit on the delay time of 2 Gyrs.
Mannucci et al. (2006) have shown that a combination of observations at high and low redshift cannot be matched by a DTD with a single delay time, but that they are best matched by a bi-modal DTD. This hypothesis is developed further by various groups (Scannapieco & Bildsten, 2005; Sullivan et al., 2006; Neill et al., 2006, 2007) who model the SN Ia rate as a two-component distribution with a delayed component dependent on the host galaxy stellar mass and a prompt component dependent on the host galaxy star formation rate. Several authors have used this model to reproduce the observed SN Ia rates at (Aubourg et al., 2008; Neill et al., 2007; Dahlen et al., 2004; Botticella et al., 2008), although again these results depend on the assumed SFH. In order to avoid such an assumption, Totani et al. (2008) used an SED fitting technique to determine the ages of the host galaxy stellar populations to derive a DTD which is a power-law in the range 0.1 - 10 Gyrs. From a spectroscopic study, Howell (2001) showed that sub-luminous SNe Ia tend to come from old populations whereas over-luminous SNe Ia are from young populations, suggesting different progenitor scenarios for the two populations. Furthermore, Pritchet et al. (2008) showed that the single degenerate scenario alone is not sufficient to explain the observed DTD. By studying the local environment of SNe Ia (rather than the properties of the whole of the host galaxy) Raskin et al. (2009) found that the average delay time of nearby prompt SNe was Gyrs, although their model allows % of prompt SNe Ia to have delay times shorter than 0.1 Gyrs.
From a study of the X-ray properties of nearby ellipticals Gilfanov & Bogdan (2010) suggest that the X-ray flux from these galaxies is consistent with only 5% of SN Ia arising from accreting white dwarfs in elliptical galaxies - such systems are expected to produce X-ray emission for a significant time, whereas in the white dwarf merger (i.e. double degenerate) scenario, the X-ray emission is only present shortly before the explosion. They do not constrain the progenitors of SN Ia in late-type galaxies where the contribution from the single degenerate scenario could be significant. Using a maximum-likelihood inversion procedure, Maoz et al. (2010) recover the DTD for a sample of local SNe Ia utilising the SFH of each individual galaxy, finding evidence for both prompt (with delay times Gyrs) and delayed (with delay times Gyrs) SNe, where the DTD has a peak at short delay times but a broad distribution to longer delay times. Similar conclusions are reached by Brandt et al. (2010).
Greggio (2010) build on the parameterisation of Greggio (2005) of the evolution of binary systems to calculate some features of the DTD of single-degenerate, double degenerate and mixed model progenitor scenarios. All models are consistent with both prompt and delayed SNe, although the distributions are continuous (suggesting that the distinction is arbitrary). They do explore scenarios where there is a mix of SD and DD and where the SD contributes more prompt SNe than the DD channel, however, they see no theoretical basis for this and comparisons to the observed SN Ia rates of Greggio & Cappellaro (2009) and Sullivan et al. (2006) do not favour the mixed scenarios.
The Great Observatories Origins Deep Survey (GOODS; Dickinson et al., 2003) is a multi-wavelength survey covering arcmin2 over two fields. In conjunction with the GOODS survey a supernova search was conducted, surveying both fields at several different epochs with HST ACS (Giavalisco et al., 2004) resulting in a catalogue of 22 SNe Ia at with spectroscopic redshifts, (Riess et al., 2004, 2007). We add a further 3 SNe 1997fg, 1997ff and 2002dd from past SN searches in these fields (Gilliland et al., 1999; Riess et al., 2001; Blakeslee et al., 2003).
In the present work, we compile optical/near-infrared photometry from ACS and NICMOS on HST, Spitzer m data as well as supplementary ground-based data where available for the host galaxies of these SNe Ia. We then fit the multi-wavelength photometry of the hosts to the Single Stellar Population (SSP) models of Charlot and Bruzual (priv. com.) in order to find the ages of the stellar populations in the SN host galaxies, thus allowing us to study the delay times of SNe Ia.
Furthermore, by calculating the ages of the stellar populations we can constrain the first epoch of low mass star formation (the progenitors of SNe Ia have masses , see e.g. Blanc & Greggio, 2008, and references therein), i.e. the time after the Big Bang that stars must have formed in order to yield the stellar populations we find. This allows us to constrain models which suggest that only stars with M☉ might have formed at (Tumlinson et al., 2004).
The remainder of this paper is arranged as follows. In section 2 we describe the identification of host galaxies, in section 3 we outline the SED fitting method. We present our results in section 4 and provide a discussion of these results in section 5. Finally our conclusions are given in section 6. In the rest of this analysis we use the concordance cosmology of , and km s-1 Mpc-1. We present photometry in the AB magnitude system unless otherwise stated.
2 Host Galaxy Identification
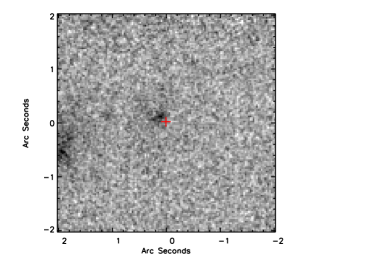
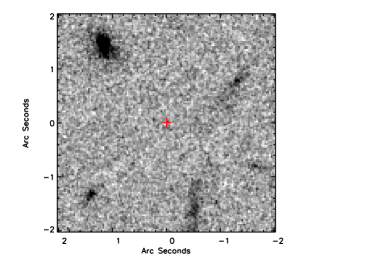
We use the supernova sample of Riess et al. (2007) with additional SNe Ia from Gilliland et al. (1999) and Blakeslee et al. (2003), giving us 25 SNe Ia at . We cross-matched these SNe Ia with the GOODS ACS v2.0 catalogue in both the Northern and Southern Fields using the software topcat (Taylor, 2003) and a cross-matching radius of 1′′. This resulted in a catalogue of 22 SNe Ia host galaxies. We then match the ACS host galaxy positions to the ground-based and IRAC positions with a radius of 05, after correcting the IRAC and ground-based catalogues for the well-known 038 offset in the GOODS North catalogues. The SN positions are also corrected for this offset where necessary. The large radius used for our initial cross-match ensures that all possible SNe Ia with detected ACS host galaxies are identified, however, it could lead to false identifications with other galaxies. Therefore we visually inspected the ACS images for each SN Ia, but all appeared to be good identifications. The three SNe with no matches are 2002dd, HST04Sas and HST04Gre. In the cases of 2002dd and HST04Sas, the host is not found in the catalogue due to confusion with nearby bright galaxies. HST04Gre appears to be a hostless SN Ia, the V-band postage stamp is shown in figure 1 along with the host for SN 1997ff in the same band, where the host is well identified. The co-ordinates of the SNe Ia and their host galaxies are given in Table 1 (SNe Ia with ambiguous host identifications are shown with only the SN coordinates given).
| SN Name | SN RA | SN Dec | Host Offset [″] | redshift |
|---|---|---|---|---|
| 1997ff | 189.18379 | 62.21244 | 0.15 | 1.75 |
| 2003es | 189.23079 | 62.21987 | 0.48 | 0.95 |
| 2003az | 189.33196 | 62.31031 | 0.16 | 1.26 |
| 2003dy | 189.28817 | 62.19128 | 0.29 | 1.34 |
| 2002ki | 189.36813 | 62.34434 | 0.33 | 1.14 |
| HST04Pat | 189.53750 | 62.31312 | 0.41 | 0.97 |
| HST05Fer | 189.10458 | 62.25662 | 0.66 | 1.02 |
| HST05Koe | 189.09550 | 62.30644 | 0.39 | 1.23 |
| HST05Red | 189.25708 | 62.20666 | 0.39 | 1.19 |
| HST05Lan | 189.23633 | 62.21481 | 0.74 | 1.23 |
| HST04Tha | 189.22987 | 62.21779 | 0.39 | 0.95 |
| HST04Eag | 189.33705 | 62.22799 | 0.46 | 1.02 |
| HST05Gab | 189.05763 | 62.20210 | 0.40 | 1.12 |
| HST05Str | 189.08596 | 62.18072 | 0.05 | 1.01 |
| 1997fg | 189.24029 | 62.22092 | 0.39 | 0.95 |
| 2003aj | 53.18471 | -27.91844 | 0.20 | 1.31 |
| 2002fx | 53.02833 | -27.74289 | 0.26 | 1.40 |
| 2003ak | 53.19542 | -27.91372 | 0.36 | 1.55 |
| 2002hp | 53.10329 | -27.77161 | 0.19 | 1.30 |
| 2002fw | 53.15633 | -27.77961 | 0.51 | 1.30 |
| HST04Mcg | 53.04250 | -27.83055 | 0.57 | 1.37 |
| HST04Omb | 53.10558 | -27.75084 | 0.22 | 0.98 |
| HST04Sas | 189.22546 | 62.13966 | - | 1.39 |
| 2002dd | 189.23067 | 62.21281 | - | 0.95 |
| HST04Gre | 53.08954 | -27.78286 | - | 1.14 |
In order to break the well-known degeneracy that exists between age and extinction in fitting model spectral energy distributions to optical/NIR photometry, we use the MIPS 24m photometry to place constraints on the fraction of energy that is absorbed by dust and re-emitted at longer wavelengths. This results in upper limits on the amount of extinction applied to the model SED.
For each host we then have HST ACS BViz, Spitzer IRAC ch111with the exception of SNe HST04Pat, which was off the edge of the complete Spitzer survey, and 2002ki which had an uncertain IRAC counterpart due to confusion and MIPS 24m1 data as well as ground based222Ground-based data is from ISAAC/Very Large Telescope, Keck Telescope (spectroscopy), MOSAIC/Kitt Peak National Observatory, WIRCAM on the Canada-France Hawaii Telescope and the MOSAIC/Cerro Tololo Inter-American Observatory. The full list of data sets can be found at http://www.stsci.edu/science/goods/ UJHK. We also have some HST NICMOS JH coverage from Buitrago et al. (2008). We reject photometry with statistical errors larger than 0.3 mag which are indicative of marginal detections. We then add a systematic error in quadrature to the photometric errors given in the catalogue of for HST ACS and NICMOS (Pavlovsky et al., 2004; Thatte et al., 2009), for IRAC ch and ground-based photometry and for IRAC ch4 (Reach et al., 2005). We remove the southern U band data from the analysis due to inhomogeneous variations across the field.
The process of mosaicing the ACS data includes the flux from the SNe in the Riess et al. (2007) sample. We have estimated and subtracted out the SN contribution to the host galaxy photometry in the catalogue using the following process. We use the SN photometry given in Riess et al. (2004, 2007). In each band we add up the total SN flux and divide by the number of epochs of observations going into the ACS stack and subtract this from the host flux. This effect is present in the i and z bands, with a small contribution in the V-band (partly due to the SN colour and partly because the later Riess et al. (2007) SN search did not include V-band re-imaging of the GOODS fields). The B-band data was taken at an earlier time to the Viz data and is thus not affected. In several cases Riess et al. (2004) give i and z band SN photometry but not the V-band photometry. In these cases, we estimate the contribution to the band by extrapolating a simple power-law spectrum fit to the nearest two bands. In a very few cases, only band photometry is given; in these cases we fit the power-law to the observed colours of Type Ia SNe as presented in Jha et al. (2007) to measure the contribution of the SN in the band and the band. In all cases the correction to the host photometry in the V-band is small (there are only 3 cases where the correction is larger than 0.01Jy with the largest being 0.076Jy). In the i and z-bands the correction is small in most cases, the correction is larger than % of the host flux in only 4 and 5 cases respectively. In the cases of HST05Gab and 2002fw the SN contamination is very large, giving unreliable photometry in the i and z bands. Removing these bands leaves us with good photometry only in the BV, IRAC ch1 and ch2 in the case of HST05Gab and only BV and K in the case of 2002fw. Since we are unlikely to be able to constrain the host SED with only 3 or 4 bands we remove these SNe from the analysis. In the remaining cases a visual inspection further suggests that the contamination is small. Therefore, although the details of the stack process could affect the precise correction that is required, this effect is likely to be small.
The final photometry used, including the systematic errors added in quadrature is given in tables 2 (HST ACS, ground-based) and 3 (Spitzer IRAC and MIPS). The photometry used in the present work for the host galaxy of SN 1997ff differs from that given in Riess et al. (2001). In particular, Riess et al. (2001) give B-band photometry of mag, whereas we do not find an accurate detection for the host-galaxy in this band (the catalogue value is mag so it is removed from our analysis due to the large error). Further investigation revealed that the host is given in Williams et al. (1996) as B-band magnitude of 29.18 with a signal-to-noise of 3.5. A similar pattern is seen in the iz bands suggesting that perhaps there is a variable Active Galactic Nucleus (AGN) in this host, although further investigation beyond the scope of this work is required to confirm this.
| SN Name | U [mag] | B [mag] | V [mag] | i [mag] | z [mag] | J [mag] | H [mag] | K [mag] |
|---|---|---|---|---|---|---|---|---|
| 1997ff | - | - | 26.11 0.16 | 25.06 0.10 | 23.97 0.06 | 22.59 0.05* | 21.60 0.05* | - |
| 2003es | - | 25.86 0.17 | 24.12 0.06 | 22.54 0.05 | 21.65 0.05 | 21.11 0.05* | 20.44 0.05* | 19.66 0.11 |
| 2003az | - | 26.26 0.17 | 26.74 0.21 | 25.14 0.08 | 24.30 0.06 | - | - | - |
| 2003dy | 23.75 0.11 | 23.56 0.06 | 23.49 0.05 | 23.28 0.06 | 22.76 0.05 | - | - | 21.96 0.24 |
| 2002ki | 24.31 0.11 | 24.37 0.07 | 24.26 0.06 | 23.88 0.06 | 23.45 0.06 | - | - | 21.97 0.28 |
| HST04Pat | 22.49 0.10 | - | 21.58 0.06 | 20.80 0.05 | 20.39 0.05 | 20.24 0.14 | - | 19.94 0.14 |
| HST05Fer | 25.89 0.17 | 25.97 0.07 | 25.84 0.07 | 25.05 0.06 | 24.52 0.06 | - | - | - |
| HST05Koe | 26.33 0.23 | - | 25.02 0.12 | 24.09 0.09 | 23.45 0.07 | - | - | 21.80 0.28 |
| HST05Red | 24.76 0.11 | 24.62 0.06 | 24.61 0.06 | 24.34 0.06 | 24.14 0.06 | 23.87 0.05* | 23.72 0.05* | - |
| HST05Lan | - | 26.45 0.19 | 25.31 0.07 | 24.25 0.06 | 23.30 0.05 | 22.59 0.05* | 21.84 0.05* | - |
| HST04Tha | - | 26.99 0.22 | 25.24 0.06 | 23.94 0.05 | 23.04 0.05 | 22.60 0.05* | 21.99 0.05* | 21.48 0.14 |
| HST04Eag | 24.05 0.11 | 23.93 0.06 | 23.56 0.06 | 22.91 0.05 | 22.57 0.05 | 21.96 0.23 | - | 21.19 0.15 |
| HST05Gab | - | 26.78 0.19 | 26.76 0.14 | - | - | - | - | - |
| HST05Str | 24.77 0.11 | 24.33 0.07 | 24.04 0.06 | 23.50 0.06 | 23.12 0.06 | - | - | - |
| 1997fg | 24.31 0.11 | 23.99 0.06 | 23.56 0.06 | 22.90 0.06 | 22.59 0.05 | 22.12 0.25 | - | 21.90 0.23 |
| 2003aj | - | 25.09 0.07 | 24.99 0.06 | 24.85 0.07 | 24.23 0.06 | 23.96 0.15 | - | 23.67 0.17 |
| 2002fx | - | 25.59 0.08 | 25.90 0.09 | 25.62 0.10 | 25.50 0.09 | 25.28 0.22 | 25.28 0.29 | 24.92 0.28 |
| 2003ak | - | 23.66 0.06 | 23.57 0.06 | 23.39 0.06 | 23.14 0.06 | 22.57 0.11 | - | 22.45 0.12 |
| 2002hp | - | - | 25.86 0.11 | 24.04 0.06 | 23.15 0.06 | 21.80 0.11 | 21.25 0.11 | 20.71 0.10 |
| HST04Mcg | - | 25.09 0.11 | 24.54 0.08 | 23.74 0.07 | 23.06 0.06 | 22.16 0.11 | 21.63 0.11 | 21.21 0.11 |
| HST04Omb | - | 23.17 0.05 | 23.16 0.05 | 22.86 0.05 | 22.69 0.05 | 22.56 0.11 | 22.85 0.12 | 22.49 0.12 |
| SN Name | 3.6 [Jy] | 4.5m [Jy] | 5.8m [Jy] | 8.0m [Jy] | 24.0m [Jy] |
|---|---|---|---|---|---|
| 1997ff | 30.1 3.0 | 33.3 3.3 | 29.4 3.0 | 20.0 3.0 | 27.5 4.8 |
| 2003es | 56.6 5.7 | 39.3 3.9 | 29.6 3.0 | 20.4 3.1 | |
| 2003az | 20.1 2.0 | 20.3 2.0 | 15.4 1.6 | 10.4 1.6 | |
| 2003dy | 7.6 0.8 | 6.7 0.7 | 5.0 0.6 | 4.4 0.7 | |
| 2002ki | 0.5 | 0.5 | 1.5 | 1.5 | |
| HST04Pat | - | - | 1.5 | - | |
| HST05Fer | 2.1 0.2 | 1.3 0.1 | 1.3 0.4 | - | |
| HST05Koe | 16.3 1.6 | 13.2 1.3 | 11.7 1.3 | 8.2 1.4 | 63.1 6.6 |
| HST05Red | 2.5 0.2 | 1.9 0.2 | - | 1.2 0.4 | |
| HST05Lan | 21.9 2.2 | 18.6 1.9 | 12.2 1.3 | 8.8 1.4 | |
| HST04Tha | 13.4 1.3 | 9.0 0.9 | 6.4 0.7 | 3.4 0.6 | |
| HST04Eag | 10.3 1.0 | 7.6 0.8 | 5.8 0.7 | 5.7 0.9 | 50.9 5.1 |
| HST05Gab | 0.6 0.1 | 0.3 0.1 | 1.5 | 1.5 | |
| HST05Str | 5.4 0.5 | 3.8 0.4 | 2.8 0.5 | 2.3 0.6 | |
| 1997fg | 7.8 0.8 | 5.6 0.6 | 4.5 0.5 | 3.7 0.6 | |
| 2003aj | 1.6 0.2 | 1.3 0.1 | - | 1.5 | |
| 2002fx | 0.4 0.1 | 0.4 0.1 | 1.5 | - | |
| 2003ak | 5.0 0.5 | 5.1 0.5 | 3.3 0.5 | 2.2 0.6 | |
| 2002hp | 35.4 3.5 | 31.9 3.2 | 22.2 2.2 | 15.4 2.3 | |
| HST04Mcg | 20.8 2.1 | 20.1 2.0 | 14.7 1.5 | 13.1 2.0 | 59.5 6.0 |
| HST04Omb | 4.3 0.4 | 3.0 0.3 | 1.8 0.4 | - |
3 Model Fitting
We use the population synthesis models of Charlot and Bruzual (CB07, priv. com.) which are generated from an updated version of the Bruzual & Charlot (2003) GALAXEV code to produce models which include a new prescription for Thermally Pulsating AGB stars. The code calculates the spectral evolution of a stellar population based on a library of observed stellar spectra (see Bruzual & Charlot (2003) and references therein). We generated a suite of models with varying metallicity, Initial Mass Function (IMF; i.e. the distribution of stellar masses for the starburst), stellar population age and star formation history (SFH, either a constant SFR or an exponentially declining SFR with e-folding time ). For each model we apply a dust extinction correction of varying with a Calzetti et al. (2000) dust extinction law, giving a total of models. Table 4 shows the parameter values used to generate the models. Finally, we ensure that the age of the stellar population never exceeds the age of the Universe at the redshift of the SN Ia.
| Parameter | Allowed Values |
|---|---|
| Metallicity | 0.005, 0.020, 0.200, 0.400, 1.000, 2.500 Z⊙ |
| Salpeter: | |
| IMF | |
| Chabrier: | |
| SFH | 0.01, 0.03, 0.1, 0.3 1 Gyrs and i.e. constant SFR |
| Stellar population age | unevenly spaced in the range 0.001 - 6 Gyrs |
| Dust, | 0 - 5 mag, step size of 0.1 mag, starburst extinction law (Calzetti et al., 2000) |
Each model is then converted to the observed frame using the spectroscopic redshift of the SN Ia and convolved with the response/filter functions of the instruments in order to generate the equivalent observed photometry for each model in each band. We then calculate the of each model compared to the data, according to the equation
where is the observed flux in each band, is the model flux in each band, is the observed error (including the additional systematic error), is a normalization factor (calculated as the mean ratio of the observed flux to the model flux, weighted by the errors) and the summation is over all bands. We then find the model with the minimum for each host galaxy.
In order to break the degeneracy between young models with large extinction and old models with low extinction we use the 24m photometry since it is a reliable proxy for the fraction of light that is absorbed by dust and reprocessed at longer wavelengths. By using the Chary & Elbaz (2001) templates, the 24m photometry can be translated to a total far-infrared (FIR) luminosity. This provides an upper limit to the fraction of optical/near-infrared light that is absorbed by dust. We then compare this to the FIR luminosity of each model, calculated thus
where is the flux of the model at each wavelength and is the extinction correction given by the extinction law of Calzetti et al. (2000). Any models which have an FIR luminosity that is in excess of the FIR luminosity calculated from the 24m photometry/limits are rejected. We use upper limits to reject any models that exceed the photometric limits. The limits we use are 28.6, 28.6, 27.9, 27.4 AB mag for the ACS BViz bands (5 limits), 0.5, 0.5, 1.5, 1.5Jy for the IRAC ch1-4 and 25Jy for the MIPS 24m data (80% completeness limits).
Each SED in the CB07 models is the combination of the SEDs from all the various stars that have formed (and evolved) over the lifetime of the model galaxy. All but one of our star-formation histories is exponential, in these cases most of the stars are formed at the redshift of formation. The final time-step from the models is the upper limit to the age of a star in the population. While most of the stars in the population are old, most of the luminosity comes from younger stars. In order to account for this we calculate a mean age weighted by the fractional contribution to the -band luminosity from the stars of each age.
4 Results
4.1 Delay Time Distribution
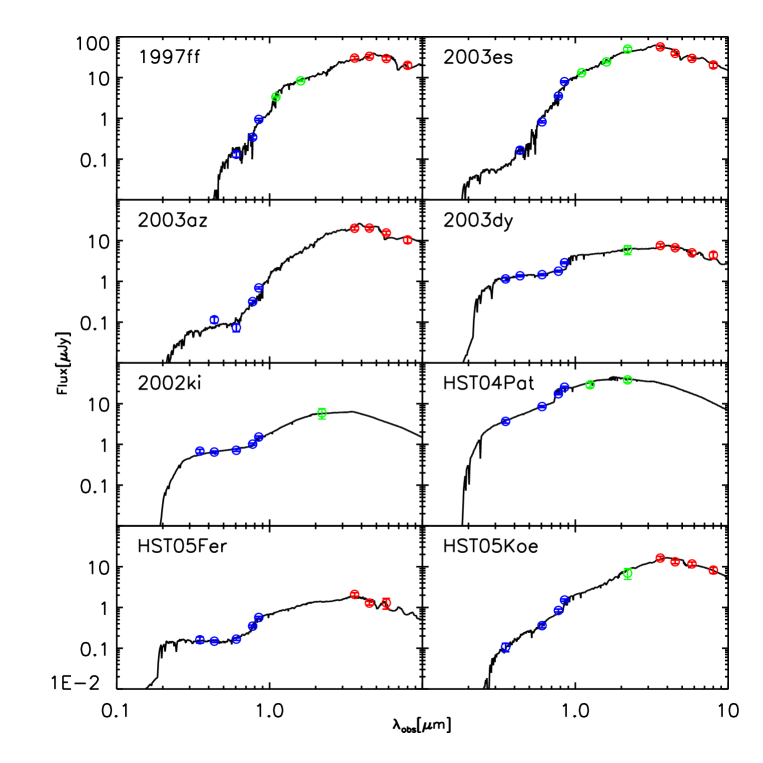
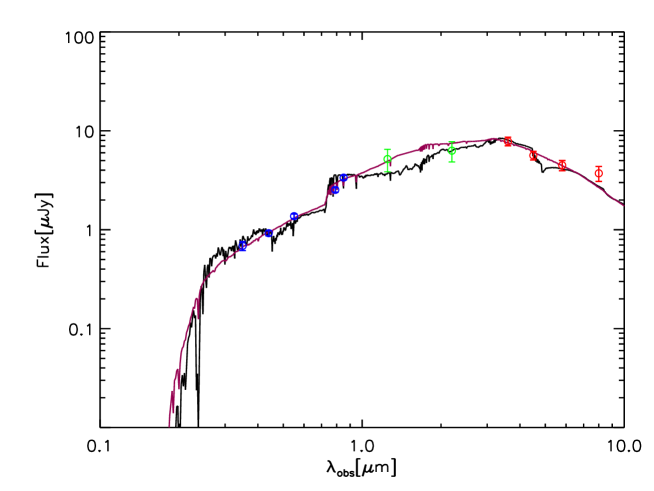
We have found the best-fit stellar population model for each host using a minimum technique. The set of best fitting parameters for each host along with the of the fit is shown in Table 5. Since we have calculated the for each model, we calculate the errors by finding those bins with , where is the minimum of the fit and is the value for a 68% and 95% confidence level for a normal distribution with the same number of degrees of freedom as used in the fit (given by the number of photometric points less the number of parameters). The best-fitting SEDs along with the observed photometry used in the fit are shown in figure 2. It is also worth noting the effect of using the 24 m limit at this stage. Figure 3 is an enlarged version of the SED plot for 1997fg but also shown is the best-fitting SED found if the FIR luminosity limit is not used. The figure shows that both SEDs are reasonable fits to the data (with of 11.1 when the limit is included and 3.6 when it is not), however by including the limit, the best-fit luminosity-weighted age changes from Gyrs to Gyrs.
| SN Ia | Age [Gyrs] | Age [Gyrs] | [mags] | Z[Z⊙] | [Gyrs] | IMF | [log10(M⊙)] | |
|---|---|---|---|---|---|---|---|---|
| 1997ff | 0.571 | 0.561 | 0.5 | 2.500-1.500 | 0.01+0.09 | salpeter | 3.05 | 11.06 |
| 2003es | 2.300 | 1.999 | 0.3 | 1.000 | 0.30-0.29 | chabrier | 1.95 | 10.80 |
| 2003az | 4.750-3.316 | 3.897 | 0.7 | 2.500-2.100 | 1.00-0.70 | salpeter | 4.71 | 11.12 |
| 2003dy | 0.286 | 0.180 | 0.4 | 0.400 | 0.10-0.09 | chabrier | 0.65 | 9.84 |
| 2002ki | 0.005 | 0.002 | 1.6 | 0.005+2.495 | 0.01 | chabrier | 3.40 | 8.93 |
| HST04Pat | 0.064 | 0.054 | 1.8 | 0.005+2.495 | 0.01 | chabrier | 5.22 | 10.79 |
| HST05Fer | 2.500 | 1.708 | 0.0+0.7 | 0.400 | 1.00-0.90 | chabrier | 1.83 | 9.23 |
| HST05Koe | 0.072 | 0.062 | 1.8 | 2.500-1.500 | 0.01+0.02 | salpeter | 2.02 | 10.23 |
| HST05Red | 0.055 | 0.031 | 0.8 | 1.000 | 0.03-0.02 | chabrier | 2.55 | 8.84 |
| HST05Lan | 1.700 | 1.400 | 0.3 | 1.000 | 0.30-0.29 | salpeter | 1.66 | 10.66 |
| HST04Tha | 2.200 | 1.899 | 0.0+0.5 | 1.000 | 0.30 | chabrier | 2.02 | 10.07 |
| HST04Eag | 5.500-5.436 | 2.192 | 0.6 | 0.005+2.495 | Constant SFR | salpeter | 2.49 | 10.48 |
| HST05Str | 0.072 | 0.062 | 0.6 | 2.500-1.500 | 0.01+0.02 | chabrier | 1.53 | 9.25 |
| 1997fg | 0.102 | 0.092 | 0.4 | 2.500-2.495 | 0.01+0.99 | chabrier | 1.86 | 9.43 |
| 2003aj | 0.161 | 0.124 | 0.1 | 1.000 | 0.03-0.02 | salpeter | 0.77 | 9.25 |
| 2002fx | 2.750 | 1.225 | 0.0+1.2 | 0.005+2.495 | Constant SFR | chabrier | 1.63 | 8.94 |
| 2003ak | 0.128 | 0.118 | 0.0+0.6 | 1.000 | 0.01+0.09 | chabrier | 0.53 | 9.70 |
| 2002hp | 1.700 | 1.587 | 0.3 | 1.000 | 0.10 | salpeter | 0.45 | 11.00 |
| HST04Mcg | 0.128 | 0.118 | 1.5 | 1.000 | 0.01+0.99 | salpeter | 0.56 | 10.61 |
| HST04Omb | 0.203 | 0.108 | 0.0+0.2 | 1.000 | 0.10-0.09 | chabrier | 1.27 | 9.14 |
![[Uncaptioned image]](/html/1010.3315/assets/x4.png)
figure 2 continued
![[Uncaptioned image]](/html/1010.3315/assets/x5.png)
figure 2 continued
Since we are only fitting one population to the photometry of the host galaxies it is possible that the SN Ia progenitors were born in a more recent starburst which only contributes a fraction to the total emission of the galaxy which is dominated by an older population. In this case we would overestimate the ages as we would fit to the dominant, older population but the SN Ia in fact comes from a younger population. In order to test this possibility we perform a two-component fit. We use the best-fitting parameters for metallicity, SFH and IMF and take a model which is as old as the universe at the host redshift and a model which is 10 Myrs old. We then add the two models together allowing the fractional contribution from the young population to vary between 0 - 1 in steps of 0.1. We also allow the extinction to vary and to be different in the two populations. In all cases the resulting fit is worse than the original best-fit using only one population. This suggests that our assumption that the SNe Ia most likely come from the one population model we are fitting is valid.
We also assessed the Charlot & Fall (2000) prescription for the dust extinction. We find that the ages using the Charlot & Fall (2000) recipe differ from those using the Calzetti et al. (2000) recipe by more than a factor of 2, in only 3 cases. In two of these cases these ages are larger than those using the Calzetti et al. (2000) recipe, however, in all 3 cases the of the best-fit is lower using a Calzetti et al. (2000) recipe compared to the Charlot & Fall (2000) recipe. We conclude that our derived ages are robust with respect to the fitting technique.
Figure 4 shows contour plots of the distribution in the age - plane for the SNe host galaxies, showing 68% and 95% confidence intervals. The figure shows that in some cases there is a fairly smooth distribution of the degeneracy between the age of the stellar population and the dust extinction, in that good fits can be achieved with younger populations with a higher dust extinction, as expected. This degeneracy remains despite our removing any models which give a FIR luminosity that is inconsistent with the MIPS 24m data, although it is much reduced. Many panels of figure 4, however, do not show a smooth distribution. While they generally show the same degeneracy, it is clear that the age parameter is not sampled sufficiently, in particular at older ages to give a smooth distribution. Unfortunately, we are unable to alter the ages of the output of the stellar population models. However, the uncertainties in table 5 and figures 6, 10 span the entire range of ages that give consistent fits.
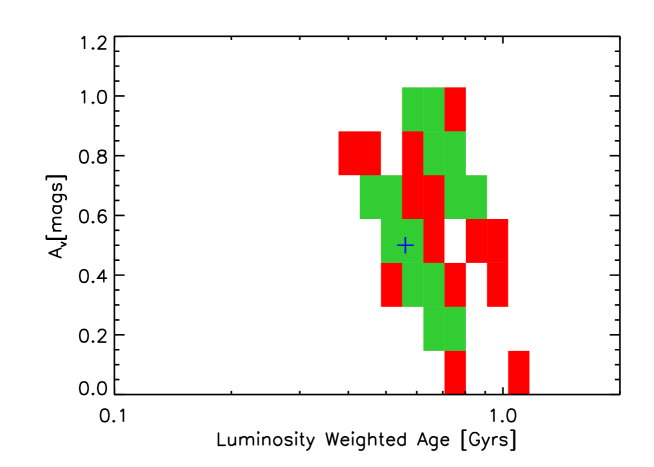
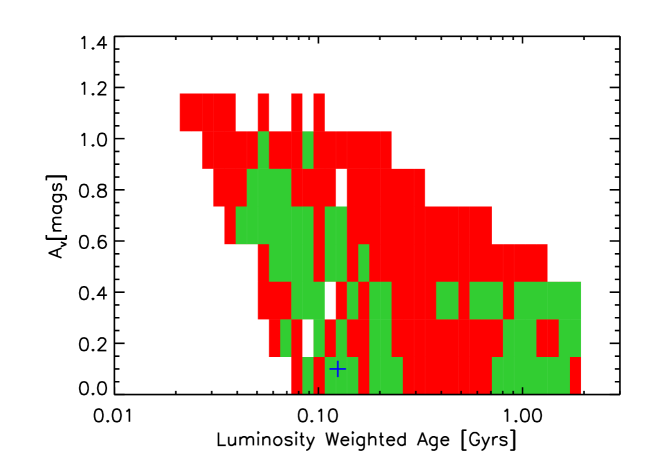
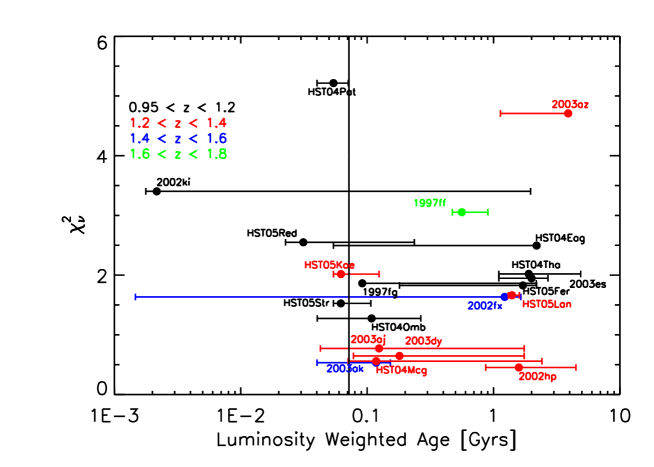
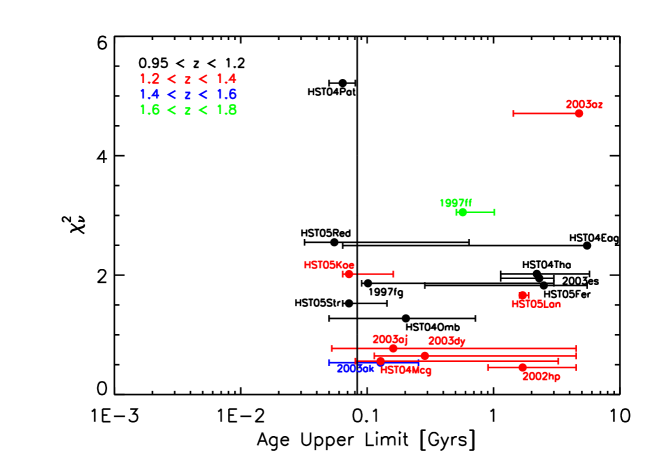
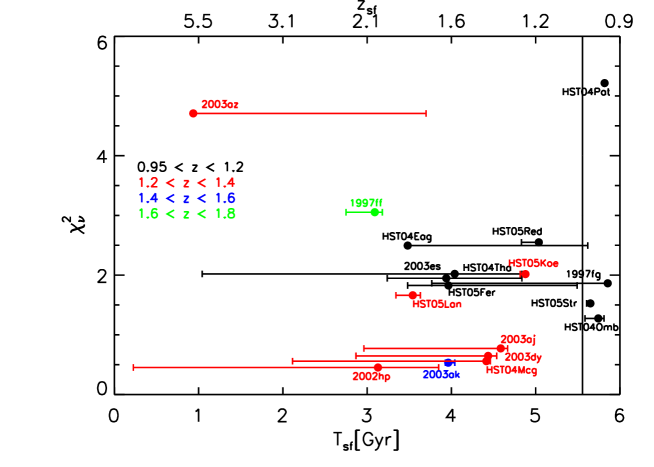
Figure 5 shows the luminosity weighted stellar population ages of the host galaxies. This age is plotted for each SN Ia host with the reduced (, where is the number of degrees of freedom) of the best-fit model. The error bars are calculated from the grid of , whereby we find the age at which the rises above the 68% confidence level, collapsing over all other parameters. The plot shows that there are two hosts with exceptionally large error bars, namely the host galaxies of 2002fx and 2002ki. In the latter case this is most likely due to the lack of IRAC photometry, in the former case this is most likely due to large photometric uncertainties. In any case we remove these hosts from the analysis (including the calculations based on this plot). The plot shows a large range of luminosity weighted ages from 0.03 - 3.90 Gyrs, with both prompt and delayed SNe Ia. As we wish to constrain the maximum delay time, we show the plot again but when the upper-age limit (i.e. the best fitting time-step of the CB07 models) rather than the luminosity-weighted mean age is used in figure 6. Both plots show that the weighted mean age of the SNe hosts is Gyr implying that they harbor young stellar populations. This fact was noted earlier by Chary et al. (2005) who found that 60% of the SN Ia host galaxies harbor young, dusty starbursts based on their detection at 24 m; this is a factor of 1.5 higher than the field galaxy population.
The distribution of the best-fit luminosity-weighted stellar population ages are shown in figure 7. We show the histogram when only high confidence SNe Ia are included, these are SNe which are classed as ‘Gold’ in Riess et al. (2007) and also have good spectra of the SNe (red-dashed line). The black solid line represents all SNe and includes ‘Silver’ SNe and ‘Gold’ SNe without spectra. ‘Bronze’ SNe are not included in any of this analysis. The figure suggests a bi-modal distribution with median ages of 0.11 and 1.9 Gyrs for the two populations (both the whole sample and when only considering the high-confidence SNe Ia). We arbitrarily consider a host age Gyrs to be young, as this is the minimum in the distribution and since there is no precise definition in the literature. We perform a KS-test to determine whether a bi-modal distribution is a good description of the data. Comparing to a distribution comprised of two gaussian distributions centered at the young and old median ages (allowing the standard deviation of each gaussian and the ratio between their amplitudes to vary) gives a KS-statistic of 0.99 for the high confidence SNe Ia and 0.97 for the whole sample. The KS statistic for the distribution to be fit by a single Gaussian has a probability of only 42%. Thus, a bimodal distribution is clearly favored by the age distribution although a larger sample of objects such as those available from the upcoming CANDELS/WFC3 survey is required for definitive confirmation of a bimodal distribution of ages.
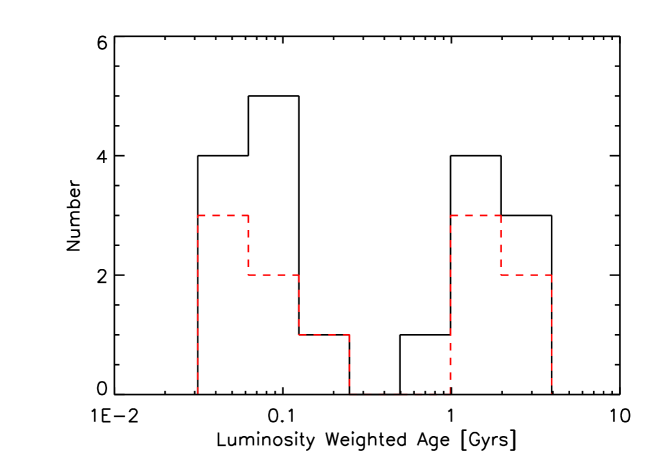
Due to the large error bars for the ages of the stellar populations we perform a monte carlo simulation to test the strength of any bi-modality. For each simulation, we calculate an age for each SN from the probability distribution calculated from the distribution of the error bars shown in figure 5. We then repeat the KS-test. We perform this simulation 1000 times. We find that a bi-modal distribution is preferred 95% and 97% of the time for the whole sample and for the high confidence sample respectively. Finally, we use the simulation to test the existence of prompt SNe given the large error bars of figure 5. The mean number of young hosts in the simulation is and of old hosts is for the full sample. When considering only the high confidence SNe Ia the average number of young and old hosts is and . These results suggest that we can be fairly confident of the existence of prompt Type Ia SNe at .
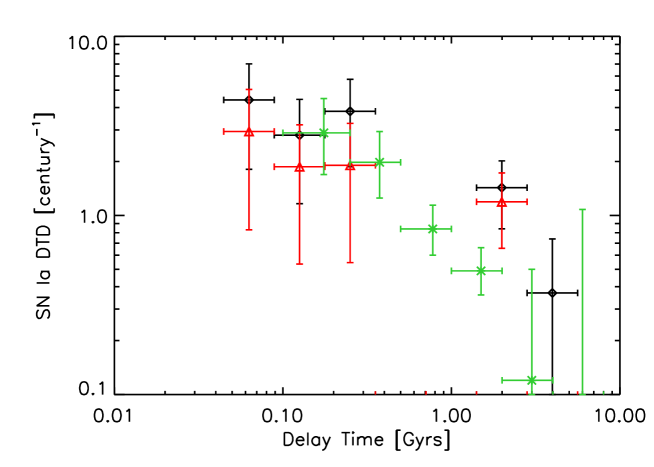
Finally, we wish to calculate the delay time distribution (DTD). In order to do this we must account for the selection efficiency of the supernova search. Typically, this is achieved in the form of a ‘control time’ calculation (which is the total time that a SN could have been detected). We use the control time calculation for this SNe search of Dahlen et al. (2008) as an estimate of the probability of detecting a supernova as a function of redshift. Dahlen et al. (2008) give supernova rates and the number of supernovae in four redshift bins between 0.2 and 1.8. We use the three highest redshift bins to interpolate the control time at each of the redshifts of our SNe using the equation
where is the SNe Ia rate, is the number of SNe observed in a redshift bin, is the control time and is the volume of the redshift bin (Strolger et al., 2010). We then divide the best-fit luminosity-weighted stellar population ages by this control time. In order to calculate the DTD we then calculate a histogram of this distribution and divide the histogram by the equivalent distribution of a sample of the field population in the GOODS survey with spectroscopic redshifts and . The field sample we use consists of 1507 galaxies across the GOODS-N and GOODS-S fields. Figure 8 shows a histogram of these ages and figure 9 shows the resulting DTD. We again perform a monte carlo simulation of the DTD. We find that a bi-modal distribution is preferred 80% of the time for the whole sample and 74% of the time when considering only the high confidence SNe Ia . For the whole sample an exponential distribution is preferred 11% of the time and a single gaussian distribution 8.7%. For the high-confidence sample a single gaussian is prefered in 14% of the simulations and an exponential distribution 7% of the time. In figure 9 we also plot the DTD obtained by Totani et al. (2008). For most bins the two measurements are consistent, however, between 0.4 and 2 Gyrs the Totani et al. (2008) result has a larger SNe rate than that found here and their results do not appear to be bi-modal. The Totani et al. (2008) result was obtained over a lower redshift window, extending between and it is possible the difference reflects a change in the dominant SNe Ia progenitor.

4.2 Evidence Against Truncation of the High Redshift Stellar IMF
Since SNe Ia are believed to be the explosions of White Dwarfs (WD) which have reached the Chandrasekhar mass, the stars eventually giving rise to these explosions are low mass stars. A star of 8 will explode as a core-collapse supernova instead of forming a WD (Blanc & Greggio, 2008). Therefore, with the ages of the underlying stellar populations which produce the SNe Ia we can constrain the first epoch of low mass star formation,
where is the age of the universe at the redshift of the host galaxy and is the best-fit luminosity-weighted stellar population age. is the time since the Big Bang when the stellar population formed. The results are shown in figure 10 where the error bars are calculated as above. The figure suggests that stars formed within 3 Gyrs of the Big Bang and possibly by . If these results are confirmed they are in contrast to the proposal by Tumlinson et al. (2004) who suggest that instead of requiring the first stars to be very massive stars () the primordial IMF may be truncated at M⊙ at . This suggestion was primarily based on the Fe-peak and process elemental abundance patterns of extremely metal poor stars in the Galactic halo.
Interestingly, we do not see any trend of peak absolute magnitude with host age; based on the previous work we would expect younger galaxies to host fainter SNe Ia . However, as pointed out by Sullivan et al. (2010) the sample used here is perhaps too small to see the slight trend found by those authors. Furthermore, Neill et al. (2009), found that for a sample of local SNe Ia that there was no trend with light-curve corrected peak -band absolute magnitude and host luminosity weighted age except when a subset of hosts with low dust extinction was considered.
5 Discussion
We have utilised the multi-wavelength spectral energy distribution of the host galaxies of Type Ia SNe at to identify a possible bi-modal distribution of luminosity-weighted stellar ages and thereby delay times between the burst of star-formation and the time at which the SN explodes. We find evidence for both prompt (i.e. short delay times, Gyrs) and delayed (i.e. long delay times) SNe Ia, with some extremely young (Gyrs) luminosity weighted ages. We discuss our results in the context of past measurements at low and high redshift.
5.1 Low Redshift
In the low redshift universe there is evidence for both prompt and delayed SNe Ia. Aubourg et al. (2008) find significant evidence for a population of SNe Ia with progenitor lifetimes of 0.18 Gyrs. Mannucci et al. (2005) find that SNe Ia are more common in blue rather than red galaxies and Della Valle et al. (2005) find that the SN Ia rate is 4 times higher in radio-loud rather than radio-quiet galaxies, suggesting that SNe Ia are associated with younger stellar populations and therefore shorter delay times. Schawinski (2009) fit SDSS and GALEX photometry of the host galaxies of 21 local SNe Ia in early type galaxies to a two-component Stellar Population model, with an old component (of age varying 1 - 15 Gyrs) to represent the older, underlying population and a young starburst component with varying age and mass fraction. They find no SNe Ia with delay times Gyrs, and a range of minimum delay times of 0.275 - 1.25 Gyrs. This is perhaps to be expected as only SNe Ia in early type galaxies are studied. Furthermore, measurements of the SN Ia rate at different redshifts have suggested that the delayed SNe Ia give a more significant contribution to the total rate at low redshift (Sullivan et al., 2006; Neill et al., 2006, 2007).
Gallagher et al. (2005) perform a spectroscopic study of the host galaxies of 57 local SNe Ia to deduce the SFR and SFH of the host galaxy. By measuring the Scalo-b parameter they see evidence for a bi-modal distribution which further suggests two progenitor classes for the SNe. However they put a lower limit on the delay time of 2 Gyrs. It is hard to see how to reconcile these two results, although again these are local galaxies when we would expect more delayed SNe than prompt SNe.
Neill et al. (2009) perform an SED fitting analysis of UV and optical photometry of the host galaxies of a sample of local SNe Ia. They confirm the results of Sullivan et al. (2006) who showed that brighter SNe occur in galaxies with higher specific SFR. Gallagher et al. (2008) obtained optical spectra for the host galaxies of 29 SNe Ia selected to be local early type galaxies. From comparisons to stellar population synthesis models they find a correlation between age or metallicity with peak SN Ia band absolute magnitude, preferring a trend with age (based on the trend of SN Ia rate with specific SFR) such that SNe Ia from older populations are fainter. Howell et al. (2009) find a very weak correlation between luminosity-weighted age of the host and 56Ni mass derived from the integrated luminosity of the SN also suggesting that older, low mass progenitors produce fainter SNe Ia.
5.2 High Redshift
Many authors have attempted to constrain the delay time distribution (DTD) of SNe Ia by comparing the observed SN Ia rate to that predicted by a convolution of the DTD with an assumed SFH, (Gal-Yam & Maoz, 2004; Strolger et al., 2004; Dahlen et al., 2004; Barris & Tonry, 2006; Dahlen et al., 2008; Strolger et al., 2010). These studies have argued for a range of characteristic delay times, spanning 1 - 4 Gyrs.
This seems at odds with our results which show a large proportion of SNe Ia with delay times Gyrs. Indeed, the Strolger et al. (2004, 2010) result, finding a characteristic delay time of Gyrs, is based on an analysis of the same set of SNe used in the present work. Dahlen et al. (2004, 2008) use the models of Strolger et al. (2004) with a measurement of the GOODS SN Ia rate to show that the best fit DTD is a Gaussian with a mean delay time of 3.4 Gyrs. However, Förster et al. (2006); Blanc & Greggio (2008) have shown that the results of such analyses are strongly dependent on the assumed SFH, introducing systematic errors, and as such our results are not necessarily at odds with those authors. Results from Oda et al. (2008) which attempt to fit both the SFH and DTD simultaneously are only able to put weak constraints on the DTD. Furthermore, Poznanski et al. (2007) measure the SN Ia rate at a similar redshift range using a dataset from the Subaru Deep Field and find a more constant rate which could suggest shorter delay times. In a companion paper to Gal-Yam & Maoz (2004), Maoz & Gal-Yam (2004) show that iron abundances in clusters require delay times of Gyrs.
These seemingly contradictory results, with evidence for both prompt and delayed SNe Ia at high and low redshift have led to the suggestion of a two-component DTD (Mannucci et al., 2005). For example, Mannucci et al. (2006) use several datasets to show that the observations cannot be simultaneously matched by a single delay-time. Several authors have developed this further suggesting a model with a prompt component dependent on the specific SFR (SFR per unit stellar mass) of the host galaxy and a delayed component dependent on the stellar mass of the host galaxy (Scannapieco & Bildsten, 2005; Sullivan et al., 2006; Neill et al., 2006, 2007; Aubourg et al., 2008). These DTDs are then matched to the observed SN Ia rate to fit the model parameters, tending to find a best-fit DTD dominated by the prompt component, especially at high-redshift. Furthermore, in many of these models the contribution of the prompt component is expected to increase with redshift (Sullivan et al., 2006). The average SNe Ia light curve width appears to increase with redshift, supporting these models (prompt SNe Ia are more luminous and have a broader light curve Howell et al., 2007; Sullivan et al., 2009). However, some studies have shown that SN Ia rate measurements are unable to differentiate between DTD models to any significance (Neill et al., 2006, 2007; Blanc & Greggio, 2008; Botticella et al., 2008; Oda et al., 2008) and that these results are still highly dependent on the choice of SFH. Kuznetsova et al. (2008) re-computed the results of Dahlen et al. (2004) using a more sophisticated technique and additional data to find that they could not discriminate between a two-component model and a gaussian single delay time DTD.
Totani et al. (2008) perform an analysis similar to that presented here using SN Ia host galaxies in the Subaru/XMM-Newton Deep Survey (SXDS) in the redshift range . They find a DTD in the range Gyrs (extending to 10 Gyrs from the SN Ia rate in local ellipticals). This analysis selects old, passively evolving galaxies and therefore does not probe the shortest delay times. However, they do not find a bi-modal distribution as we find here.
There are a number of implications of this result for cosmological studies. That there is a large population of SNe Ia which have short delay times means that these objects could be used as cosmological probes to very high redshift (). Furthermore, if prompt and delayed SNe Ia have different light-curve shape/luminosity relations the host galaxy will need to be taken into account when using SNe Ia to determine the equation of state parameter of dark energy, , especially when considering possible evolution of this parameter. Using a large dataset of SNe Ia spanning a wide redshift range Sullivan et al. (2010) showed that SNe Ia light-curve widths depend on host galaxy specific star formation rate (SSFR) and stellar mass, with narrow light curve SNe Ia found preferentially in lower SSFR and/or more massive host galaxies. Such effects must be accounted for when using SNe Ia as cosmological probes; for example, Sullivan et al. (2010) suggests the inclusion of an additional parameter in cosmological analyses to remove the host dependence.
5.3 IMF Evolution
By comparing the ages of the stellar population in the host galaxies with the age of the Universe at the redshift of the SNe, we can identify the first epoch at which star-formation occurred in the host galaxies. This provides an upper limit to the formation of stars which might be the progenitors of the Type Ia SNe. Since it is generally thought that M☉ stars are the progenitors of Type Ia SNe we have used the host galaxy SED analysis to show that these low mass stars were in place 3 Gyrs after the Big Bang and possibly as early as albeit with significant uncertainties that are related to the uncertainties associated with measuring stellar population ages (Figure 10). Tumlinson et al. (2004) argue that the nucleosynthesis yields as estimated from the metal abundances in halo stars and the electron scattering optical depths from the cosmic microwave background are well matched by requiring an IMF at which is truncated at M⊙ rather than the requirement that the first stars are very massive (). However, if our results are confirmed and low mass stars are found at redshifts as high as 5, this would rule out such a truncated IMF.
6 Conclusion
We have studied the host galaxies of a sample of 22 Type Ia Supernovae (SNe Ia) at from Gilliland et al. (1999); Blakeslee et al. (2003); Strolger et al. (2004); Riess et al. (2004, 2007). We use the broadband photometry from HST ACS BViz, Spitzer IRAC as well as UJHK ground-based and some HST NICMOS JH data from the GOODS survey. We fit the photometry to the single stellar population models of Charlot & Bruzual (priv. com.) which are generated from the latest version of the GALAXEV code (Bruzual & Charlot, 2003). We use Spitzer MIPS 24m data to place upper limits on the far-infrared luminosity of the hosts to break the well-known age-extinction degeneracy associated with SED fitting. We find the best-fit model for each host using a minimum technique to estimate the age of the stellar population of the SN Ia progenitors and hence place upper limits on the possible SN Ia delay times. We find evidence for both prompt and delayed SNe Ia. When the distribution of stellar ages in field galaxies is factored in as a control sample, we find that the prompt SNe are dominant over the delayed SNe and that the SN Ia delay times possibly have a bi-modal distribution with a paucity of SNe with delay times of 0.8 Gyr. As a consequence of the stellar population ages, we also show that the M⊙ SN Ia progenitor stars are in place by and possibly by (although with significant uncertainty) arguing against a truncated IMF in the first Gyr after the Big Bang.
References
- Aubourg et al. (2008) Aubourg, É., Tojeiro, R., Jimenez, R., Heavens, A., Strauss, M. A., & Spergel, D. N. 2008, A&A, 492, 631
- Barris & Tonry (2006) Barris, B. J. & Tonry, J. L. 2006, ApJ, 637, 427
- Blakeslee et al. (2003) Blakeslee, J. P., Tsvetanov, Z. I., Riess, A. G., Ford, H. C., Illingworth, G. D., Magee, D., Tonry, J. L., Benítez, N., Clampin, M., Hartig, G. F., Meurer, G. R., Sirianni, M., Ardila, D. R., Bartko, F., Bouwens, R., Broadhurst, T., Cross, N., Feldman, P. D., Franx, M., Golimowski, D. A., Gronwall, C., Kimble, R., Krist, J., Martel, A. R., Menanteau, F., Miley, G., Postman, M., Rosati, P., Sparks, W., Strolger, L., Tran, H. D., White, R. L., & Zheng, W. 2003, ApJ, 589, 693
- Blanc & Greggio (2008) Blanc, G. & Greggio, L. 2008, New Astronomy, 13, 606
- Botticella et al. (2008) Botticella, M. T., Riello, M., Cappellaro, E., Benetti, S., Altavilla, G., Pastorello, A., Turatto, M., Greggio, L., Patat, F., Valenti, S., Zampieri, L., Harutyunyan, A., Pignata, G., & Taubenberger, S. 2008, A&A, 479, 49
- Brandt et al. (2010) Brandt, T. D., Tojeiro, R., Aubourg, É., Heavens, A., Jimenez, R., & Strauss, M. A. 2010, ArXiv e-prints
- Bruzual & Charlot (2003) Bruzual, G. & Charlot, S. 2003, MNRAS, 344, 1000
- Buitrago et al. (2008) Buitrago, F., Trujillo, I., Conselice, C. J., Bouwens, R. J., Dickinson, M., & Yan, H. 2008, ApJ, 687, L61
- Calzetti et al. (2000) Calzetti, D., Armus, L., Bohlin, R. C., Kinney, A. L., Koornneef, J., & Storchi-Bergmann, T. 2000, ApJ, 533, 682
- Chandrasekhar (1931) Chandrasekhar, S. 1931, ApJ, 74, 81
- Charlot & Fall (2000) Charlot, S. & Fall, S. M. 2000, ApJ, 539, 718
- Chary et al. (2005) Chary, R., Dickinson, M. E., Teplitz, H. I., Pope, A., & Ravindranath, S. 2005, ApJ, 635, 1022
- Chary & Elbaz (2001) Chary, R. & Elbaz, D. 2001, ApJ, 556, 562
- Dahlen et al. (2008) Dahlen, T., Strolger, L., & Riess, A. G. 2008, ApJ, 681, 462
- Dahlen et al. (2004) Dahlen, T., Strolger, L., Riess, A. G., Mobasher, B., Chary, R., Conselice, C. J., Ferguson, H. C., Fruchter, A. S., Giavalisco, M., Livio, M., Madau, P., Panagia, N., & Tonry, J. L. 2004, ApJ, 613, 189
- Della Valle et al. (2005) Della Valle, M., Panagia, N., Padovani, P., Cappellaro, E., Mannucci, F., & Turatto, M. 2005, ApJ, 629, 750
- Dickinson et al. (2003) Dickinson, M., Giavalisco, M., & The Goods Team. 2003, in The Mass of Galaxies at Low and High Redshift, ed. R. Bender & A. Renzini, 324–+
- Förster et al. (2006) Förster, F., Wolf, C., Podsiadlowski, P., & Han, Z. 2006, MNRAS, 368, 1893
- Gal-Yam & Maoz (2004) Gal-Yam, A. & Maoz, D. 2004, MNRAS, 347, 942
- Gallagher et al. (2005) Gallagher, J. S., Garnavich, P. M., Berlind, P., Challis, P., Jha, S., & Kirshner, R. P. 2005, ApJ, 634, 210
- Gallagher et al. (2008) Gallagher, J. S., Garnavich, P. M., Caldwell, N., Kirshner, R. P., Jha, S. W., Li, W., Ganeshalingam, M., & Filippenko, A. V. 2008, ApJ, 685, 752
- Giavalisco et al. (2004) Giavalisco, M., Ferguson, H. C., Koekemoer, A. M., Dickinson, M., Alexander, D. M., Bauer, F. E., Bergeron, J., Biagetti, C., Brandt, W. N., Casertano, S., Cesarsky, C., Chatzichristou, E., Conselice, C., Cristiani, S., Da Costa, L., Dahlen, T., de Mello, D., Eisenhardt, P., Erben, T., Fall, S. M., Fassnacht, C., Fosbury, R., Fruchter, A., Gardner, J. P., Grogin, N., Hook, R. N., Hornschemeier, A. E., Idzi, R., Jogee, S., Kretchmer, C., Laidler, V., Lee, K. S., Livio, M., Lucas, R., Madau, P., Mobasher, B., Moustakas, L. A., Nonino, M., Padovani, P., Papovich, C., Park, Y., Ravindranath, S., Renzini, A., Richardson, M., Riess, A., Rosati, P., Schirmer, M., Schreier, E., Somerville, R. S., Spinrad, H., Stern, D., Stiavelli, M., Strolger, L., Urry, C. M., Vandame, B., Williams, R., & Wolf, C. 2004, ApJ, 600, L93
- Gilfanov & Bogdan (2010) Gilfanov, M. & Bogdan, A. 2010, ArXiv e-prints
- Gilliland et al. (1999) Gilliland, R. L., Nugent, P. E., & Phillips, M. M. 1999, ApJ, 521, 30
- Greggio (2005) Greggio, L. 2005, A&A, 441, 1055
- Greggio (2010) —. 2010, MNRAS, 406, 22
- Greggio & Cappellaro (2009) Greggio, L. & Cappellaro, E. 2009, in American Institute of Physics Conference Series, Vol. 1111, American Institute of Physics Conference Series, ed. G. Giobbi, A. Tornambe, G. Raimondo, M. Limongi, L. A. Antonelli, N. Menci, & E. Brocato, 477–484
- Howell (2001) Howell, D. A. 2001, ApJ, 554, L193
- Howell et al. (2009) Howell, D. A., Sullivan, M., Brown, E. F., Conley, A., Le Borgne, D., Hsiao, E. Y., Astier, P., Balam, D., Balland, C., Basa, S., Carlberg, R. G., Fouchez, D., Guy, J., Hardin, D., Hook, I. M., Pain, R., Perrett, K., Pritchet, C. J., Regnault, N., Baumont, S., LeDu, J., Lidman, C., Perlmutter, S., Suzuki, N., Walker, E. S., & Wheeler, J. C. 2009, ApJ, 691, 661
- Howell et al. (2007) Howell, D. A., Sullivan, M., Conley, A., & Carlberg, R. 2007, ApJ, 667, L37
- Jha et al. (2007) Jha, S., Riess, A. G., & Kirshner, R. P. 2007, ApJ, 659, 122
- Kuznetsova et al. (2008) Kuznetsova, N., Barbary, K., Connolly, B., Kim, A. G., Pain, R., Roe, N. A., Aldering, G., Amanullah, R., Dawson, K., Doi, M., Fadeyev, V., Fruchter, A. S., Gibbons, R., Goldhaber, G., Goobar, A., Gude, A., Knop, R. A., Kowalski, M., Lidman, C., Morokuma, T., Meyers, J., Perlmutter, S., Rubin, D., Schlegel, D. J., Spadafora, A. L., Stanishev, V., Strovink, M., Suzuki, N., Wang, L., & Yasuda, N. 2008, ApJ, 673, 981
- Livio (2001) Livio, M. 2001, in Supernovae and Gamma-Ray Bursts: the Greatest Explosions since the Big Bang, ed. M. Livio, N. Panagia, & K. Sahu, 334–355
- Mannucci et al. (2006) Mannucci, F., Della Valle, M., & Panagia, N. 2006, MNRAS, 370, 773
- Mannucci et al. (2005) Mannucci, F., Della Valle, M., Panagia, N., Cappellaro, E., Cresci, G., Maiolino, R., Petrosian, A., & Turatto, M. 2005, A&A, 433, 807
- Maoz & Gal-Yam (2004) Maoz, D. & Gal-Yam, A. 2004, MNRAS, 347, 951
- Maoz et al. (2010) Maoz, D., Mannucci, F., Li, W., Filippenko, A. V., Della Valle, M., & Panagia, N. 2010, ArXiv e-prints
- Neill et al. (2006) Neill, J. D., Sullivan, M., Balam, D., Pritchet, C. J., Howell, D. A., Perrett, K., Astier, P., Aubourg, E., Basa, S., Carlberg, R. G., Conley, A., Fabbro, S., Fouchez, D., Guy, J., Hook, I., Pain, R., Palanque-Delabrouille, N., Regnault, N., Rich, J., Taillet, R., Aldering, G., Antilogus, P., Arsenijevic, V., Balland, C., Baumont, S., Bronder, J., Ellis, R. S., Filiol, M., Gonçalves, A. C., Hardin, D., Kowalski, M., Lidman, C., Lusset, V., Mouchet, M., Mourao, A., Perlmutter, S., Ripoche, P., Schlegel, D., & Tao, C. 2006, AJ, 132, 1126
- Neill et al. (2007) Neill, J. D., Sullivan, M., Balam, D., Pritchet, C. J., Howell, D. A., Perrett, K., Astier, P., Aubourg, E., Basa, S., Carlberg, R. G., Conley, A., Fabbro, S., Fouchez, D., Guy, J., Hook, I., Pain, R., Palanque-Delabrouille, N., Regnault, N., Rich, J., Taillet, R., Aldering, G., Antilogus, P., Arsenijevic, V., Balland, C., Baumont, S., Bronder, J., Ellis, R. S., Filiol, M., Gonçalves, A. C., Hardin, D., Kowalski, M., Lidman, C., Lusset, V., Mouchet, M., Mourao, A., Perlmutter, S., Ripoche, P., Schlegel, D., & Tao, C. 2007, in American Institute of Physics Conference Series, Vol. 924, The Multicolored Landscape of Compact Objects and Their Explosive Origins, ed. T. di Salvo, G. L. Israel, L. Piersant, L. Burderi, G. Matt, A. Tornambe, & M. T. Menna, 421–424
- Neill et al. (2009) Neill, J. D., Sullivan, M., Howell, D. A., Conley, A., Seibert, M., Martin, D. C., Barlow, T. A., Foster, K., Friedman, P. G., Morrissey, P., Neff, S. G., Schiminovich, D., Wyder, T. K., Bianchi, L., Donas, J., Heckman, T. M., Lee, Y., Madore, B. F., Milliard, B., Rich, R. M., & Szalay, A. S. 2009, ApJ, 707, 1449
- Oda et al. (2008) Oda, T., Totani, T., Yasuda, N., Sumi, T., Morokuma, T., Doi, M., & Kosugi, G. 2008, PASJ, 60, 169
- Pavlovsky et al. (2004) Pavlovsky, C., Biretta, J., Bohlin, R., Chiaberge, M., Cox, C., Dressel, L., Fruchter, A., Giavalisco, M., Gilliland, R., Gonzaga, S., Koekemoer, A., Lucas, R., Mack, J., Maiz-Apellaniz, J., Mutchler, M., Platais, V., Proffitt, C., Riess, A., Sahu, K., Sembach, K., Sirianni, M., van der Marel, R., & Walborn, N. 2004, ACS Data Handbook, ed. Pavlovsky, C.
- Perlmutter et al. (1999) Perlmutter, S., Aldering, G., Goldhaber, G., Knop, R. A., Nugent, P., Castro, P. G., Deustua, S., Fabbro, S., Goobar, A., Groom, D. E., Hook, I. M., Kim, A. G., Kim, M. Y., Lee, J. C., Nunes, N. J., Pain, R., Pennypacker, C. R., Quimby, R., Lidman, C., Ellis, R. S., Irwin, M., McMahon, R. G., Ruiz-Lapuente, P., Walton, N., Schaefer, B., Boyle, B. J., Filippenko, A. V., Matheson, T., Fruchter, A. S., Panagia, N., Newberg, H. J. M., Couch, W. J., & The Supernova Cosmology Project. 1999, ApJ, 517, 565
- Phillips (1993) Phillips, M. M. 1993, ApJ, 413, L105
- Podsiadlowski et al. (2008) Podsiadlowski, P., Mazzali, P., Lesaffre, P., Han, Z., & Förster, F. 2008, New Astronomy Review, 52, 381
- Poznanski et al. (2007) Poznanski, D., Maoz, D., Yasuda, N., Foley, R. J., Doi, M., Filippenko, A. V., Fukugita, M., Gal-Yam, A., Jannuzi, B. T., Morokuma, T., Oda, T., Schweiker, H., Sharon, K., Silverman, J. M., & Totani, T. 2007, MNRAS, 382, 1169
- Pritchet et al. (2008) Pritchet, C. J., Howell, D. A., & Sullivan, M. 2008, ApJ, 683, L25
- Raskin et al. (2009) Raskin, C., Scannapieco, E., Rhoads, J., & Della Valle, M. 2009, ApJ, 707, 74
- Reach et al. (2005) Reach, W. T., Megeath, S. T., Cohen, M., Hora, J., Carey, S., Surace, J., Willner, S. P., Barmby, P., Wilson, G., Glaccum, W., Lowrance, P., Marengo, M., & Fazio, G. G. 2005, PASP, 117, 978
- Riess et al. (1998) Riess, A. G., Filippenko, A. V., Challis, P., Clocchiatti, A., Diercks, A., Garnavich, P. M., Gilliland, R. L., Hogan, C. J., Jha, S., Kirshner, R. P., Leibundgut, B., Phillips, M. M., Reiss, D., Schmidt, B. P., Schommer, R. A., Smith, R. C., Spyromilio, J., Stubbs, C., Suntzeff, N. B., & Tonry, J. 1998, AJ, 116, 1009
- Riess et al. (2001) Riess, A. G., Nugent, P. E., Gilliland, R. L., Schmidt, B. P., Tonry, J., Dickinson, M., Thompson, R. I., Budavári, T., Casertano, S., Evans, A. S., Filippenko, A. V., Livio, M., Sanders, D. B., Shapley, A. E., Spinrad, H., Steidel, C. C., Stern, D., Surace, J., & Veilleux, S. 2001, ApJ, 560, 49
- Riess et al. (2007) Riess, A. G., Strolger, L., Casertano, S., Ferguson, H. C., Mobasher, B., Gold, B., Challis, P. J., Filippenko, A. V., Jha, S., Li, W., Tonry, J., Foley, R., Kirshner, R. P., Dickinson, M., MacDonald, E., Eisenstein, D., Livio, M., Younger, J., Xu, C., Dahlén, T., & Stern, D. 2007, ApJ, 659, 98
- Riess et al. (2004) Riess, A. G., Strolger, L., Tonry, J., Casertano, S., Ferguson, H. C., Mobasher, B., Challis, P., Filippenko, A. V., Jha, S., Li, W., Chornock, R., Kirshner, R. P., Leibundgut, B., Dickinson, M., Livio, M., Giavalisco, M., Steidel, C. C., Benítez, T., & Tsvetanov, Z. 2004, ApJ, 607, 665
- Scannapieco & Bildsten (2005) Scannapieco, E. & Bildsten, L. 2005, ApJ, 629, L85
- Schawinski (2009) Schawinski, K. 2009, MNRAS, 397, 717
- Strolger et al. (2010) Strolger, L., Dahlen, T., & Riess, A. G. 2010, ApJ, 713, 32
- Strolger et al. (2004) Strolger, L., Riess, A. G., Dahlen, T., Livio, M., Panagia, N., Challis, P., Tonry, J. L., Filippenko, A. V., Chornock, R., Ferguson, H., Koekemoer, A., Mobasher, B., Dickinson, M., Giavalisco, M., Casertano, S., Hook, R., Blondin, S., Leibundgut, B., Nonino, M., Rosati, P., Spinrad, H., Steidel, C. C., Stern, D., Garnavich, P. M., Matheson, T., Grogin, N., Hornschemeier, A., Kretchmer, C., Laidler, V. G., Lee, K., Lucas, R., de Mello, D., Moustakas, L. A., Ravindranath, S., Richardson, M., & Taylor, E. 2004, ApJ, 613, 200
- Sullivan et al. (2010) Sullivan, M., Conley, A., Howell, D. A., Neill, J. D., Astier, P., Balland, C., Basa, S., Carlberg, R. G., Fouchez, D., Guy, J., Hardin, D., Hook, I. M., Pain, R., Palanque-Delabrouille, N., Perrett, K. M., Pritchet, C. J., Regnault, N., Rich, J., Ruhlmann-Kleider, V., Baumont, S., Hsiao, E., Kronborg, T., Lidman, C., Perlmutter, S., & Walker, E. S. 2010, MNRAS, 406, 782
- Sullivan et al. (2009) Sullivan, M., Ellis, R. S., Howell, D. A., Riess, A., Nugent, P. E., & Gal-Yam, A. 2009, ApJ, 693, L76
- Sullivan et al. (2006) Sullivan, M., Le Borgne, D., Pritchet, C. J., Hodsman, A., Neill, J. D., Howell, D. A., Carlberg, R. G., Astier, P., Aubourg, E., Balam, D., Basa, S., Conley, A., Fabbro, S., Fouchez, D., Guy, J., Hook, I., Pain, R., Palanque-Delabrouille, N., Perrett, K., Regnault, N., Rich, J., Taillet, R., Baumont, S., Bronder, J., Ellis, R. S., Filiol, M., Lusset, V., Perlmutter, S., Ripoche, P., & Tao, C. 2006, ApJ, 648, 868
- Taylor (2003) Taylor, M. B. 2003, Topcat, http://www.starlink.ac.uk/topcat/
- Thatte et al. (2009) Thatte, D., Dahlen, T., & al., e. 2009, NICMOS Data Handbook, ed. Thatte, D.
- Totani et al. (2008) Totani, T., Morokuma, T., Oda, T., Doi, M., & Yasuda, N. 2008, PASJ, 60, 1327
- Tumlinson et al. (2004) Tumlinson, J., Venkatesan, A., & Shull, J. M. 2004, ApJ, 612, 602
- van den Bergh (1990) van den Bergh, S. 1990, PASP, 102, 1318
- Wang et al. (1997) Wang, L., Hoeflich, P., & Wheeler, J. C. 1997, ApJ, 483, L29+
- Williams et al. (1996) Williams, R. E., Blacker, B., Dickinson, M., Dixon, W. V. D., Ferguson, H. C., Fruchter, A. S., Giavalisco, M., Gilliland, R. L., Heyer, I., Katsanis, R., Levay, Z., Lucas, R. A., McElroy, D. B., Petro, L., Postman, M., Adorf, H., & Hook, R. 1996, AJ, 112, 1335