Formation Efficiencies of Old Globular Clusters - form dwarf to giant galaxies
Abstract
For the full galaxy mass range, we find that previously observed trends of globular cluster (GC) system scaling parameters (number, luminosity or mass of all GCs in a galaxy normalized to the host galaxy luminosity or mass, e.g. ) as a function of galaxy mass, holds irrespective of galaxy type or environment. The value of early-type galaxies is, on average, twice that of late-types. We derive theoretical predictions which describe remarkably well the observed GC system scaling parameter distributions given an assumed GC formation efficiency (), i.e. the ratio of total mass in GCs to galaxy halo mass. It has a mean value of , and increasing scatter toward low galaxy mass. The excess -values of some massive galaxies compared to expectations from the mean model prediction, may be attributed to an efficient GC formation, inefficient production of field stars, accretion of low-mass high- galaxies or likely a mixture of all these effects.
1 Introduction
The number, luminosity or mass of the entire globular cluster (GC) system normalized to the host galaxy luminosity or mass defines the fundamental quantities specific frequency (), luminosity (), specific mass () and specific number () of GCs (cf. Eqns 1). These GC scaling relations indicate how efficiently galaxies form GCs per unit of their luminosity or mass. Those has been observed to vary significantly, being high for dwarf and giant galaxies ([2, 3, 4]), and with a minimum at a galaxy luminosity of mag (). That is, the two extreme galaxy mass regimes, dwarfs and giants, seemingly form old GCs in similar proportions. This scaling relations provide important observational constraints and test for models of star, GC and galaxy formation ([5, 6, 7, 4, 8]).
2 Analysis and Results
In Georgiev et al. (2010), we investigate this trend with observations of GC populations of a large sample late-type dwarf galaxies with HST/ACS ([9, 10]). In order to sample the entire range in galaxy mass, environment, and morphology we augment our sample with data with data from the literature. We find that relations between the GCS scaling parameters and galaxy luminosity holds irrespective of galaxy morphological type and on average, early-type galaxies have higher -values than late-types at the same luminosity. To investigate the observed trends, which have not yet been conclusively explained, we derive theoretical predictions of GC system scaling parameters as a function of the total host galaxy mass based on the models of Dekel Brinboim (2006) in which star-formation processes (i.e. thermal properties of the gas) are regulated by stellar/supernova feedback below a stellar mass of , and by virial shocks (’hot stream’) above it, causing a suppression of star formation.
Specific frequency and luminosity
| (1) |
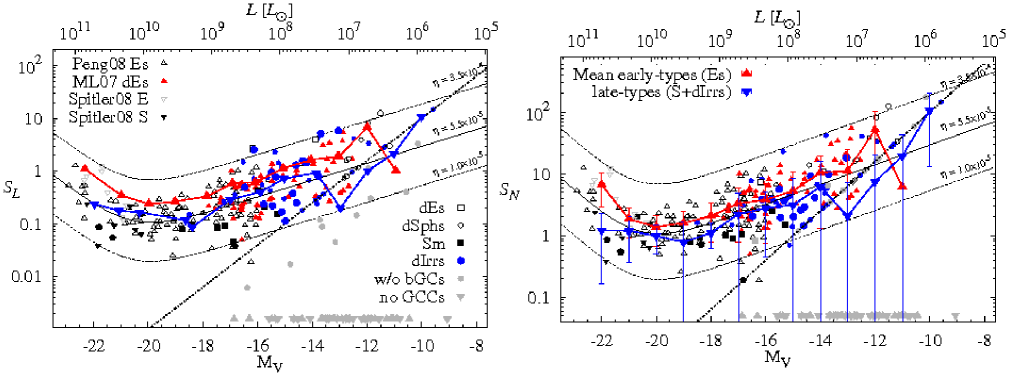
can be related to the galaxy halo mass by defining the GC formation efficiency: . Dekel & Birnboim (2006) model predicts below and above galaxy stellar mass .
| (2) |
where are observationally derived normalization constants, and are the typical GC mass and mass-to-light ratio. The functional relations (Eqs 2) describe remarkably well the observed distributions (Fig. 1). This supports that GCs form in proportion to the strength of the host potential (galaxy mass) as well as the effect on the GC formation efficiency by the physical mechanisms in the Dekel & Birnboim model of galaxy evolution (thermal properties, shock stability and cooling physics of gas due to feedback from SNe, UV on dust, photoionization, AGN and dynamical friction). Therefore, this model is a good representation of the GC formation efficiency (). A better model should, in addition, take into account variations in the individual galaxy star formation history, merging history, conditions for cluster formation and destruction and the stochastic nature of star formation at low galaxy mass. Observations of GCSs of late-type, spiral galaxies in the high galaxy mass regime are necessary to probe whether their GC formation efficiencies are statistically different than that of early-type galaxies at same galaxy mass.
References
- [1] Georgiev, I.,Y., Puzia, T.,H., Goudfrooij, P., Hilker, M., 2010, MNRAS, 406, 1967
- [2] Harris, W. E. 1991, ARA&A, 29, 543
- [3] Miller, B. W. & Lotz, J. M. 2007, ApJ, 670, 1074
- [4] Peng, E. W., Jordan, A., Cote, P., et al. 2008, ApJ, 681, 197
- [5] McLaughlin, D. E. 1999, AJ, 117, 2398
- [6] Forbes, D. A. 2005, ApJL, 635, L137
- [7] Pipino, A., Puzia, T. H., & Matteucci, F. 2007, ApJ, 665, 295
- [8] Muratov, A. L. & Gnedin, O. Y. 2010, ApJ, 718, 1266
- [9] Georgiev, I. Y., Goudfrooij, P., Puzia, T. H., & Hilker, M. 2008, AJ, 135, 1858
- [10] Georgiev, I. Y., Puzia, T. H., Hilker, M., & Goudfrooij, P. 2009, MNRAS, 392, 879
- [11] Dekel, A. & Birnboim, Y. 2006, MNRAS, 368, 2