Using explosive percolation in analysis of real-world networks
Abstract
We apply a variant of the explosive percolation procedure to large real-world networks, and show with finite-size scaling that the university class, ordinary or explosive, of the resulting percolation transition depends on the structural properties of the network as well as the number of unoccupied links considered for comparison in our procedure. We observe that in our social networks, the percolation clusters close to the critical point are related to the community structure. This relationship is further highlighted by applying the procedure to model networks with pre-defined communities.
pacs:
89.75.Fb,64.60.ah,89.75.Hc,89.75.DaI Introduction
The percolation process realized by the Achlioptas procedure Achlioptas09 is different from classical percolation. This “explosive percolation” begins with a graph of isolated nodes and at each step, two potential edges are chosen at random. Then, the edge that minimizes the product or sum of the sizes of the two components that would be merged is added to the graph. This procedure eventually leads to an explosive percolation transition that appears discontinuous (first order). However, it has recently been argued that in reality the transition is continuous and belongs to a new universality class with very small exponent of the order parameter daCosta10 . The above or similar procedures have been applied to various model networks ranging from regular lattices Ziff09 to scale-free networks Radicchi09 ; *Cho09. Several papers have painted an intuitive picture of the mechanisms behind this behavior such as local cluster aggregation Cho10 ; *DSouza10, formation of many large components before percolation transition Friedman09 , or inhibition of growth of the largest cluster Araujo10 . Other criteria for the growth process have also been suggested, such as choosing edges proportionally to a weight determined by their cluster sizes Manna11 .
While explosive percolation has triggered a considerable amount of theoretical and simulation work, its application to real-world networks or processes has been limited Rozenfeld10 . The topological characteristics of real-world networks, such as high clustering, degree correlations, community structure, and weight-topology correlations, are far from those of regular or random model graphs Newman06a . Such features play a role in the characteristics of classical percolation that has earlier been successfully applied to investigate real-world network structure. Here we ask if they also play a crucial role in explosive percolation, and if monitoring the percolation process itself yields important information about the network structure. As a pre-requisite, we establish that proper link addition rules yield explosive percolation transitions when applied to real-world networks. However, this depends both on the network structure and the details of the evolution rules.
II Data and methods
For our empirical networks, we have chosen a mobile phone call network (MPC) Onnela07 and a large ArXiv co-authorship network (CA) Newman01a . Both networks are social, so that nodes represent people and ties their interactions, and are large enough for percolation studies. They also share features common to social networks, such as community structure and assortativity Newman06a . For the MPC, it has been shown that tie strengths relate to network topology: strong ties are associated with dense network neighborhoods (communities) Granovetter73 ; *Onnela07b. Such weight-topology correlations are reflected in classical percolation behavior. For the CA, to the best of our knowledge, weight-topology correlations have not been studied in detail before.
The MPC data consists of voice calls over a period of 120 days. We construct an aggregated undirected weighted network of edges with bidirectional calls between users, weights representing the total number of calls. The largest connected component (LCC) is then extracted, with nodes and edges. The collaboration data is from the arXiv Arxiv and contains all e-prints in “physics” until March 2010. There are 4.8 article headers, from which we extract the authors. In the co-authorship (CA) network two authors are connected if they have co-authored articles, whose number determines the link weight. We then extract the LCC, with nodes and edges. In addition, we construct a filtered version of the CA, where articles with more than 10 authors ( of articles) are ignored. This is to remove the very large cliques from papers with authors in fields such as hep-ex or astro-ph, where the principles behind collaboration network formation appear different. The LCC of the resulting small collaboration co-authorship (SCA) network has nodes and edges. Note that, although the number of nodes is not much smaller than for the CA, the number of edges is an order of magnitude less.
For the percolation process, we use the min-cluster (MC-) sum rule with different values of , defined as follows. Initially, all the edges of the empirical network are considered unoccupied. Then, at each time step, unoccupied edges are drawn at random. Out of these, the edge that would minimize the size of the component formed if the edge were occupied is chosen. Intra-component edges are always favored against inter-component edges as they do not increase the size of any cluster. When comparing two inter-component edges, we select the one for which the sum of cluster sizes that it connects is minimized. Ties are resolved randomly. We also study the limiting case (), where all unoccupied edges are considered at each step. This leads to a semi-deterministic process where all intra-cluster links get occupied before the cluster grows in size. The only source of randomness is the existence of clusters of same size during the process 111A similar rule has been introduced independently in J.S. Andrade, et.al., arXiv:1010.5097, which appear after submission of this manuscript..
III Results
III.1 Percolation analysis
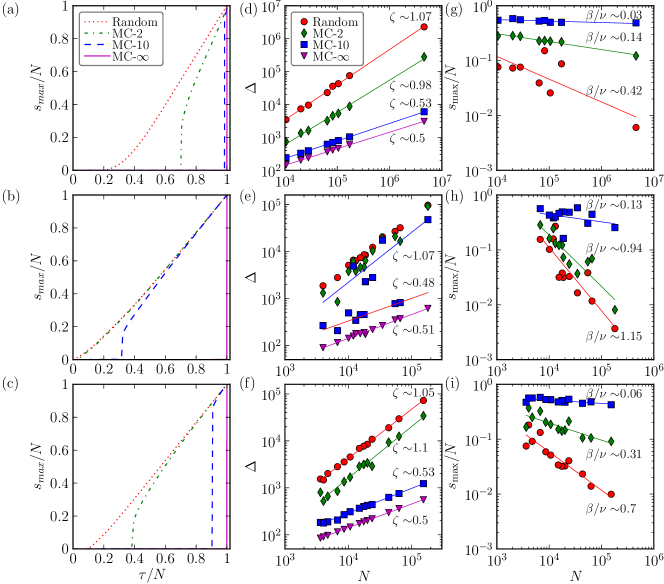
Let us first monitor the behavior of the order parameter, i.e. the relative size of the largest cluster, , as the fraction of occupied edges is increased. As intra-cluster edges do not affect cluster growth, we consider the number of inter-cluster edges instead of 222 In literature, has also been used as the control parameter, with slightly different MC rules; for those, intra-cluster links do play a role Moreira10 .. We apply three variants of the MC rule: MC-2, MC-10, and MC-, as well as random link percolation for comparison. Fig. 1 (a,b,c) shows the variation of the fraction against the scaled number of inter-component edges, . For all three networks, the transition of the order parameter is smooth for the random case, while for the extreme case, MC-, the transition appears abrupt. However, for MC-2 and MC-10, the situation is more complicated, and we study them in detail.
To determine the nature of the transition, Achlioptas et al. Achlioptas09 studied the dependence of the width of the transition window on system size. This width can be quantified as , where and are the lowest values of for which and , respectively. In general the width scales as a power law with the system size, . For classical percolation, . It was argued that for explosive percolation and the rescaled width of the transition region, , vanishes in the limit of large . While recent results daCosta10 argue that the transition region is in reality finite, the very small exponent of the order parameter guarantees that in practice it is vanishingly small even for large systems.
For applying finite-size scaling to empirical networks, samples of different sizes are needed. In general, unbiased sampling of a network is difficult. Here, we take advantage of the known properties of our networks. Call networks are geographically embedded Krings09 ; *AhnLinkCommunitiesNature2010, and we extract subnetworks of users in chosen cities, based on postal codes of their subscriptions. For the co-authorship networks, we extract sub-networks of authors with articles in the same subject class. We see that for all networks , with for random and for the MC- case (Fig. 1 (d,e,f)). Thus the exponent clearly differentiates the explosive transition from random-link percolation. Further, for all three networks, for the MC-2, resembling an ordinary percolation transition. However, for MC-10, the scaling exponent behaves differently for the three networks. For the MPC and SCA networks, , indicating explosive percolation. For the CA, at first it appears that the data points do not follow scaling. However, a closer inspection shows that they cluster around two straight lines with and . Indeed, for subnetworks with large collaborations (e.g., hep-ex, hep-ph) , whereas for other subject classes (e.g., cond-mat, math-ph), .
In addition, we have performed a finite-size scaling analysis of the order parameter Radicchi10 . The scaling relation for is given by
| (1) |
where is some universal function, is the control parameter, is the critical point of transition, is the critical exponent of the order parameter and that of the correlation length. We choose the critical value of the control parameter as the value of where the susceptibility, i.e., average cluster size has its maximum. Note that could also be chosen as the point where the cluster size distribution becomes a power law daCosta10 ; however, since our range of network sizes includes fairly small networks, this would be too inaccurate as in some cases there are not enough clusters for determining the shape of the distribution.
For the mobile phone call (MPC) network [Fig 1 (g)], we find that the scaling at of the order parameter yields a very small exponent for the MC-10 case, while for MC-2 and random percolation, the exponents are larger, and , respectively. The exponents for the small collaboration co-authorship (SCA) network behave similarly [Fig 1 (h)], with a low value for the MC-10 case, and relatively high values and for MC-2 and random percolation, respectively. In contrast, for the co-authorship (CA) network, the exponents have high values for all cases [Fig 1 (i)], , and , for MC-10, MC-2 and random percolation, respectively.
In order to compare our results to the existing literature, we follow the relations for the critical exponents given in Ref daCosta10 : . The value for the exponent given in Ref daCosta10 yields . This value is consistent with our observation that the transition for MC-10 is explosive in the MPC and SCA networks, while it is ordinary in the CA network. Note that such small but finite values of the exponent are consistent with a 2nd order transition; however, because we are dealing with single, finite-size networks, we cannot make definite conclusions. Further, in all the three systems MC-2 behaves similar to the ordinary random percolation.
Thus our percolation analysis on CA and SCA networks reveals a difference between collaboration structures in different fields. One possible explanation is the broad degree distribution for the CA network, whose tail can be approximated with a power law with exponent in contrast to SCA, which decays as . Hence, in this respect, the SCA network structure resembles the social network of the MPC. Further, it is clear that the nature of the transition depends both on the number of edges considered in the percolation process and structural features of the network.
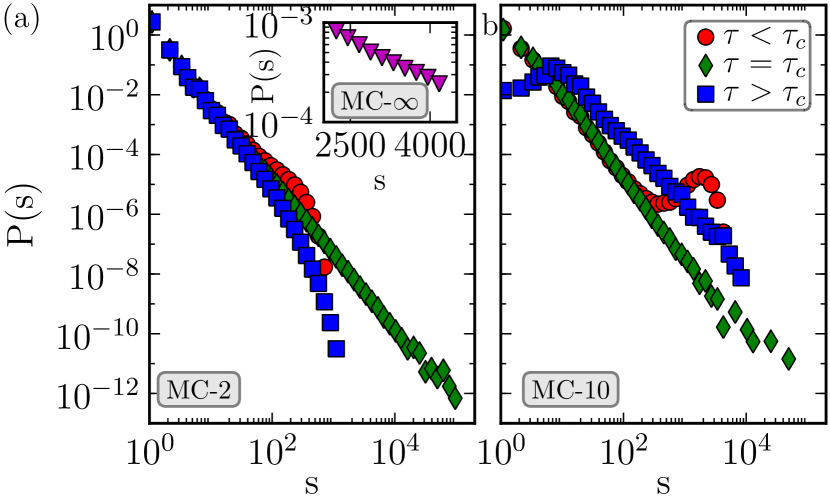
For the rest of this paper we focus only on the complete MPC and SCA networks, and first study their cluster size distributions around the critical point, . For the following, we have chosen as the point at which is a power law for the full region of daCosta10 . The complete networks are large enough to choose this way, giving us in this case a more precise value than the susceptibility peaks. Then, we sweep the value of around this point and monitor the distribution of cluster sizes. Fig. 2 (a,b) shows the cluster size distributions around for the MCP, for MC-2, MC-10, and MC-. For MC-2, behaves as usual for ordinary percolation, becoming a power law at and then turning exponential. For MC-10, the situation is different: for , there is a bump in the tail of the distribution, in line with theoretical predictions for explosive percolation daCosta10 . Immediately above , the smallest remaining clusters get depleted from the distribution as they are the first to join the giant cluster. For the semi-deterministic MC- (inset), the cluster size distribution resembles exponential for . The cluster size distributions for SCA are qualitatively similar.
III.2 Percolation clusters, weight-topology correlations, and communities
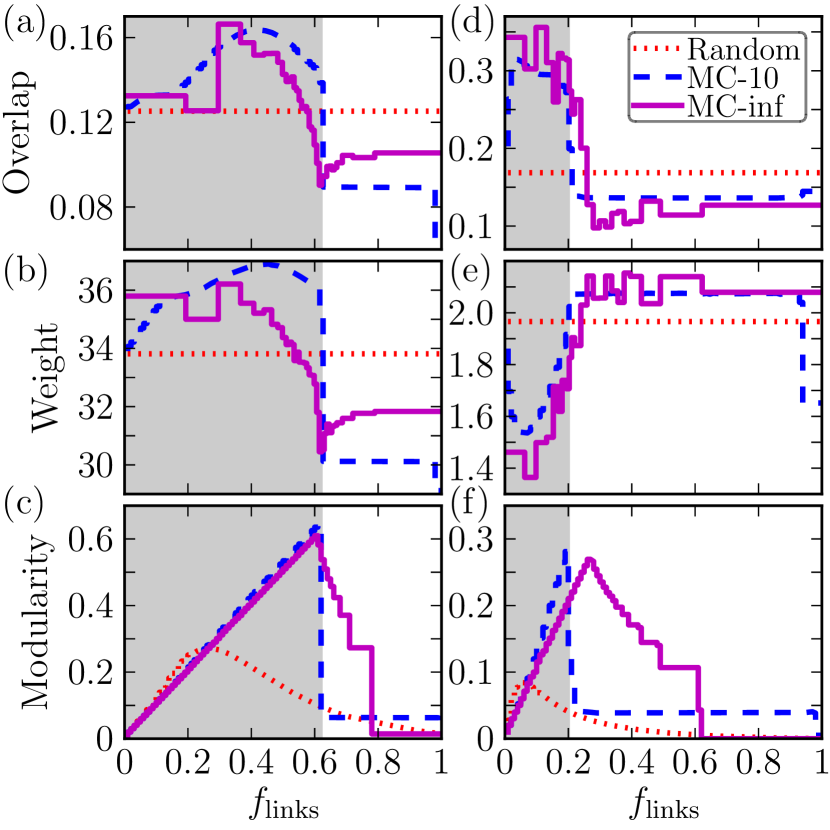
Next, we investigate the evolution of the percolation clusters and their relationship to communities and the weight-topology correlations. We study the overlap of the neighborhoods of endpoint nodes and of a link, defined as
| (2) |
where is the number of neighbors common to both nodes, and and are their degrees Onnela07 . This measure quantifies the extent by which two connected nodes share their neighborhoods: if and have no common neighbors, then , and if and share all of their neighbors, . Thus if there are dense communities in the network, links inside the communities have high values of overlap, whereas links acting as “bridges” connecting separate communities have low overlap values.
Fig. 3 (a) displays the results for the MPC network. As expected, for random link addition, the overlap and the time when edges are added in the percolation process are uncorrelated. For MC-10 and MC-, edges with high overlap and weight are added first [Fig. 3 (a,b)]. This indicates that dense regions of the network, i.e. communities, get percolated first. Both quantities show an abrupt drop at the transition point. This fits well with the Granovetterian weight-topology correlations observed earlier Onnela07 . However, the behavior of the SCA network is different. Although high-overlap edges are added first [Fig. 3 (d)], their weights are low [Fig. 3 (e)]. This points towards fundamentally different weight-topology correlations, where strong links act as bridges between communities of weaker links. A likely explanation is that communities organize around senior scientists (hubs), with whom junior researchers are linked. The latter has a small number of joint publications with the local hubs, as they are only temporarily connected. The hubs, in turn, are linked via long-lasting collaborations and many co-authored papers.
The relationship to community structure is confirmed with the behavior of the modularity Newman04a of percolation clusters, defined as
| (3) |
where the sum runs over clusters, is the number of links in the network, is the number of links within cluster , and is the sum of the degrees of nodes in . High values of correspond to a good community partition – hence, a high value of modularity calculated for percolation clusters indicates that they match well with communities. As for the other quantities, we calculate as a function of the fraction of links added . As seen in [Fig. 3 (e,f)], the peak of and the following sharp transition match the transition points well for MC-10. For the semi-deterministic MC-, the peak also matches the percolation point although the transition is less sharp.
III.3 Analysis of network model with communities
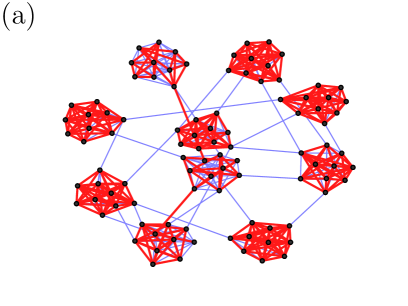
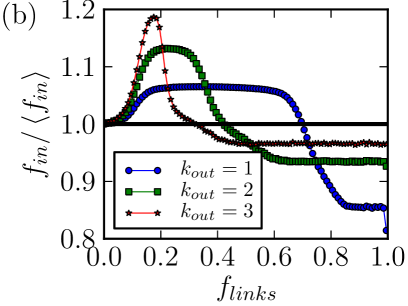
It appears that the explosive percolation process follows community structure when applied to a network where such structure exists. Communities in real-world networks are, however, hard to define unambiguously, and therefore we turn to a simple model with built-in community structure Newman04a ; Pan09a . In this model, nodes are arranged into communities of equal size, and edges are placed at random such that on average each node has intra-community links and inter-community links. When applying the MC- sum rule to this network, we find that mostly intra-community edges are occupied before the transition point [Fig. 4 (a)]. We quantify this by measuring the fraction of intra-community links that have been added during the process, normalized by the respective fraction for random link addition. It is evident from Fig. 4 (b) that the MC rules prefer intra-community links early on in the process, and inter-community links only get added towards the end.
To quantify the match between percolation clusters and the model communities, we consider the confusion matrix with elements
| (4) |
where is the -th cluster and is the -th community. Hence, the element represents the number of nodes in the intersection of cluster and community .
There is a perfect match if clusters are subsets of communities and vice versa, i.e. clusters equal communities. The extent to which clusters are subsets of communities can be measured by the projection number of on , defined as
| (5) |
i.e., the sum of the maximum of each row in the confusion matrix. increases with cluster size, reaching its maximum when there is a single cluster that overlaps with all communities. For the reverse case, communities as subsets of clusters, one can define a similar projection number , i.e., the sum of the maximum of each column in the matrix. This number is maximized when the clusters are as small as possible, i.e. single nodes, and decreases with increasing cluster size vanDongen00 ; *Meila07. The quality of matching can now be quantified with the normalized average of both projection numbers,
| (6) |
reaching its maximum when the match between clusters and communities is optimal.
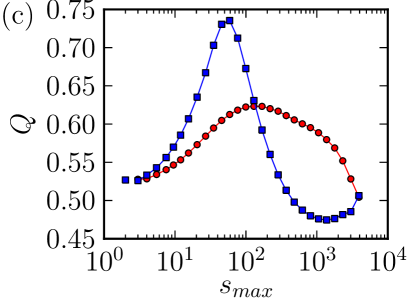
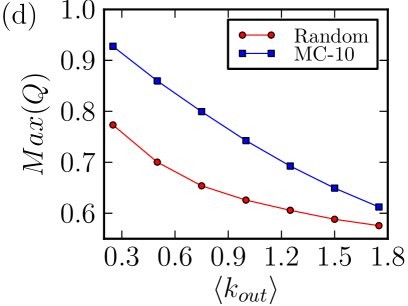
Fig. 4 (c) shows the behavior of for the model network as a function of the size of the largest observed cluster spanned by the added links. Here we use the largest cluster size instead of because this provides us with a more detailed view on what happens around the transition point; the cluster sizes change only a little beyond this region. It is seen that initially increases and then decreases as a function of , reaching its maximum before the formation of the giant component and merging of clusters. The percolation clusters coincide well with the model communities below and around compared to random link addition. We next study the behavior of the maximum of quality as we make the community structure more smeared-out by increasing while keeping the average total degree fixed [Fig. 4 (d)]. Although decreases as increases for both the MC- and random addition, its higher value for the MC- process indicates better match with the built-in communities.
We also obtain qualitatively similar results by using normalized the mutual information (NMI) instead of the matching quality (not shown). The mutual information Danon05 can be defined using the confusion matrix as
| (7) |
where and are the size of the -th community and -th cluster, respectively. The normalized mutual information is then defined as
| (8) |
where is the entropy of the community , and is the entropy of the cluster . In our case, where we have large number of small communities, the NMI does not however work as well as the matching quality. This is because the NMI values are high already at the beginning of the percolation process when all the nodes are isolated forming their own clusters. In this case, , which approaches if the model network size is increased keeping the community sizes, fixed. In contrast, the initial value of the quality is , which is independent of the number of communities.
IV Summary and conclusions
To summarize, we have shown that the Achlioptas procedure can give rise to an explosive percolation transition when the rules are applied to empirical real-world social networks. We have used a variant of the Minimum Cluster (MC) rule, where the number of links compared during the link addition process is a parameter, and shown that both the network structure and the number of links compared have an influence on the universality class (ordinary or explosive) of the observed percolation transition. In order to show this, we have carried out finite-size scaling using subnetworks, chosen on the basis of known external properties of the empirical networks. This is an important but non-trivial task when percolation analysis is applied to empirical networks where only a single “realization” is available. The resulting values for critical exponents are in line with the view that the explosive percolation transition is in fact second order; however, one cannot make definite conclusions since we are dealing with singe, finite-size networks.
In addition, we have illustrated a connection between links selected by the MC rule during the percolation process and community structure – at the critical point, the cluster structure arising from the application of the MC rule reflects the community structure of the network. This is confirmed by the analysis of single-link properties (the overlap, link weight), and modularity for the empirical networks, and by detailed studies of the match between clusters and built-in community structure of model networks.
Acknowledgements.
Financial support from EU’s 7th Framework Program’s FET-Open to ICTeCollective project no. 238597 and by the Academy of Finland, the Finnish Center of Excellence program 2006-2011, project no. 129670, as well as by TEKES (FiDiPro) are gratefully acknowledged. We thank A.-L. Barabási for the MPC data used in this research.References
- (1) D. Achlioptas, R. M. D’Souza, and J. Spencer, Science 323, 1453 (2009)
- (2) R. A. da Costa, S. N. Dorogovtsev, A. V. Goltsev, and J. F. F. Mendes, Phys. Rev. Lett. 105, 255701 (2010)
- (3) R. M. Ziff, Phys. Rev. Lett. 103, 045701 (2009)
- (4) F. Radicchi and S. Fortunato, Phys. Rev. Lett. 103, 168701 (2009)
- (5) Y. S. Cho, J. S. Kim, J. Park, B. Kahng, and D. Kim, Phys. Rev. Lett. 103, 135702 (2009)
- (6) Y. S. Cho, B. Kahng, and D. Kim, Phys. Rev. E 81, 030103 (2010)
- (7) R. M. D’Souza and M. Mitzenmacher, Phys. Rev. Lett. 104, 195702 (2010)
- (8) E. J. Friedman and A. S. Landsberg, Phys. Rev. Lett. 103, 255701 (2009)
- (9) N. A. M. Araújo and H. J. Herrmann, Phys. Rev. Lett. 105, 035701 (2010)
- (10) S. Manna and A. Chatterjee, Physica A 390, 177 (2011)
- (11) H. D. Rozenfeld, L. K. Gallos, and H. A. Makse, Eur. Phys. J. B 75, 305 (2010)
- (12) M. Newman, A. L. Barabasi, and D. J. Watts, The Structure and Dynamics of Networks (Princeton University Press, Princeton, 2006)
- (13) J. P. Onnela, J. Saramäki, J. Hyvönen, G. Szabó, D. Lazer, K. Kaski, J. Kertész, and A. L. Barabási, Proc. Natl. Acad. Sci. U.S.A. 104, 7332 (2007)
- (14) M. E. J. Newman, Phys. Rev. E 64, 016132 (2001)
- (15) M. Granovetter, Am. J. Soc. 78, 1360 (1973)
- (16) J.-P. Onnela, J. Saramäki, J. Hyvönen, G. Szabó, M. A. de Menezes, K. Kaski, A.-L. Barabási, and J. Kertész, New J. Phys. 9, 179 (2007)
- (17) http://arxiv.org/
- (18) A similar rule has been introduced independently in J.S. Andrade, et.al., arXiv:1010.5097, which appear after submission of this manuscript.
- (19) In literature, has also been used as the control parameter, with slightly different MC rules; for those, intra-cluster links do play a role Moreira10 .
- (20) G. Krings, F. Calabrese, C. Ratti, and V. D. Blondel, J. Stat. Mech. 2009, L07003 (2009)
- (21) Y.-Y. Ahn, J. P. Bagrow, and S. Lehmann, Nature 466, 761 (2010)
- (22) F. Radicchi and S. Fortunato, Phys. Rev. E 81, 036110 (2010)
- (23) M. E. J. Newman and M. Girvan, Phys. Rev. E 69, 026113 (2004)
- (24) R. K. Pan and S. Sinha, Europhys. Lett. 85, 68006 (2009)
- (25) S. Van Dongen, Performance criteria for graph clustering and Markov cluster experiments, Technical Report INS-R0012 (Center for Mathematics and Computer Science (CWI), Amsterdam, 2000)
- (26) M. Meila, J. Multivariate Analysis 98, 873 (2007)
- (27) L. Danon, A. Diaz-Guilera, J. Duch, and A. Arenas, J. Stat. Mech., P09008(September 2005)
- (28) A. A. Moreira, E. A. Oliveira, S. D. S. Reis, H. J. Herrmann, and J. S. Andrade, Phys. Rev. E 81, 040101 (2010)