From brittle to ductile fracture in disordered materials
Abstract
We introduce a lattice model able to describe damage and yielding in heterogeneous materials ranging from brittle to ductile ones. Ductile fracture surfaces, obtained when the system breaks once the strain is completely localized, are shown to correspond to minimum energy surfaces. The similarity of the resulting fracture paths to the limits of brittle fracture or minimum energy surfaces is quantified. The model exhibits a smooth transition from brittleness to ductility, also present in how much plastic deformation is accumulated prior to fracture. The dynamics of yielding exhibits avalanches with a power-law distribution.
pacs:
62.20.F-, 62.20.M-, 05.40.-a, 61.43.-jUnderstanding and characterizing the complexity in material failure is of great interest in both basic physics research and materials science applications. Brittle materials fail in the elastic regime, while ductile materials can locally accumulate plastic deformation prior to fracture and they are often able to withstand higher stresses before reaching fracture greer95 . Numerical models of fracture often involve molecular dynamics simulations shukla ; buehler . To go beyond these, brittle fracture with its simpler rheology has been extensively analyzed at the mesoscopic scale by both scalar and tensorial lattice models alava06 . This provides theoretical tools for understanding the intermittency observed in fracture– avalanches– and the question why crack surfaces roughen, to name some key problems alava06 . Other mesoscale models have been developed for plastic deformation and its accumulation in amorphous and disordered materials pp92 ; sor93a ; sor93b ; roux02 ; sor99 . In plastic deformation one sees, in analogy to brittle fracture, general scaling laws like acoustic emission miguel01 ; richeton06 ; wang09 and strain avalanche distributions dimiduk06 ; schwer07 ; zaiser08 ; sun10 . A relevant phenomenon is the spatial localization of strain, sometimes noticeable as shear bands that can then induce final failure li05 ; li07 ; yao08 ; schall07 . One important issue in plasticity has been “optimization”, as the yield surface may minimize the sum of certain local random quenched variables pp92 ; picallo09 .
In this Letter we study a scalar lattice model for fracture and plastic deformation in elasto-plastic heterogeneous materials. Depending on the material properties the model is able to exhibit fracture in situations that range from brittle to ductile behavior. In analogy to dislocation dynamics and other scenarios of plastic deformation, for ductile systems the dynamics of yielding is characterized by strain bursts miguel01 ; richeton06 ; wang09 ; dimiduk06 ; schwer07 ; zaiser08 . Finally, plastic deformation localizes into shear bands, until a crack develops. The model is a generalization of the well-known random fuse model (RFM) arcangelis85 for brittle fracture. Our ductile random fuse model (DRFM) is able to accumulate plastic deformation before complete failure. Depending on a model parameter, the model can interpolate between brittle failure or perfect plasticity depending on how ductile the system is, or how much it can yield. Due to the two intertwined dynamics of fracture and yielding the DRFM presents a very rich behavior, which we explore below.
The model.-
The RFM represents a scalar lattice electrical analog of the elasticity problem where the local stress (), strain (), and local elastic modulus () are mapped to the current (), potential drop (), and local conductance (), respectively, of a network of fuses subject to an external voltage. Bus bar boundary conditions are imposed at the top and bottom of the system and periodic boundary conditions in the transverse directions. Each individual fuse behaves ohmic (elastic), (equivalently, ), up to a local threshold current , which is a uniformly distributed quenched random variable.
The DRFM that we introduce here is based on the scalar tectonic model of Cowie et al. sor93b , but it could readily be extended to tensorial models with more degrees of freedom such as beam models alava06 . Whenever a fuse reaches its threshold , a permanent deformation is imposed to the element and it becomes elastic again. This defines a “healing cycle” of the individual element. In the electrical analogue this healing is done by imposing a voltage source (i.e. an electric battery) in series with the fuse to generate an opposite current through it so that elastic deformation is relaxed below threshold while plastic deformation accumulates in the element. The magnitude of the local voltage source used to heal a fuse is linearly related to its threshold, where is a parameter that controls how much local deformation is allowed to be accumulated at each healing cycle. We repeat this healing cycle a fixed number of times for each fuse going above threshold (see top panel of Fig. 1) until it definitely breaks. The number of healing cycles that each individual element can go through before failure is fixed for all the fuses and parametrizes in a simple and convenient manner the yielding characteristics (ductility) of the material. In our simulations we used and the local elastic modulus or conductivity , unless stated otherwise. Note that in the double limit and , one would obtain a elastic-perfectly plastic response. At each step of the simulation both the fuse closest to threshold and the external voltage required to reach it can be exactly calculated. Therefore, the external voltage is increased exactly up to the point where the next fuse in the network reaches its threshold. The current redistribution after the healing of a fuse can cause other fuses to also reach their thresholds. Therefore, avalanches of plastic events are observed similar to the strain bursts observed in experiments dimiduk06 ; ng09 ; wang09 .
Eventually fracture occurs as follows. At any given time in the simulation different sites of the network have gone through a different number of healing cycles, reflecting the spatially varying distribution of strain in the system. A fuse is forced to burn (break) after having gone through a fixed number of healing cycles , so that this quantity parametrizes the capability of the system to sustain local deformation. The fuse then irreversibly becomes an insulator and all the voltage sources that were imposed as plastic deformation are removed. When a continuous path of insulating bonds is formed, the system is disconnected and fails completely.
Brittle versus ductile fracture surfaces.-
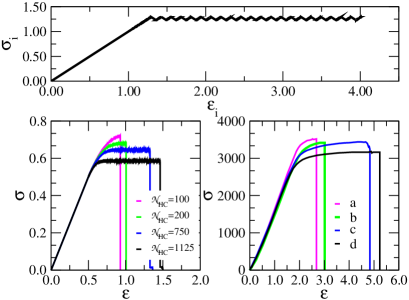
We have studied the DRFM in two dimensions in a system of size . Bus bars at and impose an external voltage across the system. Figure 1 (top panel) shows the stress-strain curve for an individual element of the network in the DRFM. Each stress drop corresponds to a healing cycle of the element and the amplitude of the zig-zag is proportional to . Global stress in this model is defined as and the strain is given by , where is the total current, is the voltage drop, and for a system of size L in a “diamond” ( tilted square) lattice. Figure 1 (left bottom panel) shows the global stress-strain curve for as the number of healing cycles before breakdown is increased and the median of the threshold distribution is progressively reduced. Also, in Fig. 1 (right bottom panel) we plot stress-strain curves obtained by Gu et al. gu08 in recent experiments with amorphous steel alloys of of Fe-Cr-Mo-P-C-B with different ductility produced by changing the metal-metalloid composition. The comparison illustrates how the index can parametrize in a simple manner the ductility of the experimental samples. Our results are also in excellent agreement with very recent experiments by Sun et al. sun10 on ductile metallic glasses showing the cycles of sudden stress drop followed by elastic reloading associated with shear-band motions.
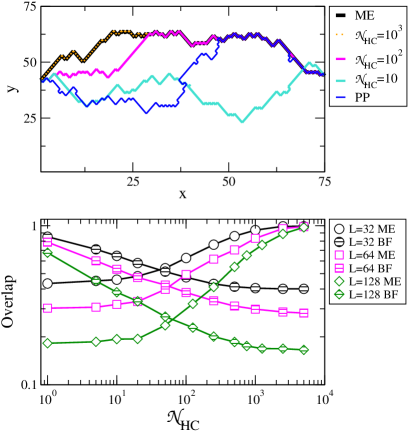
Figure 2 (top panels) shows the resulting fracture paths in the DRFM for the same conditions and disorder configuration as in the simulations shown in Fig. 1 (bottom left panel). One immediately notices that the final fracture surface configuration depends on the number of healing cycles and therefore on the accumulated plastic strain. These surfaces are to be compared with the ones emerging from the perfect plasticity limit () picallo09 . As a reference, we plot the minimum energy (ME) surface mid95 and the perfectly plastic (PP) path found with the algorithm of Roux and Hansen pp92 ; picallo09 for exactly the same disorder configuration. These two surfaces are known to minimize the sum of the local yield stresses and the stress flowing through the surface, respectively picallo09 . It becomes apparent that the deeper the system is allowed into the plastic steady-state (), the closer the resulting fracture surface is to the ME path for the same disorder configuration. We define the overlap between two given paths and as , where is a normalization constant so that the overlap becomes unity for two identical surfaces. One can see in Fig. 2 (top panel) that the fracture surface tends to overlap with the ME surface as the ductility increases. Also, in Fig. 2 (bottom panel) we plot the overlap between the plastic fracture surface obtained with the directed ME surface for the same disorder realization. For the sake of comparison, we also compute the overlap with the corresponding purely brittle fracture surface arcangelis85 for the same disorder realization (i.e., setting ). The PP surface seems to be irrelevant for this problem and, consequently, the overlap is negligible for all (not shown).
Figure 2 demonstrates that the system is quasi-brittle for low values of where the fracture surface largely overlaps with the purely brittle fracture surface. In contrast, if the material is allowed to accumulate locally more strain (i.e. for larger ) then the overlap with the brittle fracture rapidly decreases, while the path becomes progressively closer to the directed ME path. This is in agreement with the results reported in more complex models sor93a . Moreover, the finite- behavior of the overlap in Fig. 2, which decays as with system size in both (ME) and (quasi-brittle) limits.
Strain localization.-
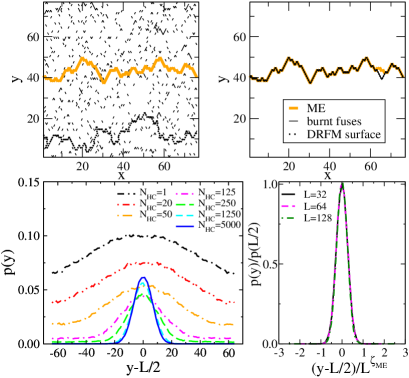
The dynamics of damage accumulation in the DRFM is summarized in Fig. 3. For quasi-brittle conditions, i.e. when we induce fracture after only a few healing cycles ( in the left top panel of Fig. 3), the damage in the form of broken bonds is spatially distributed throughout the sample in a randomly uniform fashion, in analogy to the brittle RFM. In contrast, a ductile sample can accumulate strain before any particular bond is broken. Right top panel in Fig. 3 shows how damage strongly localizes at the crack surface in a very ductile case with healing cycles, which corresponds to an average accumulated plastic strain of order per site. In this case, the crack strongly localizes very close to the ME surface. Eventually, the damage localizes exactly at the ME path as (for a finite but large in a finite sample, cf. Fig. 2)). In the DRFM the yield localization behaves originally randomly except that, due to stress enhancements, a degree of local “clustering” exists, and it increases slowly along the stress-strain curve until the final localization of damage and yielding as the fracture surface starts to be formed. Such a trend is analogous to what is seen in the brittle RFM for damage accumulation alava06 . This is interesting since such local plastic strains could be measured in experiments.
In the bottom panels of Fig. 3, we depict the spatial distributions of damage. The average damage profile is calculated from the fraction of broken bonds along the direction and is computed as , where the averaging is obtained by first shifting the damage profiles by the center of mass and then averaging over different samples nukala04 . The damage becomes narrower for larger , as the material is allowed to accumulate more local irreversible strain. Prior to the growth of the final crack, there appears to be only local correlations in the damage similarly in the brittle RFM nukala04 ; reurings05 , and the maxima in the profiles arise from the crack path. The bottom right panel of Fig. 3 shows the data collapse, , for the average profiles of accumulated damage for very ductile samples () with the local roughness exponent corresponding to ME. This quantifies how with an increased number of healing cycles fractures tend to only occur in the final crack surface, which progressively tends to the ME path. We also observe (not shown) that in the quasi-brittle limit damage is volume-like, as expected for RFM nukala04 , while in the extremely ductile case damage scales as , as the failing elements are located at the one-dimensional crack.
Avalanches of plastic events.-
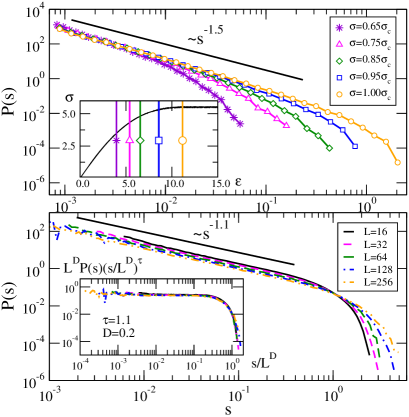
Indirect evidence by means of acoustic emission experiments miguel01 ; richeton06 ; wang09 , and very recent direct micro-compression measurements dimiduk06 ; schwer07 ; zaiser08 , have shown that strain bursts take place in the form of avalanches whose size distribution decays as a power-law with an exponent that lies within the range . On the other hand, theoretical arguments zaiser05 and simulations in dislocation models miguel01 ; zap07 ; miguel08 and amorphous materials sor93b suggest a universal exponent . We measured strain avalanches as the total strain occurred in the system between two external stress increments. In the DRFM the avalanche size is , which corresponds to the sum of the voltage sources added between two external voltage increments and is the number of fuses involved in the avalanche. Figure 4 (top panel) shows how the distribution of strain bursts for a sample of size evolves towards the yielding point. As it can be observed the cutoff increases as the stress reaches the critical point, with an exponent that approaches . This is excellent agreement with recent measurements of the distribution of shear avalanches in ductile metallic glasses sun10 . On the other hand, well above the yielding point the material response is fully plastic and we measure a different strain avalanche distribution in this plastic steady-state, i.e. when the strain has already become completely localized and the average response in the global stress-strain curve in Fig. 1 is constant. To do this we start to record statistics of strain avalanches well above the yielding point and obtain with and , where is a finite-size scaling function obtained by a data collapse for different system sizes (bottom panel, Fig. 4). corresponds to the plastic flow regime where the path of yielding sites effectively separates the system into two parts.
In summary, we have introduced a lattice model of elasto-plastic disordered materials which yield and finally fracture. The model exhibits a transition from purely brittle to fully ductile fracture, and includes both limits. A small accumulation of yield strain corresponds to quasi-brittle behavior. In contrast, as ductility is increased the resulting fracture paths gradually approach ME surfaces, and the damage decreases. The yielding process takes place in the form of avalanches of strain events that are found to be power-law distributed with an exponent , which is to be compared with experiments reporting miguel01 ; richeton06 ; wang09 ; dimiduk06 ; schwer07 ; zaiser08 ; sun10 and close to an earlier theoretical prediction, zaiser05 . Interestingly, the DRFM also allows us to investigate avalanche dynamics in the plastic steady-state regime [ where we found , consistent with plastic flow and unbounded strain events in response to the external loading. Future directions from here would include studying the DRFM in three dimensions, and adding strain-hardening to the non-linearly elastic part of the element response.
Acknowledgements.
We thank financial support from MICINN (Spain) through project No. FIS2009-12964-C05-05, the FPU program of MEC (Spain), ISI foundation (Italy), the Center of Excellence program of the Academy of Finland, and the European Commission through contract NEST-2005-PATH-COM-043386.References
- (1) A. L. Greer, Science 267, 1947 (1995).
- (2) Dynamic fracture mechanics, edited by A. Shukla (World Scientific, Singapore, 2006).
- (3) M. Buehler, Atomistic modeling of materials failure (Springer Science & Business Media, LLC, New York, 2008).
- (4) M. J. Alava, P. K. V. V. Nukala, and S. Zapperi, Adv. Phys. 55, 349 (2006).
- (5) S. Roux and A. Hansen, J. Phys. II (France) 2, 1007 (1992).
- (6) P. Miltenberger, D. Sornette, and C. Vanneste, Phys. Rev. Lett. 71, 3604 (1993).
- (7) P. A. Cowie, C. Vanneste, and D. Sornette, J. Geophys. Res. 98, 21809 (1993).
- (8) J.-C. Baret, D. Vandembroucq, and S. Roux, Phys. Rev. Lett. 89, 195506 (2002).
- (9) M. W. Lee, D. Sornette, and L. Knopoff, Phys. Rev. Lett. 83, 4219 (1999).
- (10) M.-C. Miguel et al., Nature 410, 667 (2001).
- (11) T. Richeton et al., Mater. Sci. Eng. A 424, 190 (2006).
- (12) G. Wang et al., Acta Mater. 57, 6146 (2009).
- (13) D. M. Dimiduk, C. Woodward, R. LeSar, and M. D. Uchic, Science 312, 1188 (2006).
- (14) J. Schwerdtfeger et al., J. Stat. Mech.: Theory Exp. 2007, L04001 (2007).
- (15) M. Zaiser et al., Phil. Mag. 88, 3861 (2008).
- (16) B. A. Sun, et al., Phys. Rev. Lett. 105, 035501 (2010).
- (17) Q.-K. Li and M. Li, Appl. Phys. Lett. 87, 031910 (2005).
- (18) Q.-K. Li and M. Li, Appl. Phys. Lett. 91, 231905 (2007).
- (19) J. H. Yao, J. Q. Wang, L. Lu, and Y. Li, Appl. Phys. Lett. 92, 041905 (2008).
- (20) P. Schall, D. A. Weitz, and F. Spaepen, Science 318, 1895 (2007).
- (21) C. B. Picallo, J. M. López, S. Zapperi, and M. J. Alava, Phys. Rev. Lett. 103, 225502 (2009).
- (22) L. de Arcangelis, S. Redner, and H. J. Herrmann, J. Phys. Lett. (Paris) 46, 585 (1985).
- (23) K. Ng, L. Zuo, and A. Ngan, Scripta Mater. 61, 955 (2009).
- (24) X. Gu, S. J. Poon, G. J. Shiflet, and M. Widom, Acta Materialia 56, 88 (2008).
- (25) A. A. Middleton, Phys. Rev. E 52, R3337 (1995).
- (26) P. K. V. V. Nukala, S. Šimunović, and S. Zapperi, J. Stat. Mech.: Theory Exp. 2004, 08001 (2004).
- (27) F. Reurings and M. J. Alava, Eur. Phys. J. B 47, 85 (2005).
- (28) M. Zaiser and P. Moretti, J. Stat. Mech.: Theory Exp. 2005, P08004 (2005).
- (29) F. F. Csikor et al., Science 318, 251 (2007).
- (30) M.-C. Miguel, L. Laurson, and M. J. Alava, Eur. Phys. J. B 64, 443 (2008).