Electrical and magnetic properties of the complete solid solution series between SrRuO3 and LaRhO3: Filling versus tilting
Abstract
A complete solid solution series between the perovskite ferromagnet SrRuO3 and the diamagnetic perovskite LaRhO3 has been prepared. The evolution with composition in (SrRuO3)1-x(LaRhO3)x of the crystal structure and electrical and magnetic properties has been studied and is reported here. As increases, the octahedral tilt angle gradually increases, along with the psuedocubic lattice parameter and unit cell volume. Electrical resistivity measurements reveal a compositionally driven metal to insulator transition between = 0.1 and 0.2. Ferromagnetic ordering gives over to glassy magnetism for and no magnetic ordering is found above 2 K for . and decrease with increasing and remain constant after = 0.5. The magnetism appears poised between localized and itinerant behavior, and becomes more localized with increasing as evidenced by the evolution of the Rhodes-Wohlfarth ratio. per Ru is equal to the quenched spin-only value across the entire solid solution. Comparisons with Sr1-xCaxRuO3 reinforce the important role of structural distortions in determining magnetic ground state. It is suggested that electrical transport and magnetic properties are not strongly coupled in this system.
I Introduction
SrRuO3 is a 4 () transition metal oxide crystallizing in the orthorhombic ABO3 perovskite structure.Randall and Ward (1959); Callaghan et al. (1966); Longo et al. (1968) Unusually for a 4 transition metal oxide, SrRuO3 exhibits ferromagnetic ordering below its Curie temperature of 160 K. This is in contrast to other 4 perovskites such as (Ca,Sr,Ba)MoO3 whose metal – O conduction bands are too disperse to stabilize magnetic ordering. Closely related CaRuO3 is, in contrast to SrRuO3, a paramagnetic metal while BaRuO3 orders ferromagnetically at a lower of 60 K.Longo et al. (1968); Jin et al. (2008) Recent renewed interest in SrRuO3 has origins in the unusual negative spin polarization, as determined from tunneling measurements,Worledge and Geballe (2000) that enables multilayer devices with inverted magnetoresistance behavior by combination with materials exhibiting the more usual positive spin polarization.Takahashi et al. (2003) The nature of magnetism in SrRuO3, localized versus itinerant, continues to be examined using chemical substitution as a probe.Jin et al. (2008) Additionally, as SrRuO3 is a commonly used electrode material in heteroepitaxial perovskite architectures, recent attention has been paid to the thickness-dependence of properties.Toyota et al. (2005); Chang et al. (2009)
Jones et al.Jones et al. (1989) performed room temperature neutron diffraction studies studies to determine the structure of SrRuO3 while Bushemeleva et al.Bushmeleva et al. (2006) performed low temperature experiments and obtained a magnetic moment per Ru atom of 1.630.06 at 10 K. They also explained a previously observed Invar effectKiyama et al. (1996) of the lattice parameters and below below as deriving from the freezing of RuO6 octahedra tilting and rotation. Additionally, a very slight Jahn-Teller distortion, 40 times smaller than in LaMnO3, was noted.Bushmeleva et al. (2006)
The reported Invar effect in SrRuO3 is indicative of itinerancy as it also occurs in 3 transition metal itinerant ferromagnets such as Fe-Ni alloys.Kiyama et al. (1996) Values from heat capacity, and ,Allen et al. (1996); Castelpoggi et al. (1997) and the NMR relaxation rate 1/Yoshimura et al. (1999) are all lower than the values expected from the localized spin model. Many electronic structure calculations predict band ferromagnetism with a reduced non-integer moment and this is consistent with the precise moment value extracted from low temperature neutron scattering experiments. Additionally, the linearity of the Arrot plot for small predicted for itinerant magnets is observed in SrRuO3.Kiyama et al. (1999)
Extensive computational investigations of the magnetism and electronic structure of SrRuO3 and its behavior in solid solutions have been carried out.Mazin and Singh (1997); Santi and Jarlborg (1997); Rondinelli et al. (2008) Despite its itinerant nature, Mazin and Singh emphasize the importance of structural distortion in SrRuO3 which changes the Ru–O–Ru bond angle and affects ferromagnetic coupling.Mazin and Singh (1997) A large peak is seen in the density of electronic states at the Fermi level which supports magnetic ordering via the Stoner criterion.Stoner (1938) In the more distorted CaRuO3 the density of states is not as strongly peaked, and it therefore displays no magnetic order but is believed to be on the verge of a ferromagnetic instability. Other LSDA studies of SrRuO3 and CaRuO3 by Santi et al. show both to be ferromagnetic.Santi and Jarlborg (1997) Rondinelli et al. find that their computed electronic structure of SrRuO3 agrees better with experimental spectroscopic data when moderate electron correlations are included through a 0.6 eV on-site Hubbard term.Rondinelli et al. (2008) Maiti and Singh fit photoemission data and find a small of 0.2 for both CaRuO3 and SrRuO3 which similarly suggests these compounds are not significantly correlated.Maiti and Singh (2005) Calculations comparing ideal cubic structures and real distorted structures reveal the important role of A–O covalency and Ru–O–Ru bond angle.Maiti (2006)
In recent work on SrRuO3 solid solutions, Mamchik et al. investigated substitution by antiferromagnetic LaFeO3Mamchik and Chen (2004) and LaCoO3.Mamchik et al. (2004) In both cases, a spin glass forms upon substitution and a gradual metal-insulator transition is suggested to occur by Anderson localization. Additionally, large switchable local moments are formed around the substituted B-site (Fe or Co) due to the spin polarization of the itinerant electrons in SrRuO3. An analogy with 3 transition metal impurities in Pd has been suggested and correspondingly, and large negative magnetoresistance is reported. Pb substitution has been attempted on both the A and B sites with mixed results. Cao et al. perform substitution, ostensibly on the B site, and report an increase in to 210 K.Cao et al. (1996) Cheng et al. on the other hand, replace Sr with Pb on the A site and observe a reduction in with no magnetic ordering for = 0.6 or higher.Cheng et al. (2010) The effect of structural distortion on the magnetism of SrRuO3 has been of great interest for the past 50 years. Most simply accomplished by isovalent substitution on the A site, replacement of Sr by both Ca and Ba has been investigated. Sr1-xCaxRuO3 has been the subject of a sizable number of experimental on both single crystals and polycrystalline samples, and through computational studies. However, the results are somewhat varied.Kanbayasi (1978); Fukunaga and Tsuda (1994); Cao et al. (1997a); Kiyama et al. (1998); Yoshimura et al. (1999); He et al. (2000); Jin et al. (2008); Longo et al. (1968); Kiyama et al. (1996); Mukuda et al. (1999); Cao et al. (2008) Specifically, there are reports of glassy magnetic ordering persisting to = 0.95,Cao et al. (1997a) while most studies seem to agree on a value of = 0.7, beyond which no magnetic ordering is observed. Ba substitution, on the other hand, is harder to perform as high pressure is required to stabilize BaRuO3 in the perovskite phase. Recently, the entire solid solution series ARuO3 (A = Ca, Sr, Ba) was studied by Jin et al.Jin et al. (2008) These authors report that the Curie temperature decreases with substitution of either Ca or Ba, and they attribute this to many competing effects, including changes in octahedral tilting and rotation, Jahn-Teller distortions, and covalence. With Ba substitution, suppression is explained by band broadening. In the case of Ca substitution, these authors report the formation of a Griffiths phases, characterized by some signature in the paramagnetic susceptibility at the ordering temperature of the parent phase, , due to local clusters of the ferromagnet persisting in the dilute system.Griffiths (1969); Bray (1987) Kiyama et al. have also suggested that Sr2+ clustering occurs in Sr1-xCaxRuO3 but do not report signals in the susceptibility at .Kanbayasi (1978) Additionally, they found that long range magnetic ordering persists through = 0.7.Kiyama et al. (1999)
In this contribution, we investigate (SrRuO3)1-x(LaRhO3)x, a solid solution between SrRuO3 and the perovskite LaRhO3 which has low-spin, diamagnetic Rh3+.Wold et al. (1957); Nakamura et al. (1993); Mary and Varadaraju (1994) Aliovalent substitution on both the A and B sites of the ABO3 perovskite compensates Ru4+ being replaced by Rh3+ with the concomitant substitution of Sr2+ by La3+. The principle electronic effect anticipated by such substitution, at least in a band picture, would be the gradual filling of levels on the B site, starting with SrRuO3 at = 0, and ending with SrRuO3 at = 1. While SrRuO3 has been substituted by many different ions as described above, this is the first time substitution by a diamagnetic semiconductor has been attempted. The only example of Rh-substitution is from Cao et al.Cao et al. (1997b) who have substituted Rh (ostensibly Rh4+) for Ru in CaRuO3 and found that it stabilized magnetic ordering. The results presented here shed important light on the nature of magnetism in SrRuO3. Itinerant behavior becomes more localized with substitution by a semiconductor as evidenced by the evolution of the Rhodes-Wohlfarth ratioRhodes and Wohlfarth (1963) with in (SrRuO3)1-x(LaRhO3)x. Additionally, despite the occurrence of a compositionally driven metal-insulator transition, ferromagnetism persists, with behavior turning glassy as increases. Curie-Weiss analysis reveals that decreases with LaRhO3 substitution and is equal to for low valuies of , while per Ru4+ is equal to the spin-only value across the solid solution. Interestingly, we find that the ferromagnetism of SrRuO3 is disrupted only slightly more quickly by LaRhO3 substitution than it is with isovalent replacement of Sr by Ca. This suggests that increased octahedral tilting is almost as detrimental to ferromagnetism as is filling , and reinforces prior studies that emphasize the significance of structural distortion.
II Methods
Polycrystalline (SrRuO3)1-x(LaRhO3)x pellets were prepared using solid state reactions at high temperatures. Stoichiometric amounts of SrCO3, La2O3, RuO2, and Rh2O3 were ground with an agate mortar and pestle, pressed at 100 MPa, and fired in air, first at 1000∘C for 24 h and then between 1200∘C and 1400∘ for 96 h with intermediate grindings in accordance with previous preparations of SrRuO3Randall and Ward (1959) and LaRhO3Wold et al. (1957). The pellets were placed on beds of powders of the same composition to avoid contamination with crucible constituents. The phase purity of all samples was confirmed by laboratory x-ray diffraction on a Philips X’Pert diffractometer with Cu- radiation. Select samples were also examined by high resolution synchrotron powder x-ray diffraction at the 11-BM beamline at the Advanced Photon Source, Argonne National Laboratory. RietveldRietveld (1969) refinement was performed using the XND Rietveld code.Bérar and Baldinozzi (1998) Crystal structures were visualized using VESTA.Momma and Izumi (2008) Electrical resistivity measurements were carried out using the 4-point probe method on sintered pellets with silver epoxy electrical contacts using a Quantum Design PPMS, and separately using Keithley current sources and meters and a closed-cycle He refrigerator. Magnetic properties were measured using a Quantum Design MPMS 5XL SQUID magnetometer and the ACMS option in a PPMS.
III Results and Discussion
III.1 Structure
| 0.0 | 0.1 | 0.2 | 0.3 | 0.4 | 0.5 | 0.6 | 0.8 | 0.9 | 1.0 | |
|---|---|---|---|---|---|---|---|---|---|---|
| (Å) | 5.534(0) | 5.543(2) | 5.548(4) | 5.558(0) | 5.570(4) | 5.584(9) | 5.597(0) | 5.641(9) | 5.666(6) | 5.687(8) |
| (Å) | 7.850(3) | 7.857(5) | 7.869(2) | 7.876(8) | 7.884(7) | 7.892(2) | 7.895(7) | 7.900(9) | 7.899(6) | 7.902(0) |
| (Å) | 5.571(6) | 5.574(0) | 5.581(8) | 5.582(8) | 5.582(4) | 5.581(4) | 5.577(8) | 5.557(9) | 5.542(1) | 5.533(2) |
| (Å3) | 242.0(5) | 242.7(8) | 243.7(1) | 244.4(1) | 245.1(9) | 246.0(1) | 246.5(0) | 247.7(5) | 248.0(8) | 248.7(0) |
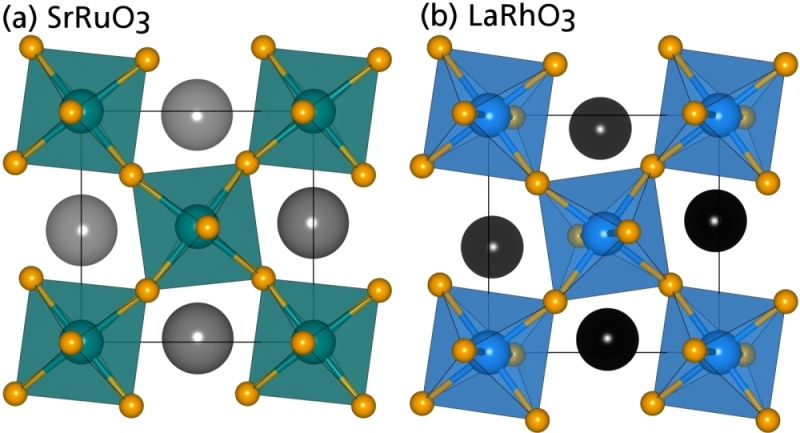
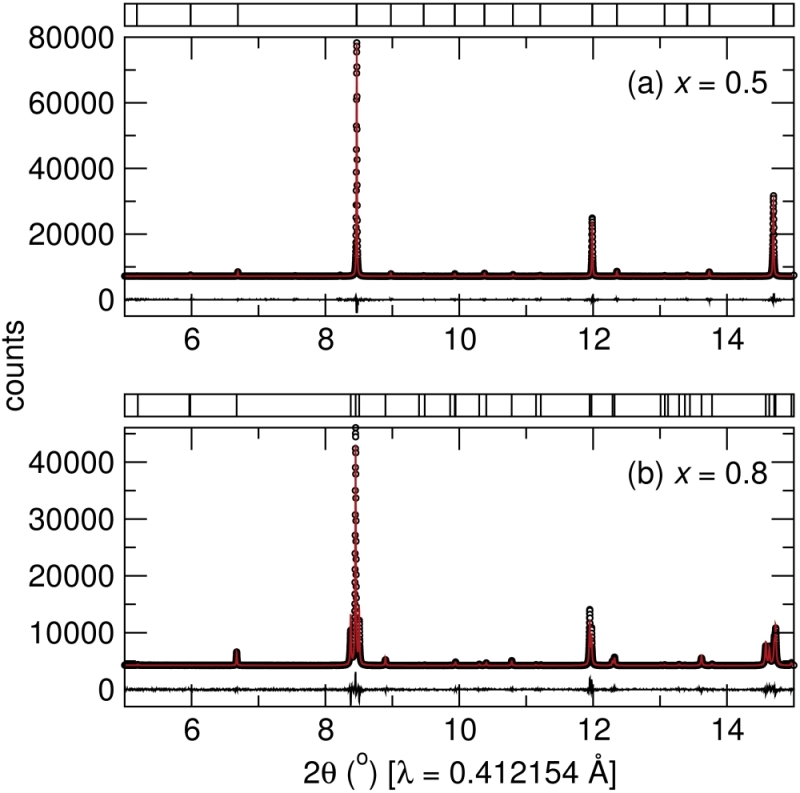
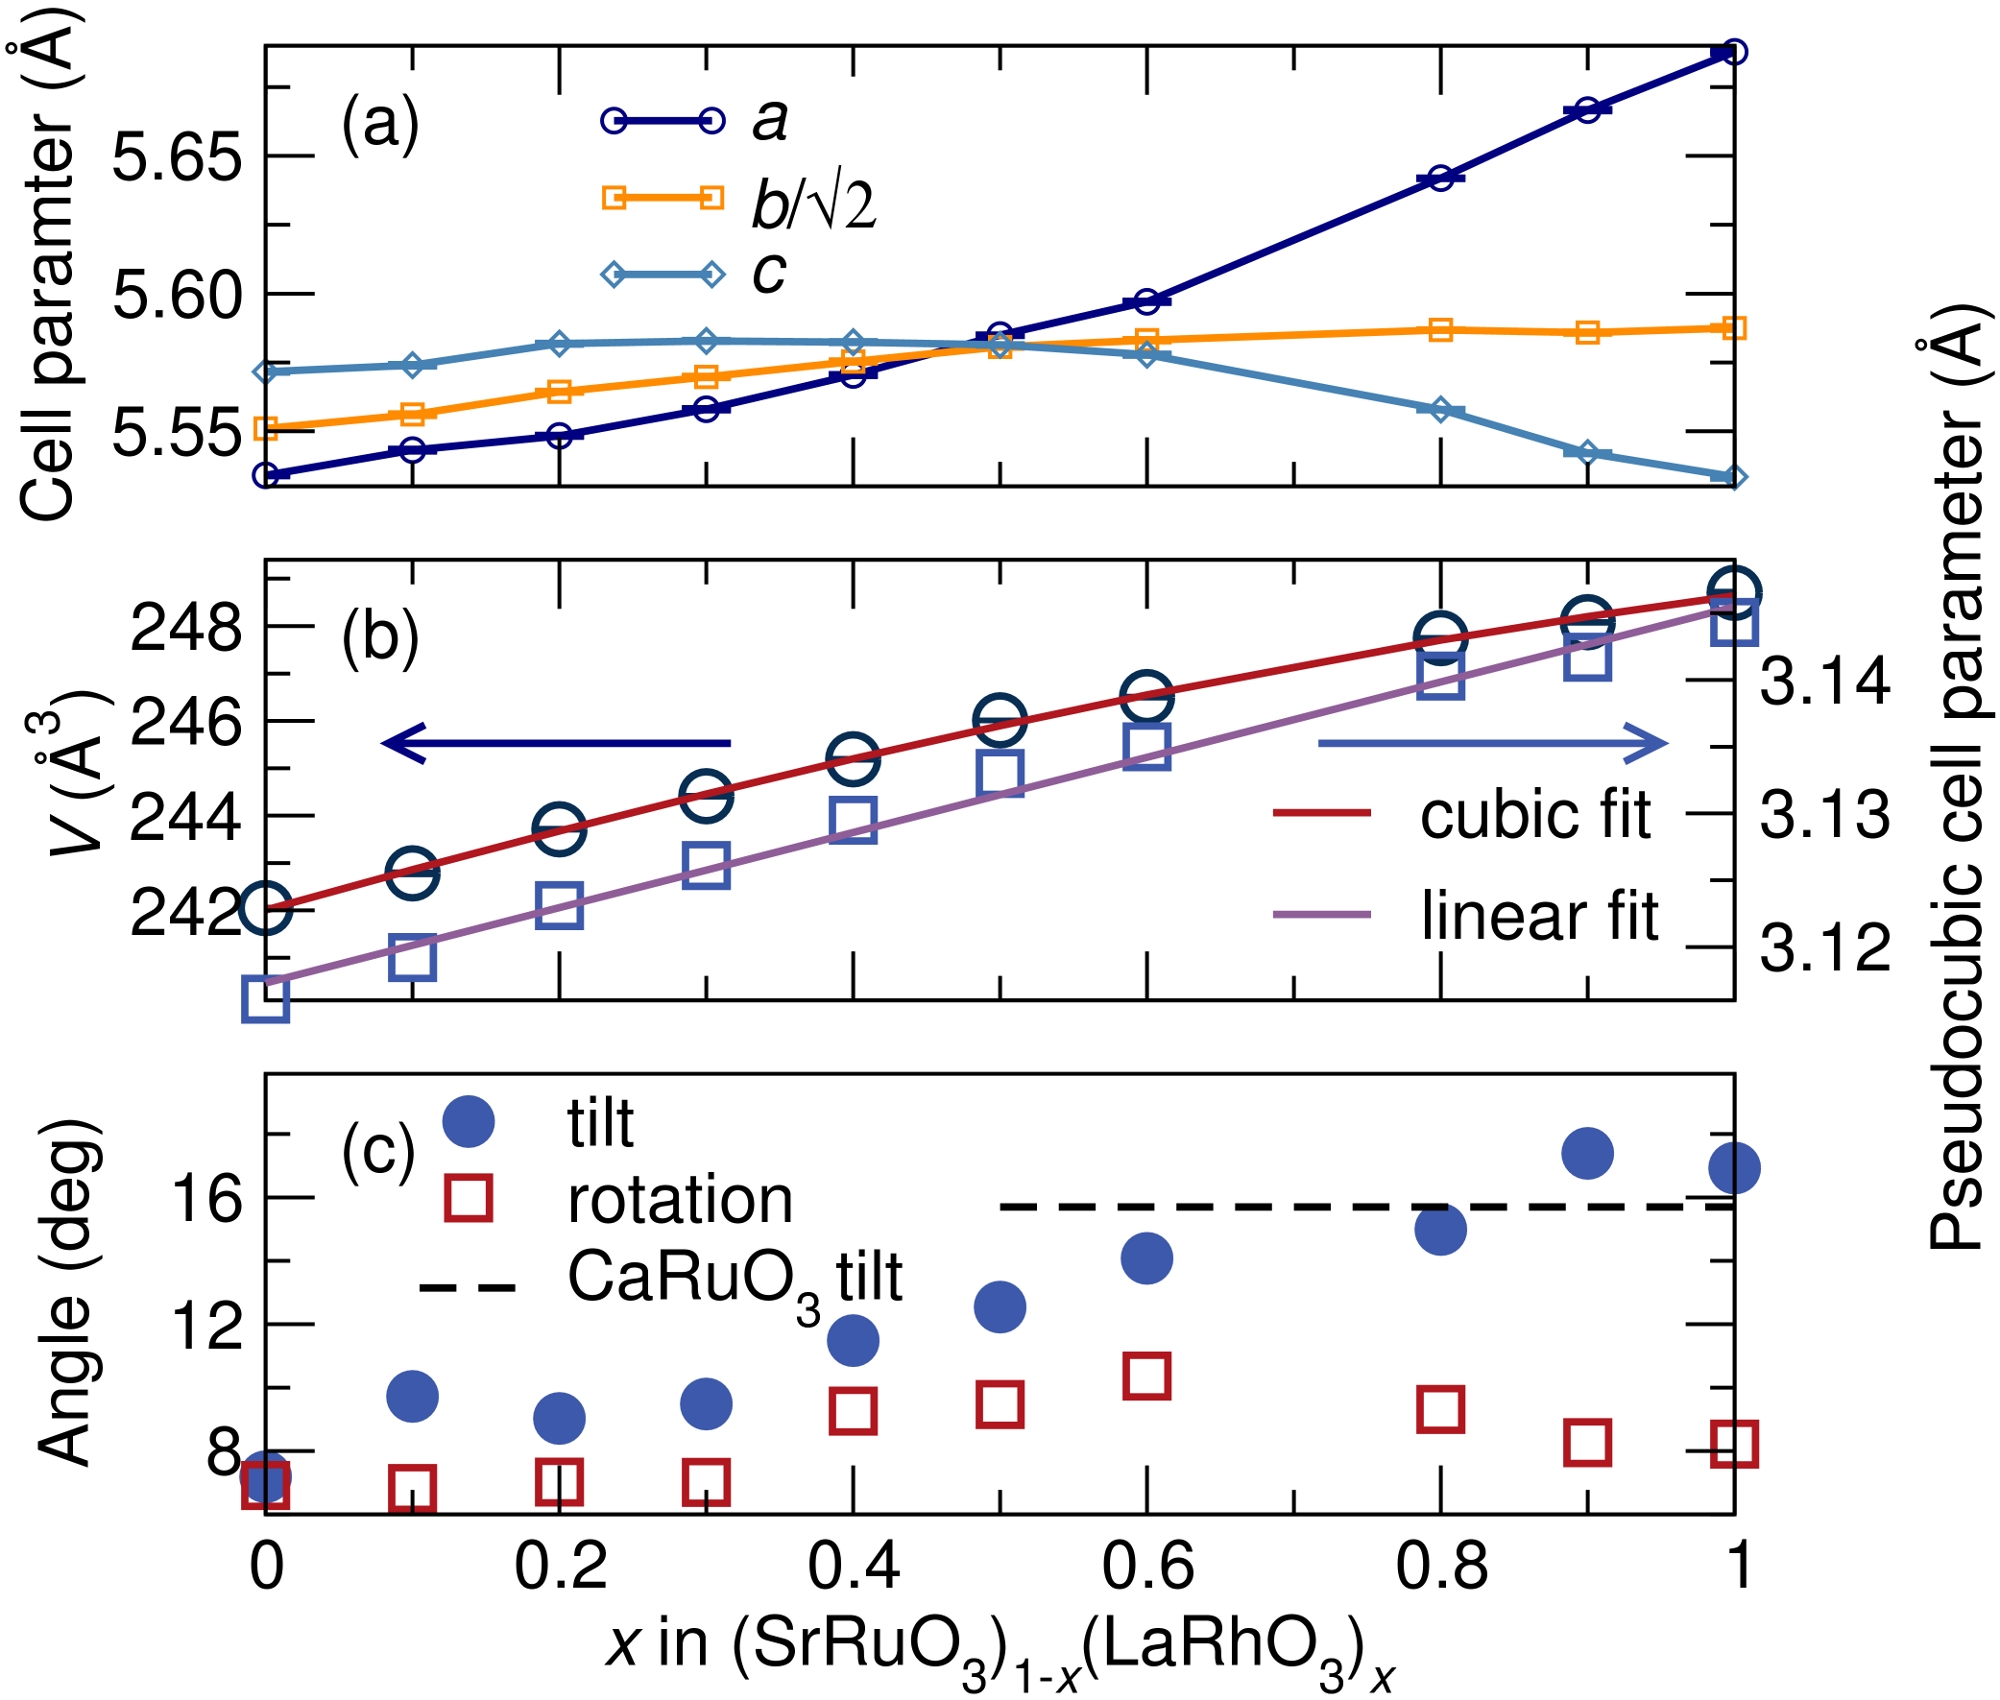
The crystal structures of SrRuO3 and LaRhO3 as determined by Rietveld refinement of powder XRD data are depicted in FIG. 1. Both end-member compounds crystallize in the orthorhombic perovskite crystal structure, space group (No. 62), with the latter showing a greater degree of octahedral tilting. Powder XRD shows the single phase nature of the entire solid solution as all observable peaks are expected from the structure. Upon LaRhO3 substitution, many of the peaks display enhanced splitting due to increased orthorhombic distortion. Figure 2 shows high resolution synchrotron powder x-ray diffraction data and Rietveld refinement for the = 0.5 and 0.8 samples. The high quality data further confirm the single phase nature of the materials and refined La/Sr ratios agree well with stoichiometry. The refined cell parameters and unit cell volume are presented in Table 1. The composition dependence of structural parameters is shown in FIG. 3. The individual cell parameters do not follow the Végard law due to the effect of octahedral rotations and tilts. Instead, the unit cell volume and psuedocubic cell parameter follow the Végard law as evidenced by the cubic and linear fits to the data. The observation that the Végard law is obeyed across the solid solution strongly suggests that there is no change in the oxidation states of the transition metal ions Ru4+ or Rh3+ as changes in the solid solution. The bottom panel, FIG. 3(c), displays the average octahedral tilt angle as a function of composition. It is seen that octahedral tilting increases with LaRhO3 substitution as expected based on the larger A-cation charge and therefore the smaller tolerance factor:Goldschmidt (1926) is 0.994 for SrRuO3 and = 0.945 for LaRhO3 using Shannon-PrewittShannon and Prewitt (1969) effective ionic radii. The perovskite tilt and rotation systems are described by Glazer, with belonging to the tilt system.Glazer (1972) For comparison to (SrRuO3)1-x(LaRhO3)x, the tilt angle of CaRuO3, which is nearly the same magnitude as in LaRhO3, is displayed as a horizontal dashed line. Since Ca substitution on the Sr site of SrRuO3 significantly influences properties, the analogous tilting in the SrRuO3–LaRhO3 solid solution is expected to have a similar effect and be an important ingredient to understanding physical properties.
III.2 Electrical transport
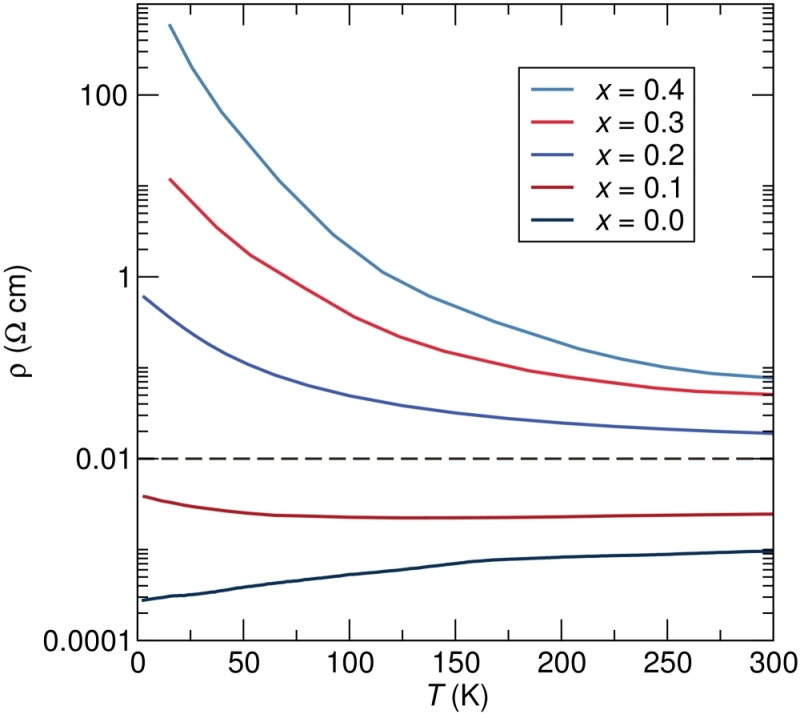
DC electrical resistivity measurements were performed across the solid solution series as presented in FIG. 4. SrRuO3 is a metal, exhibiting a positive temperature coefficient of resistivity, and has a resistivity near 10-3 cm at 300 K. Its resistivity displays a kink at the ferromagnetic due to a change in the magnetic scattering of conduction electrons. The = 0.1 sample has a small upturn in resistivity below 125 K which is characteristic of weak localization. A compositionally driven metal-to-insulator transition is observed between = 0.1 and 0.2 where at room temperature becomes greater than the Mott maximum metallic resistivity of cm. For 0.2 the temperature coefficient of resistivity is always negative.
III.3 Magnetism
| 0.0 | 0.1 | 0.2 | 0.3 | 0.4 | 0.5 | 0.6 | 0.8 | 0.9 | |
|---|---|---|---|---|---|---|---|---|---|
| (K) | 160 | 100 | 50 | 24 | 16 | 9 | |||
| (K) | 167 | 111 | 69.4 | 47.4 | 11.2 | 29.4 | 42.6 | 42.5 | 43.2 |
| (/Ru) | 2.96 | 2.77 | 2.76 | 2.77 | 2.82 | 3.00 | 3.00 | 3.02 | 3.05 |
| (/Ru) | 1.40 | 1.13 | 0.963 | 0.730 | 0.358 | 0.276 | 0.241 | 0.251 | 0.356 |
Key magnetic data characterizing the solid solution, as determined through analysis of the temperature-dependent magnetic susceptibility, including Curie-Weiss analysis, and measurement of vs. at 2 K, and are presented in Table 2. Curie-Weiss analysis included a temperature independent term for capturing the diagmagnetism of the sample and sample holder background. The value of this parameter was negative and small (10-5 emu/mol) for all fits, as expected for diamagnetism, though no trend in its value was observed.
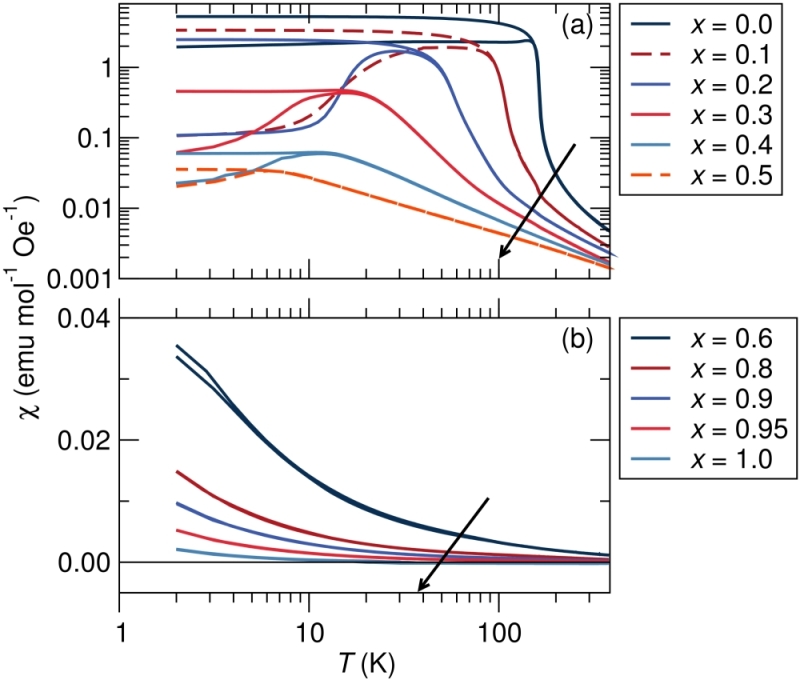
Zero-field cooled (ZFC) and field-cooled (FC) magnetic susceptibility data were collected as a function function of temperature under a DC field of 1000 Oe. The data are displayed in FIG. 5, with the low-temperature branches in each set of measurements corresponding to the ZFC data. We confirm that the of SrRuO3 is approximately 160 K as evidenced by the sharp upturn in susceptibility at that temperature. The Curie temperature decreases with LaRhO3 substitution and the ordering transition broadens in temperature. For 0.5 the system no longer orders and instead has local moment paramagnetic behavior, although the sample with = 0.6 does display distinct ZFC and FC traces at very low temperatures. A slight rise in for the = 0.1 sample occurs at 160 K. Although no evidence is seen in the laboratory XRD data, we attribute this to a very small impurity of SrRuO3 based on the ordering temperature, and this persists despite continued regrinding, repelletization, and reheating during the preparation procedure. This deviation in susceptibility may be interpreted as Griffiths phase behavior, although we find it more consistent with incomplete reaction and sample inhomogeneity. The system remains ferromagnetic until = 0.3 where it begins to display the formation of glassy states as observed by the susceptibility reaching a maximum, decreasing, and leveling off to a constant value. Contrary to previous reports,Nakamura et al. (1993); Mary and Varadaraju (1994) the end-member LaRhO3 is found to display diamagnetic behavior with negative susceptibility until low temperatures (10 K) at which point paramagnetic impurities or defects become dominant. The absence of diamagnetic behavior in the previous reports was attributed to the presence of small amounts of Rh4+ occurring due to impurities or defects.
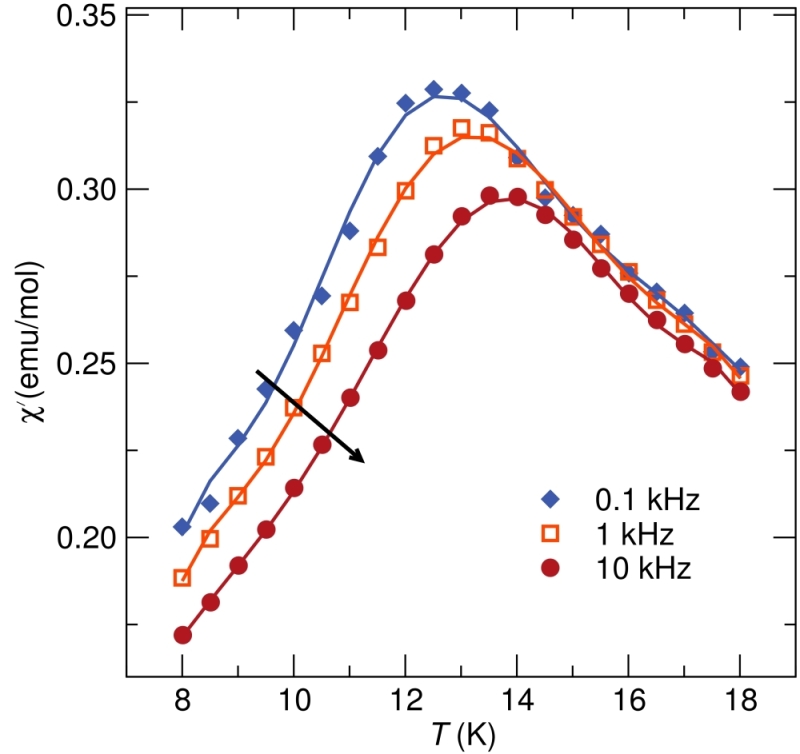
To verify the glassy state of the = 0.3 sample, we conducted frequency-dependent AC magnetic susceptibility measurements, as displayed in FIG. 6. The dispersion in the peak susceptibility as a function of the frequency of the AC field is characteristic of glassy magnetism. While not shown, no such frequency dependence of magnetic ordering was seen in the = 0.1 sample.
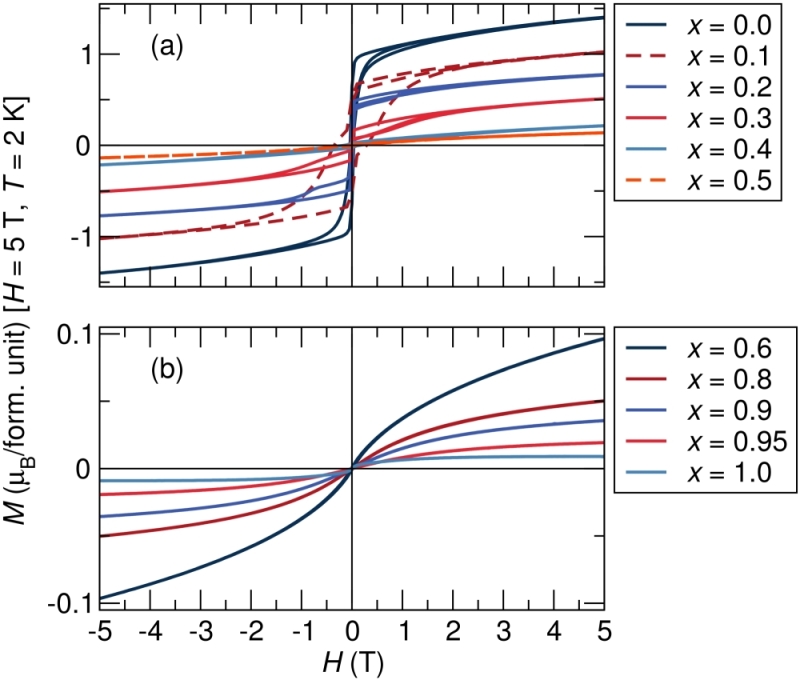
The dependence of magnetization on field for (SrRuO3)1-x(LaRhO3)x at 2 K is shown in FIG. 7. Hysteresis associated with domain behavior is observed for 0.5. is defined as the magnetization at 2 K and 5 T, however none of the samples reach saturation. Sharp discontinuities in magnetization, attributed to powder crystallite rotation under a magnetic field, prevent an analysis of coercivity as a function of substitution.
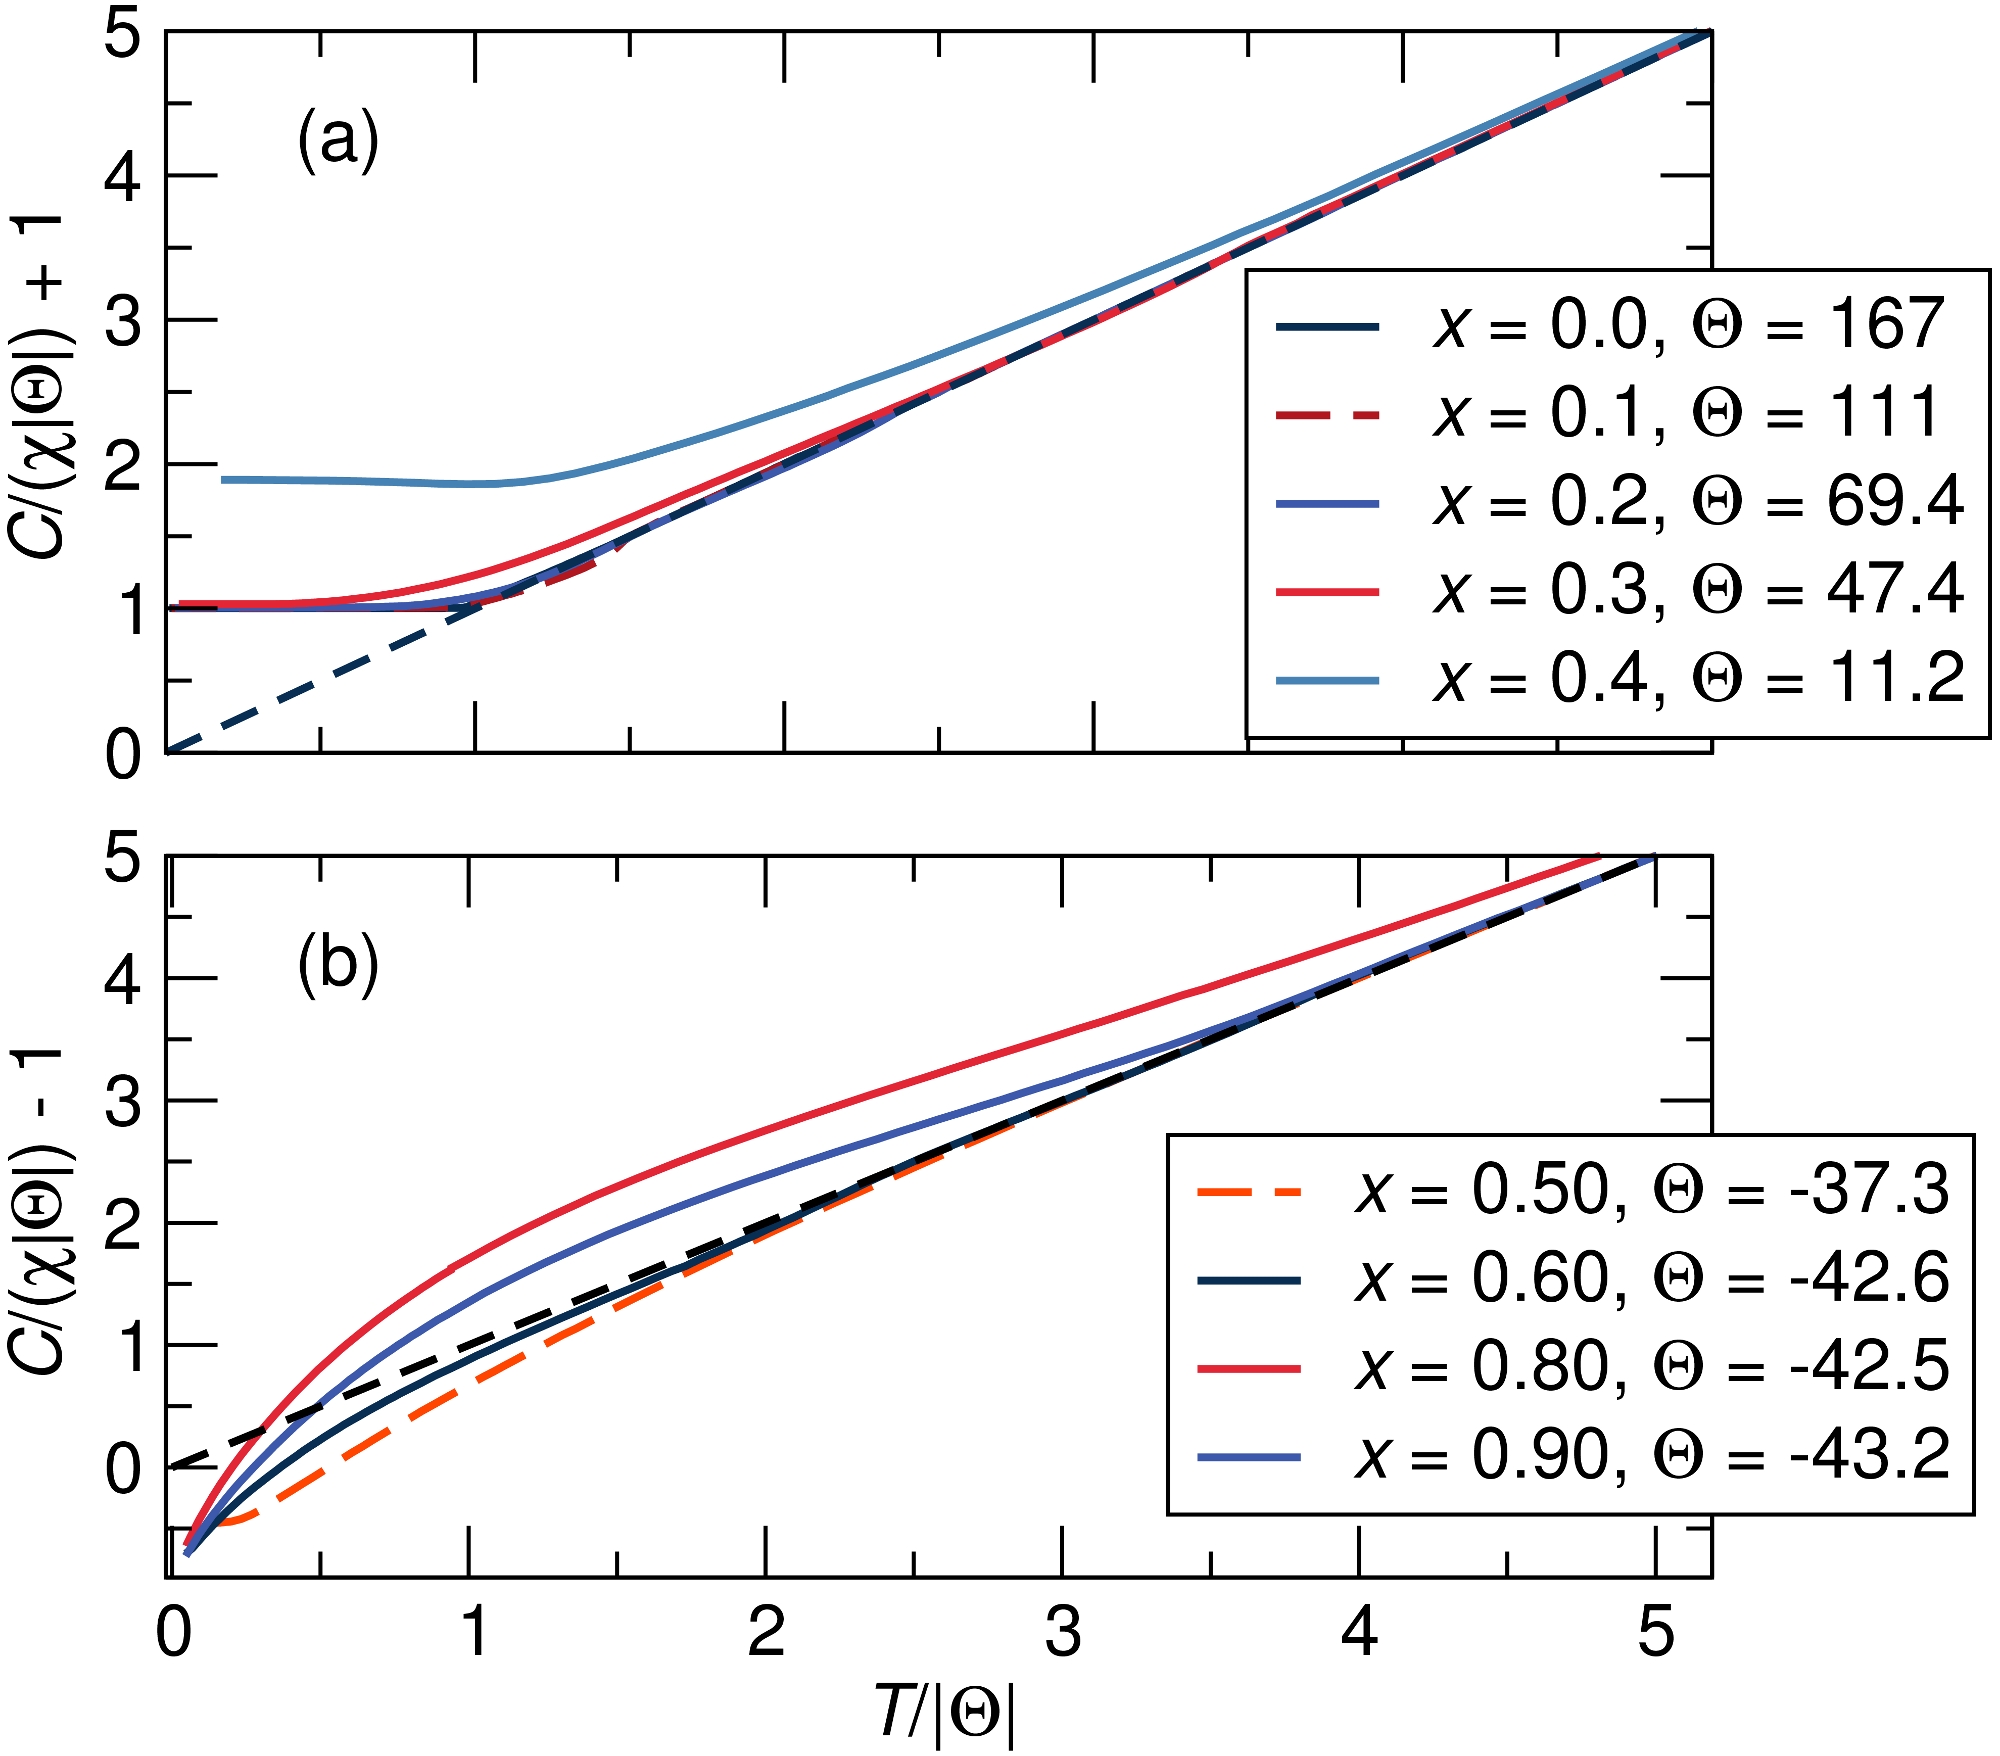
The Curie-Weiss relation can be recast according to:
| (1) |
which allows normalization of susceptibility-temperature plots as shown in FIG. 8. The utility of such plots has been amply demonstrated in the analysis of other solid-solution systems.Melot et al. (2009) For example, the scaled temperature axis allows the frustration index defined to be directly read off. It is seen that all five SrRuO3-rich samples in the FIG. 8(a) order at temperatures corresponding to suggesting that they obey expectations from the Curie-Weiss relationship rather well. At temperatures above the ordering temperature, positive deviations from the ideal Curie-Weiss line reflect the presence of compensated antiferromagnetic short range interactions, while negative deviations reflect uncompensated interactions (ferromagnetism or ferrimagnetism). The ferromagnetic samples ( = 0.0, 0.1, and 0.2) all deviate from ideal Curie-Weiss behavior at their and thus nearly all lie on top of one another on the normalized plot. In contrast, the glassy samples ( = 0.3, 0.4, and 0.5) deviate significantly above their . The positive deviation is however difficult to understand, and may have something to do with the nature of the local moments, associated with orbital degeneracy on Ru4+. Note that plots for may be difficult to interpret due to having near zero. In FIG. 8(b) samples on the LaRhO3-rich side also display deviations from Curie-Weiss behavior. For larger values of the majority of interactions become Ru-O-Rh and takes on a small negative value. At low temperatures, the deviations are below the Curie-Weiss line, suggesting that they are not fully compensated, as would be expected for a random alloy.
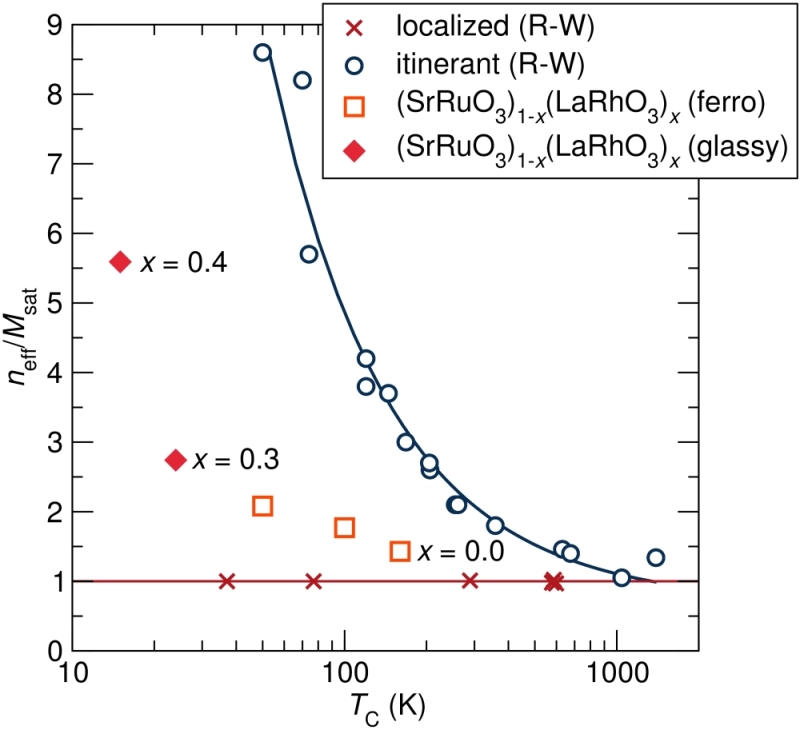
The fact that the (SrRuO3)1-x(LaRhO3)x samples with follow Curie-Weiss behavior should not by itself be taken as evidence for local-moment behavior.Takahashi (1986) Instead we employ the Rhodes-Wohlfarth ratio, to probe the degree of local-moment versus itinerant electron behavior in this solid solution series.Rhodes and Wohlfarth (1963) Here is the number of unpaired electrons obtained from analysis of the , and for the region of interest, is simply . We find a ratio of 1.43 for SrRuO3, using and determined here, which is larger than previous reports of 1.3 by Fukunaga et al.Fukunaga and Tsuda (1994) A ratio of 1.23 is obtained if one uses the spin only of 2 for Ru4+ and the value of 1.63 as found by Bushmeleva et al.Bushmeleva et al. (2006) from low-temperature neutron diffraction. FIG. 9 displays the ratio as a function of for (SrRuO3)1-x(LaRhO3)x along with data for other well studied systems. We find (SrRuO3)1-x(LaRhO3)x to behave intermediate between itinerant and localized for all compositions with magnetic ordering. / deviates further from itinerant behavior and closer to localized behavior with increased LaRhO3 substitution. This is expected as there are fewer free carriers as the sample becomes more insulating. It is notable that there is no sharp jump in the ratio at the compositionally driven metal-insulator transition between = 0.1 and 0.2. The trend with substitution is disrupted as the system turns glassy.
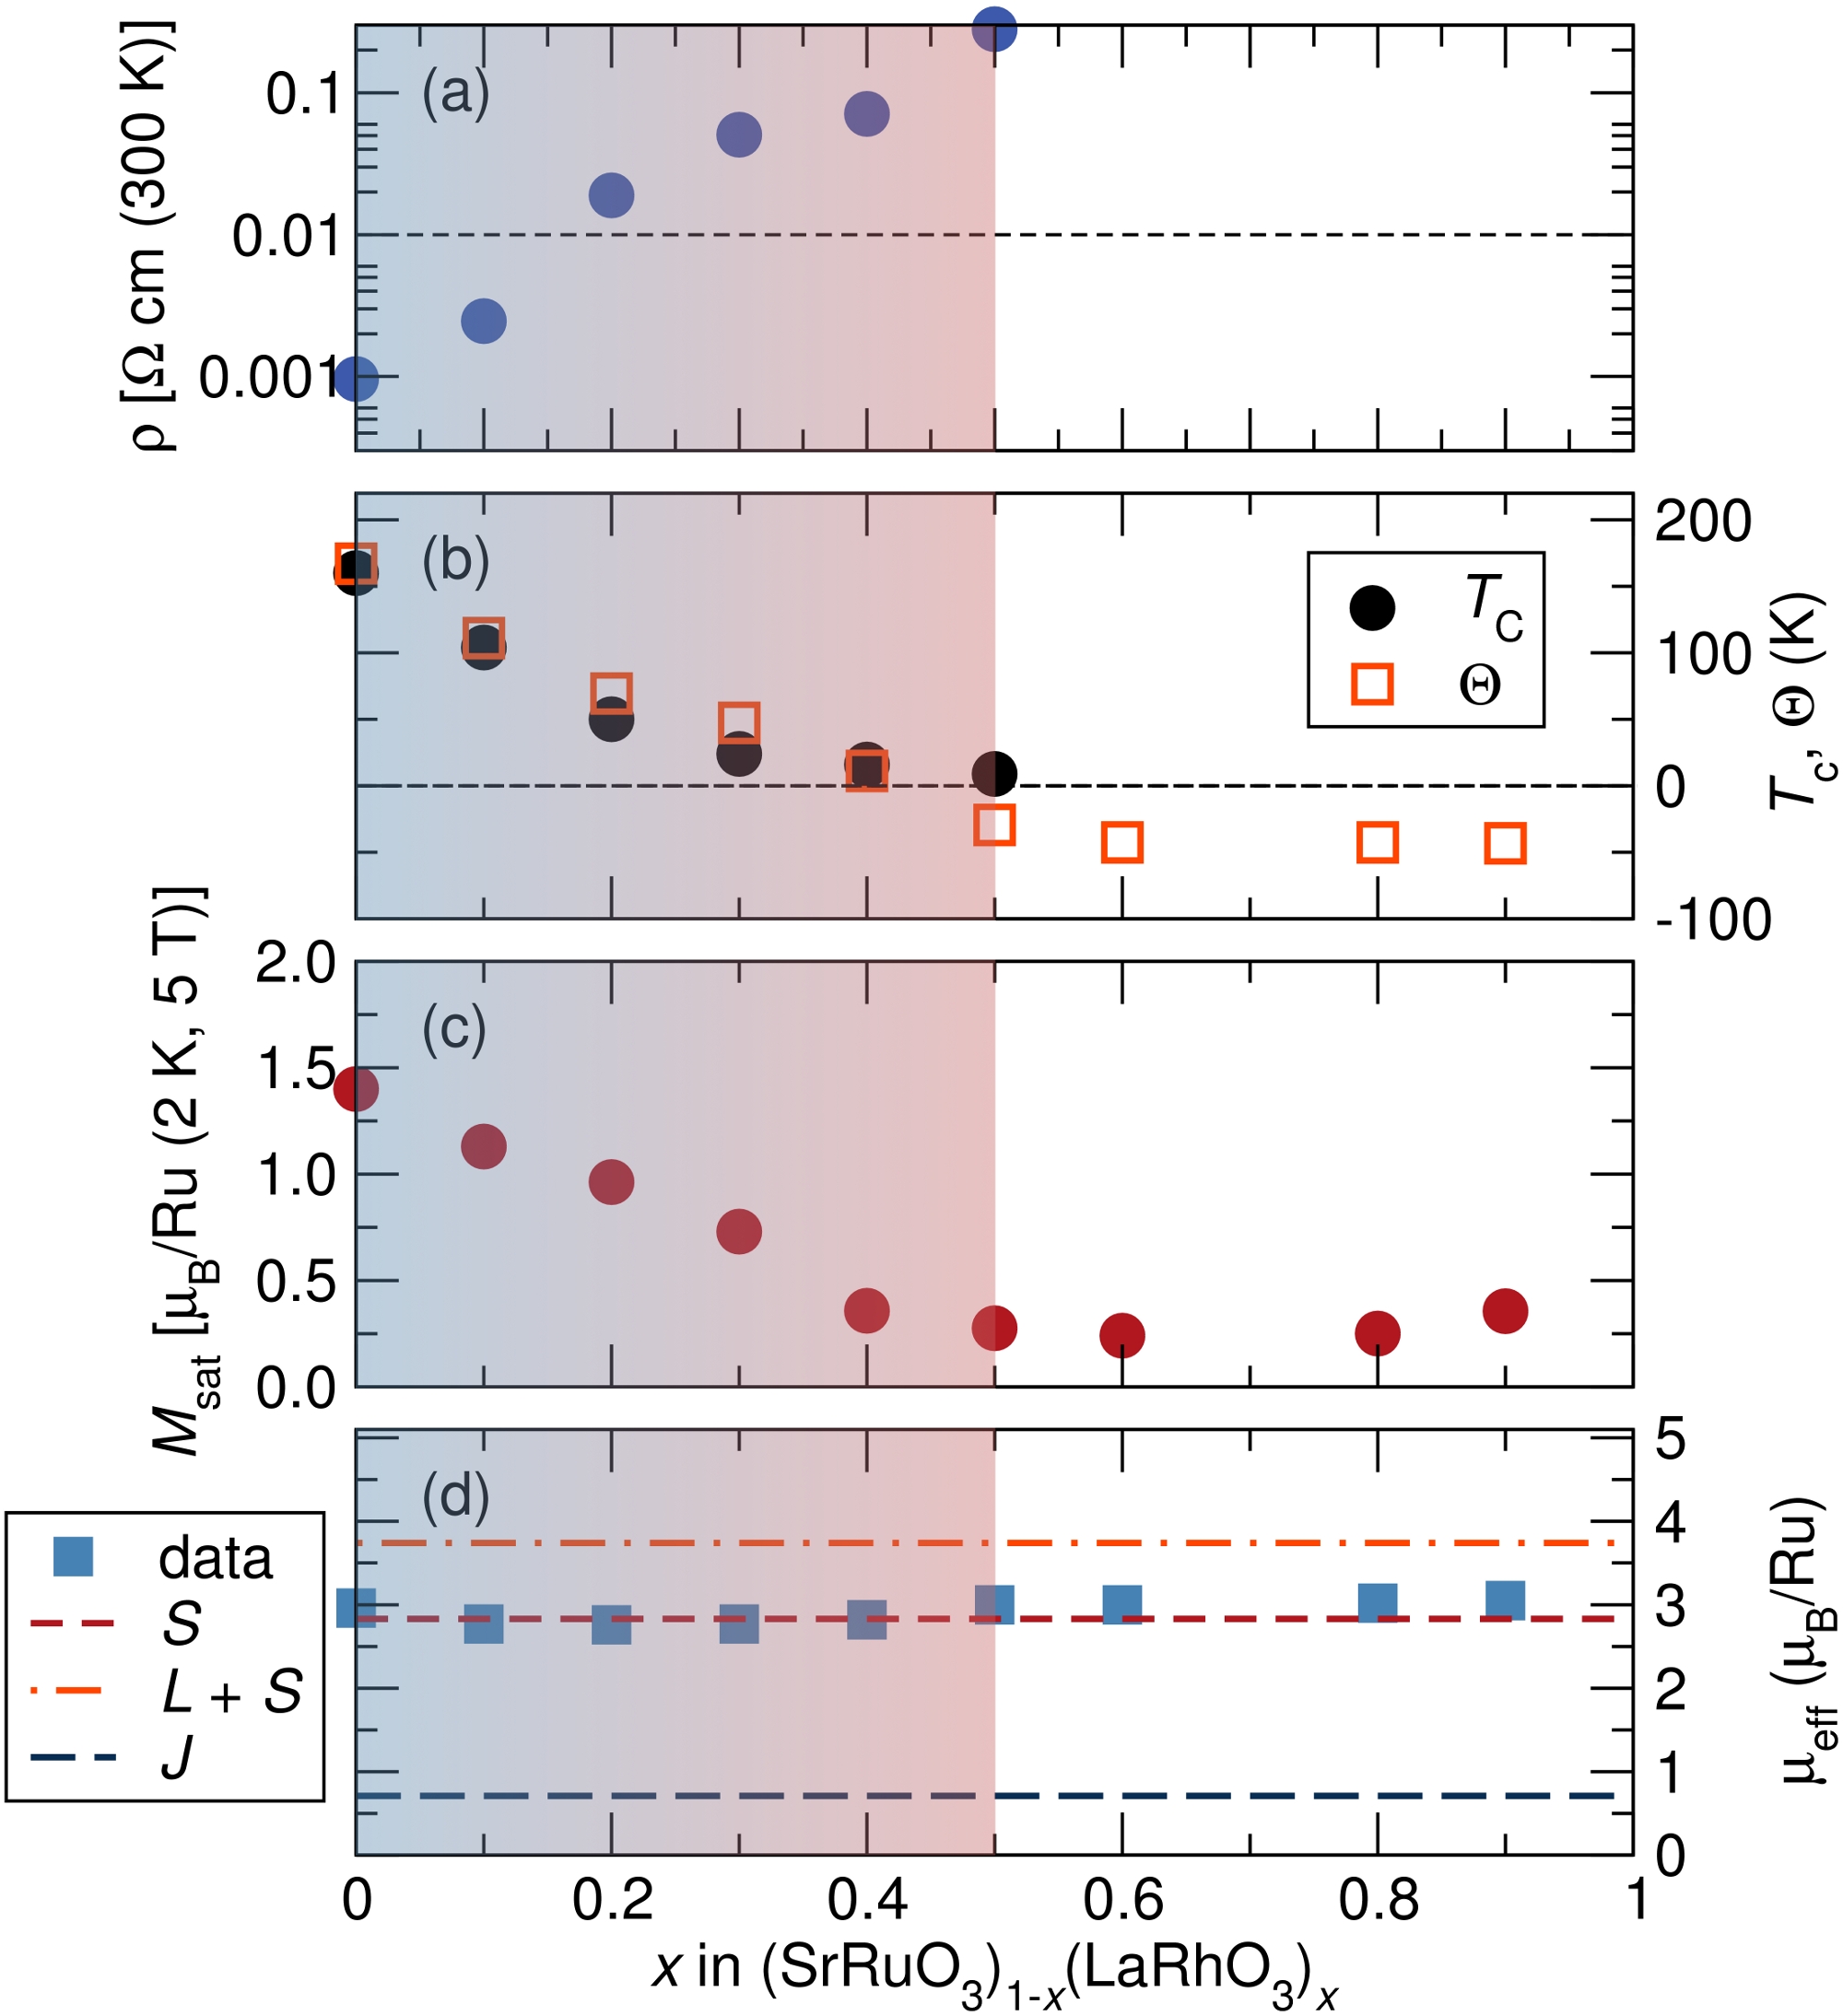
FIG. 10 summarizes the findings of this work in the form of a property-composition phase diagram. It displays the electrical resistivity at 300 K, Curie temperature , Curie-Weiss temperature , saturation magnetization at 2 K and 5 T, and effective moment as a function of LaRhO3 substitution, using the data from Table 2. From panel (a), we see that the formal compositionally-driven metal-to-insulator transition takes place between = 0.1 and 0.2. Panel (b) shows that first decreases smoothly with LaRhO3 substitution as similarly seen for LaFeO3, LaCoO3, and Ca substitution, but then, in contrast to those systems, levels off for large .Mamchik and Chen (2004); Mamchik et al. (2004); Kanbayasi (1978) We have employed values determined from peaks in using field-cooled . For small , suggesting that Curie-Weiss behavior is obeyed. Around = 0.5, the value of becomes small and negative, and this is the region beyond which there is no evidence for magnetic ordering. decreases with LaRhO3 substitution, as might be expected given that magnetic Ru4+ are diluted with increasing , but the rate at which the decrease takes place is only slightly faster that what is seen in the Sr1-xCaxRuO3 system.He et al. (2000) The Ru–O–Ru bond angles also decrease with in a similar manner as is seen in Sr1-xCaxRuO3 and the suggestion is that structural effects as increases are perhaps as important as the effect of filling . Comparisons can be made with the Co1-xFexS2 pyrite system which exhibits Stoner ferromagnetism.Jarrett et al. (1968); Ramesha et al. (2004); Guo et al. (2010) There, it is observed that remains constant over a large range of while in (SrRuO3)1-x(LaRhO3)x we find that drops rapidly with LaRhO3 substitution. This may suggest that (SrRuO3)1-x(LaRhO3)x does not strictly follow Stoner-Wohlfarth band ferromagnetism. Further, the = 0.2 sample is a good ferromagnet despite being an electrical insulator. per Ru decreases with LaRhO3 substitution as seen in FIG. 10(c), in the region of magnetic ordering, and then is more-or-less flat with . As previously reported, SrRuO3 has a equal to the spin only value for Ru4+ as the orbital contribution expected for an octahedral cation is quenched out.Randall and Ward (1959) As shown in FIG. 10(d), this does not change with LaRhO3 substitution, as remains essentially constant across the solid solution as the Ru coordination environment remains unchanged.
IV Conclusions
This study of the electrical and magnetic properties of (SrRuO3)1-x(LaRhO3)x has enabled some important observations and conclusions regarding the magnetism in SrRuO3 to be made. We note the magnetism in the solid solution does not require metallic conduction in order to persist. While the Rhodes-Wohlfarth ratio has previously been reported for SrRuO3 and provided as evidence of intermediate behavior between localized and itinerant, we demonstrate that alloying with a diamagnetic semiconductor pushes the behavior to become more localized. Comparison with Sr1-xCaxRuO3 reveals that octahedral tilting is nearly as effective at disrupting ferromagnetism in (SrRuO3)1-x(LaRhO3)x as is the dilution of magnetism achieved by filling .
V Acknowledgments
We gratefully acknowledge useful discussions with James R. Neilson and Brent C. Melot. This project is supported through a Materials World Network Award from the NSF (DMR 0909180) in Santa Barbara, and from the EPSRC (EP/G065314/1) in Liverpool. We acknowledge the use of MRL Central Facilities which are supported by the MRSEC Program of the NSF under Award No. DMR05-20415; a member of the NSF-funded Materials Research Facilities Network (www.mrfn.org). Use of data from the 11-BM beamline at the Advanced Photon Source was supported by the U.S. Department of Energy, Office of Science, Office of Basic Energy Sciences, under Contract No. DE-AC02-06CH11357.
References
- Randall and Ward (1959) J. J. Randall and R. Ward, J. Am. Chem. Soc. 81, 2629 (1959).
- Callaghan et al. (1966) A. Callaghan, C. W. Moeller, and R. Ward, Inorg. Chem. 5, 1572 (1966).
- Longo et al. (1968) J. M. Longo, P. M. Raccah, and J. B. Goodenough, J. Appl. Phys. 39, 1327 (1968).
- Jin et al. (2008) C.-Q. Jin, J.-S. Zhou, J. B. Goodenough, Q. Q. Liu, J. G. Zhao, L. X. Yang, Y. Yu, R. C. Yu, T. Katsura, A. Shatskiy, et al., Proc. Natl. Acad. Sci. U. S. A. 105, 7115 (2008).
- Worledge and Geballe (2000) D. C. Worledge and T. H. Geballe, Phys. Rev. Lett. 85, 5182 (2000).
- Takahashi et al. (2003) K. S. Takahashi, A. Sawa, Y. Ishii, H. Akoh, M. Kawasaki, and Y. Tokura, Phys. Rev. B 67, 094413 (2003).
- Toyota et al. (2005) D. Toyota, I. Ohkubo, H. Kumigashira, M. Oshima, T. Ohnishi, M. Lippmaa, M. Takizawa, A. Fujimori, K. Ono, M. Kawasaki, et al., Appl. Phy. Lett. 87 (2005).
- Chang et al. (2009) Y. J. Chang, C. H. Kim, S.-H. Phark, Y. S. Kim, J. Yu, and T. W. Noh, Phys. Rev. Lett. 103, 057201 (2009).
- Jones et al. (1989) C. W. Jones, P. D. Battle, P. Lightfoot, and W. T. A. Harrison, Acta Crystallogr. C 45, 365 (1989).
- Bushmeleva et al. (2006) S. N. Bushmeleva, V. Y. Pomjakushin, E. V. Pomjakushina, D. V. Sheptyakov, and A. M. Balagurov, J. Magn. Magn. Mater. 305, 491 (2006).
- Kiyama et al. (1996) T. Kiyama, K. Yoshimura, K. Kosuge, Y. Ikeda, and Y. Bando, Phys. Rev. B 54, R756 (1996).
- Allen et al. (1996) P. B. Allen, H. Berger, O. Chauvet, L. Forro, T. Jarlborg, A. Junod, B. Revaz, and G. Santi, Phys. Rev. B. 53, 4393 (1996).
- Castelpoggi et al. (1997) F. Castelpoggi, L. Morelli, H. R. Salva, S. L. Cuffini, R. Carbonio, and R. D. Sanchéz, Solid State Commun. 101, 579 (1997).
- Yoshimura et al. (1999) K. Yoshimura, T. Imai, T. Kiyama, K. R. Thurber, A. W. Hunt, and K. Kosuge, Phys. Rev. Lett. 83, 4397 (1999).
- Kiyama et al. (1999) T. Kiyama, K. Yoshimura, K. Kosuge, H. Mitamura, and T. Goto, J. Phys. Soc. Jpn. 68, 3372 (1999).
- Mazin and Singh (1997) I. I. Mazin and D. J. Singh, Phys. Rev. B 56, 2556 (1997).
- Santi and Jarlborg (1997) G. Santi and T. Jarlborg, J. Phys.: Condensed Matter 9, 9563 (1997).
- Rondinelli et al. (2008) J. M. Rondinelli, N. M. Caffrey, S. Sanvito, and N. A. Spaldin, Phys. Rev. B 78, 155107 (2008).
- Stoner (1938) E. C. Stoner, Proc. R. Soc. London. A 165, 372 (1938).
- Maiti and Singh (2005) K. Maiti and R. S. Singh, Phys. Rev. B 71, 161102 (2005).
- Maiti (2006) K. Maiti, Phys. Rev. B 73, 235110 (2006).
- Mamchik and Chen (2004) A. Mamchik and I. W. Chen, Phys. Rev. B 70, 104409 (2004).
- Mamchik et al. (2004) A. Mamchik, W. Dmowski, T. Egami, and I. W. Chen, Phys. Rev. B 70, 104410 (2004).
- Cao et al. (1996) G. Cao, S. McCall, J. Bolivar, M. Shepard, F. Freibert, P. Henning, J. E. Crow, and T. Yuen, Phys. Rev. B 54, 15144 (1996).
- Cheng et al. (2010) J.-G. Cheng, J.-S. Zhou, and J. B. Goodenough, Phys. Rev. B 81, 134412 (2010).
- Kanbayasi (1978) A. Kanbayasi, J. Phys. Soc. Jpn. 44, 108 (1978).
- Fukunaga and Tsuda (1994) F. Fukunaga and N. Tsuda, J. Phys. Soc. Jpn. 63, 3798 (1994).
- Cao et al. (1997a) G. Cao, S. McCall, M. Shepard, J. E. Crow, and R. P. Guertin, Phys. Rev. B 56, 321 (1997a).
- Kiyama et al. (1998) T. Kiyama, K. Yoshimura, K. Kosuge, H. Michormbox, and G. Hilscher, J. Phys. Soc. Jpn. 67, 307 (1998).
- He et al. (2000) T. He, Q. Huang, and R. J. Cava, Phys. Rev. B 63, 024402 (2000).
- Mukuda et al. (1999) H. Mukuda, K. Ishida, Y. Kitaoka, K. Asayama, R. Kanno, and M. Takano, Phys. Rev. B 60, 12279 (1999).
- Cao et al. (2008) G. Cao, O. Korneta, S. Chikara, L. DeLong, and P. Schlottmann, Solid State Communications 148, 305 (2008).
- Griffiths (1969) R. B. Griffiths, Phys. Rev. Lett. 23, 17 (1969).
- Bray (1987) A. J. Bray, Phys. Rev. Lett. 59, 586 (1987).
- Wold et al. (1957) A. Wold, B. Post, and E. Banks, J. Am. Chem. Soc. 79, 6365 (1957).
- Nakamura et al. (1993) T. Nakamura, T. Shimura, M. Itoh, and Y. Takeda, J. Solid State Chem. 103, 523 (1993).
- Mary and Varadaraju (1994) T. A. Mary and U. V. Varadaraju, J. Solid State Chem. 110, 176 (1994).
- Cao et al. (1997b) G. Cao, F. Freibert, and J. E. Crow, J. Appl. Phys. 81, 3884 (1997b).
- Rhodes and Wohlfarth (1963) P. Rhodes and E. P. Wohlfarth, Proc. R. Soc. London A 273, 247 (1963).
- Rietveld (1969) H. M. Rietveld, J. Appl. Crystallogr. 2, 65 (1969).
- Bérar and Baldinozzi (1998) J. Bérar and G. Baldinozzi, IUCr-CPD Newsletter 20, 3 (1998).
- Momma and Izumi (2008) K. Momma and F. Izumi, J. Appl. Cryst. 41, 653 (2008).
- Goldschmidt (1926) V. M. Goldschmidt, Geochemische verteilungsgesetze der elemente (I Mater. Naturvid. Kl. no 2. Oslo: Skrifter Norske Videskaps–Akad., Reading, Massachusetts, 1926).
- Shannon and Prewitt (1969) R. D. Shannon and C. T. Prewitt, Acta Crystallogr. B 25, 925 (1969).
- Glazer (1972) A. M. Glazer, Acta Crystallogr. B 28, 3384 (1972).
- Melot et al. (2009) B. C. Melot, J. E. Drewes, R. Seshadri, E. M. Stoudenmire, and A. P. Ramirez, J. Phys.: Condens. Matter 21, 216007 (2009).
- Kotani (1949) M. Kotani, J. Phys. Soc. Jpn 4, 293 (1949).
- Takahashi (1986) Y. Takahashi, J. Phys. Soc. Jpn 55, 3553 (1986).
- Jarrett et al. (1968) H. S. Jarrett, W. H. Cloud, R. J. Bouchard, S. R. Butler, C. G. Frederick, and J. L. Gillson, Phys. Rev. Lett. 21, 617 (1968).
- Ramesha et al. (2004) K. Ramesha, R. Seshadri, C. Ederer, T. He, and M. A. Subramanian, Phys. Rev. B 70, 214409 (2004).
- Guo et al. (2010) S. Guo, D. P. Young, R. T. Macaluso, D. A. Browne, N. L. Henderson, J. Y. Chan, L. L. Henry, and J. F. DiTusa, Phys. Rev. B 81, 144423 (2010).