Flaring Solar Hale Sector Boundaries
Abstract
Magnetic fields and the occurrence of flares and microflares are strongly concentrated near that portion (the Hale boundary) in each solar hemisphere where the change in magnetic sector polarity is the same as that between leading and following sunspot polarities in active regions.
1 Introduction
When the Heliospheric Current Sheet overtakes the Earth (or a spacecraft) an abrupt change of magnetic polarity (away from the Sun or towards the Sun) is observed: a Sector Boundary (SB).
A SB (observed at Earth) maps back to a magnetic neutral line at central meridian in the solar corona and also in the originating photospheric magnetic field about 5 days earlier, being the transit time of the solar wind. The latter neutral line is on average meridional, i.e. along longitudes (Svalgaard, Wilcox, Scherrer, & Howard, 1975).
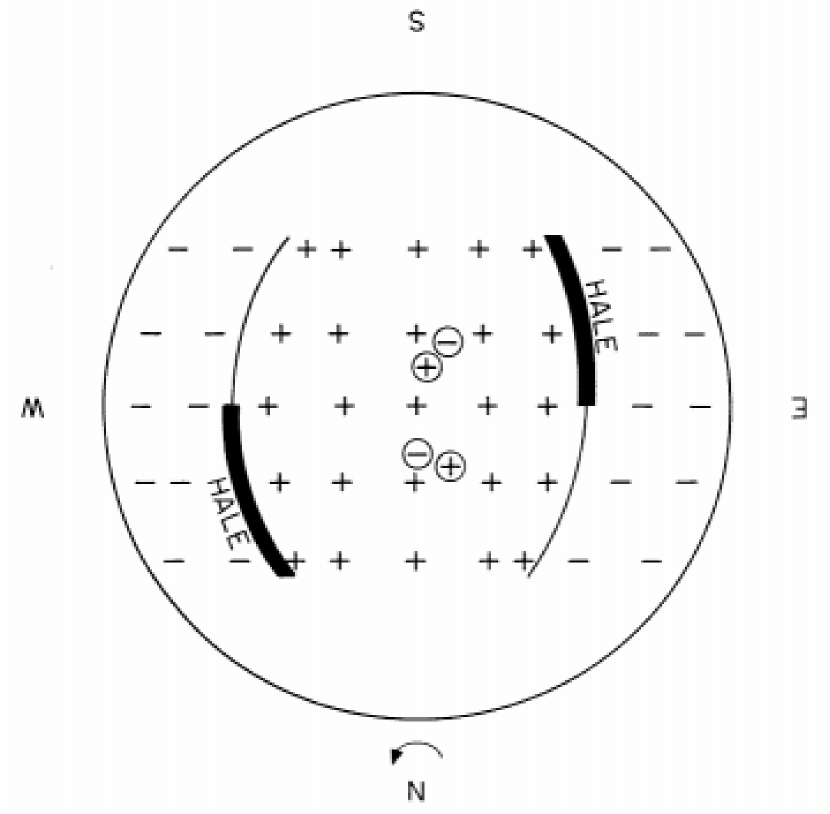
Active regions have a photospheric neutral line too. The neutral line divides opposite polarities oppositely in opposite hemispheres (Hale’s law). The portion (in a hemisphere, see Figure 1) of a SB neutral line where the polarity change is the same as that for an active region was called a Hale Boundary by Svalgaard & Wilcox (1976).
They showed that above a Hale portion of a SB, the green corona has a maximum in brightness, while above a non-Hale boundary, the green corona has minimum brightness. Using synoptic maps of the magnitude of the photospheric field strength observed at Mt. Wilson Observatory during 1967 to 1973 it was also found that the unsigned magnetic field flux is at a maximum at the Hale boundary, in concert with the green corona brightness.
2 Observations
2.1 Magnetic Field
We have recently repeated the analysis using all available data from the Wilcox Solar Observatory (WSO). At WSO (http://wso.stanford.edu/) magnetograms using the 525 nm Fe i line are obtained every day with a sufficiently clear sky. Conditions permitting, several magnetograms may be secured on a given day. Observational details can be found elsewhere: Scherrer, Wilcox, Svalgaard, Duvall, Dittmer, & Gustavson (1977); Svalgaard, Duvall, Scherrer (1978); Duvall, Scherrer, Svalgaard, & Wilcox (1978). The resulting magnetogram is a array oriented north-south on the Sun and has not been remapped to any other coordinate system. In the analysis we ignore the annual variation of latitude of disk center, giving rise to less than 1% effect on the measured field (Duvall, Scherrer, Svalgaard, & Wilcox, 1978). The magnetograms show the line-of-sight magnetic flux density over the 3’ aperture, not corrected for magnetograph saturation.
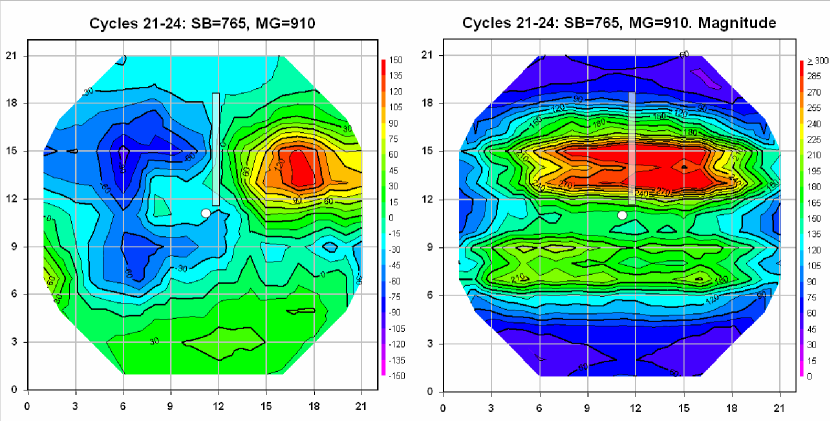
We superpose full-disk magnetograms from the times where a SB was at [i.e. within a day] central meridian. We can take advantage of the polarity changes and treat (-,+) boundaries as (+,-) boundaries by reversing the sign of the magnetic field, and of the Hale magnetic cycle by reversing latitudes between cycles to construct a ‘nominal’ cycle 23 magnetogram for a (+,-) Hale boundary from the average over solar cycles 21-24 shown in Figure 2.
It is now evident, that on average, what causes the ‘warps’ in the current sheet (and hence the SB at Earth) originates strongly from one hemisphere, namely that which has the Hale boundary (the Northern in Figure 2). Coronal holes are often found co-located with the interiors of the sectors.
One important (the only?) source of the open flux is dispersing flux from active regions with strong magnetic fields so we expect the concentration of total flux at the Hale boundary as shown in the right-hand side of Figure 2. The closed field lines associated with the active regions would trap coronal material, explaining the enhanced brightness of the green corona at Hale boundaries.
2.2 Flares
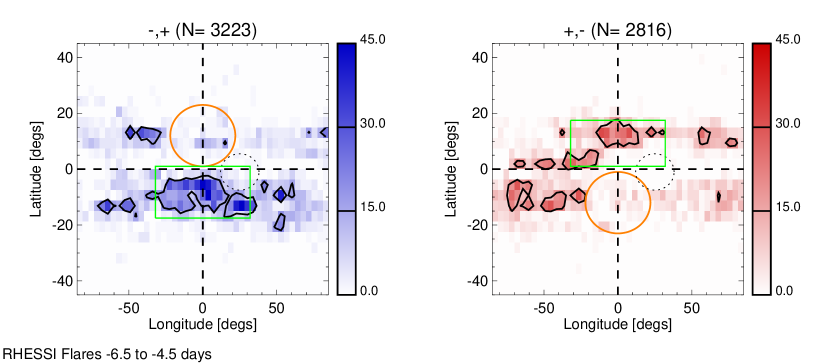
We would also expect flares and microflares to preferentially occur near the Hale boundary. Using the RHESSI list of hard X-ray flares covering the interval March 2002 to March 2008 (wholly within cycle 23) we find, indeed, that to be the case, Figure LABEL:F-HaleF. The green boxes show where flares are expected, based on association with strong magnetic fields: i.e. at the Hale boundary. The red circles show that hardly any flares occur near a non-Hale boundary.
The RHESSI flare list catalogues times of sharp rises in X-ray flux detected between 3 to 50 keV. Using the imaging capabilities of RHESSI the position of each of these events is found to arc second accuracy. The RHESSI flare list covers the largest GOES X10-class flares down to A-Class microflares ( to Wm-2 in terms of GOES 1-8 Å flux). An instrumental bias in the RHESSI event list is a deficiency of events about the location of spacecraft pointing, predominantly slightly West of disk center (dashed circles on Figure 3; see also Figure 4 of Christie, Hannah, Krucker, McTiernan, & Lin (2008). RHESSI’s imaging method uses rotation modulation collimators, so flares close to where this imaging axis is pointing will have their location poorly determined and are not included in the flare list. For the RHESSI microflare study it was estimated that less than 2% of events were affected by the imaging axis problem (Christie, Hannah, Krucker, McTiernan, & Lin, 2008).
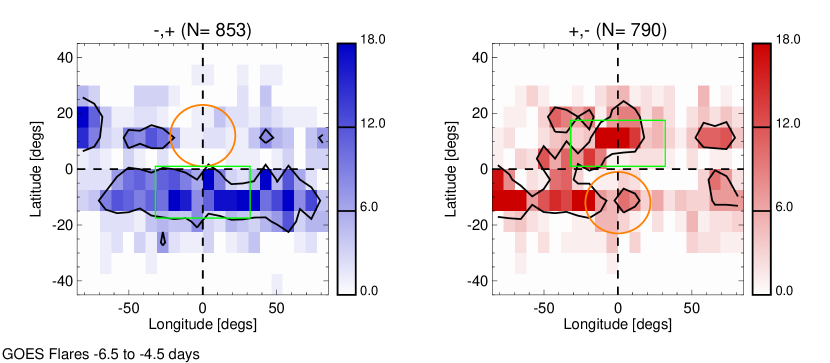
GOES flares for May 1996 through 2008 (cycle 23) show the same distribution, Figure 4. The GOES flare list contains events down to the B1-class, Wm-2, about an order of magnitude larger than the smallest events in the RHESSI flare list.
An early analysis by Dittmer (1975) also concluded that flares preferentially occur near sector boundaries whose polarity agrees with that of bipolar active regions a given by the Hale polarity laws. Already Bumba & Obridko (1969) found that flares and especially ‘proton’-flares tend to occur near SBs, and Grigoryev, Latushko, & Peshcherov (1986) found that toroidal magnetic flux emerges preferably at Hale boundaries.
3 Conclusion
In a sense this is just what we would expect. On the other hand, the patterns we report emphasize the high degree of coherence in the organization of solar magnetic activity on large scales, something that may not be well-understood theoretically, but which presumably links the sector structure to the deep interior of the Sun. The solar sector structure is very organized and long-lived and it seems that solar activity enjoys some of the same degree of spatial and temporal structure. Such structure might be useful for prediction of flares.
References
- Bumba & Obridko (1969) Bumba, V., & Obridko, V. N. 1969, Solar Phys., 6, 104
- Christie, Hannah, Krucker, McTiernan, & Lin (2008) Christie, S., Hannah, I. G., Krucker, S., McTiernan, J., & Lin, R. P. 2008, Ap. J., 677, 1385
- Dittmer (1975) Dittmer, P. H. 1975, Solar Phys., 41, 227
- Duvall, Scherrer, Svalgaard, & Wilcox (1978) Duvall, T. L. Jr., Scherrer, P. H., Svalgaard, L., & Wilcox, J. M. 1978, Solar Phys., 61, 233
- Grigoryev, Latushko, & Peshcherov (1986) Grigoryev, V. M., Latushko, S. M., & Peshcherov, V. S. 1986, Contrib. Astron. Obs. Skalnate Pleso, 15, 481
- Scherrer, Wilcox, Svalgaard, Duvall, Dittmer, & Gustavson (1977) Scherrer, P. H., Wilcox, J. M., Svalgaard, L., Dittmer, P. H., & Gustavson, E. K. 1977, Solar Phys., 54, 353
- Svalgaard, Duvall, Scherrer (1978) Svalgaard, L., Duvall, T.L.Jr., & Scherrer, P.H. 1978, Solar Phys., 58, 225
- Svalgaard, Wilcox, Scherrer, & Howard (1975) Svalgaard, L., Wilcox, J. M., Scherrer, P. H., & Howard, R. 1975, Solar Phys., 45, 83
- Svalgaard & Wilcox (1976) Svalgaard, L., & Wilcox, J. M. 1976, Solar Phys., 49, 177