Massive Star Formation of the Sgr A East HII Regions
Near the Galactic Center
Abstract
A group of four compact HII regions associated with the well-known 50 km s-1 molecular cloud is the closest site of on-going star formation to the dynamical center of the Galaxy, at a projected distance of 6 pc. We present a study of ionized gas based on the [NeII] (12.8 m) line, as well as multi-frequency radio continuum, HST Pa and Spitzer IRAC observations of the most compact member of the HII group, Sgr A East HII D. The radio continuum image at 6cm shows that this source breaks up into two equally bright ionized features, D1 and D2. The SED of the D source is consistent with it being due to a 25 M⊙ star with a luminosity of . The inferred mass, effective temperature of the UV source and the ionization rate are compatible with a young O9-B0 star. The ionized features D1 and D2 are considered to be ionized by UV radiation collimated by an accretion disk. We consider that the central massive star photoevaporates its circumstellar disk on a timescale of 3 years giving a mass flux M⊙ yr-1 and producing the ionized material in D1 and D2 expanding in an inhomogeneous medium. The ionized gas kinematics, as traced by the [Ne II] emission, is difficult to interpret, but it could be explained by the interaction of a bipolar jet with surrounding gas along with what appears to to be a conical wall of lower velocity gas. The other HII regions, Sgr A East A-C, have morphologies and kinematics that more closely resemble cometary flows seen in other compact HII regions, where gas moves along a paraboloidal surface formed by the interaction of a stellar wind with a molecular cloud.
1 Introduction
The Galactic center region is known to have a high concentration of massive, warm, dense and turbulent molecular clouds. Due to strong tidal forces exerted by the gravitational potential of the nuclear cluster and the massive black hole, Sgr A*, only dense molecular gas is expected to survive in this region (see Morris & Serabyn, 1996). This has the ramification that the formation of massive stellar clusters must be pervasive in this region as evidenced by the Arches and Quintuple clusters as well as the nuclear massive cluster centered on Sgr A* (Figer et al., 2002; Bartko et al., 2009, and the references therein). There are also young clusters of O-B stars traced by ultracompact (UC) HII regions in Sgr B2 (e.g. dePree, Goss, & Gaume, 1998) which is possibly the best example of mini-starburst activity in the Galaxy. Although our present understanding of star formation is primarily limited to observations of low-mass stars (Shu, Adams, & Lizano, 1987; McKee & Ostriker, 2007; Zinnecker & Yorke, 2007), probing star forming sites in the Galactic center region can be useful in addressing the key mechanism by which massive stars are formed (M 10 M⊙) (see Hoare et al., 2007, and references cited therein).
Here, we examine the nature of a group of massive young stars lying within 2.5′ of the dynamical center of the Galaxy (Reid & Brunthaler, 2004; Ghez et al., 2008; Gillessen et al., 2006). At a projected distance of 6 pc from Sgr A*, there is a cluster of compact HII regions on the edge of the 50 km s-1 molecular cloud M-0.02-0.07. This cluster consists of brightest HII regions in the Galactic center with the exception of the cluster of HII regions in Sgr B2. The 50 km s-1 molecular cloud itself is interacting with the nonthermal Sgr A East (e.g. Tsuboi et al., 2009, and references cited therein) which is known to be a supernova remnant (SNR G0.0+0.0). Since Sgr A East appears to be interacting with the Galactic center circumnuclear molecular ring, which itself orbits Sgr A*, it is probable that Sgr A East, M-0.02-0.07, and the cluster of HII regions all lie near the Galactic center, not far from their projected distances. The compact HII regions, known as the Sgr A East HII A to D (Sgr A A-D), trace the site of recent massive star formation nearest to the dynamical center of the Galaxy. The four HII regions have radial velocities ranging between 43 and 49 km s-1, thus appear dynamically coupled to the 50 km s-1 molecular cloud (Goss et al., 1985; Serabyn, Lacy, & Achtermann, 1992). With the exception of [ArIII] emission from Sgr A-D HII source, IR spectroscopic measurements detected [NeII] and [ArIII] line emission from all four components (A-D) indicating that the exciting stars have spectral types of O8-B0 (Serabyn, Lacy, & Achtermann, 1992), consistent with H76 measurements (Goss et al., 1985).
The measured extinction toward Sgr A East A-C is less than that of source D (Cotera et al., 1999; Serabyn, Lacy, & Achtermann, 1992). Additional extinction for source D is likely due to the 50 km s-1 molecular clouds or due to material associated with the ionizing stellar source (Serabyn, Lacy, & Achtermann, 1992). These authors estimate the extinction values at 12.8m are mag for A-C and 3.3 toward the Sgr A D source. These extinction measurements imply that the Sgr A East A-C HII regions, which are resolved spatially, are located on the front side of the molecular cloud, whereas the compact Sgr A D source or G359.96-0.08 (hereafter this source is called D), may be embedded within the 50 km s-1 molecular cloud. Near-IR measurements have also examined the stellar sources associated with these HII regions Cotera et al. (1999). A highly reddened source with a H-K′ 3.5 is detected at the position of the most compact HII source D. The low fractional abundance of Ar++ led to the suggestion that stellar temperatures of the Sgr A East HII regions range between 34,500 and 36,500K (Serabyn, Lacy, & Achtermann, 1992) which are consistent with spectra types O8-O9 stars (Goss et al., 1985; Yusef-Zadeh et al., 1989). The spectral identification of the Sgr A D source has not been clear but Cotera et al. (1999) suggest that its spectrum could be consistent with a combination of an ultracompact (UC) HII region and B[e] stars. Here, we investigate radio and infrared properties of the most compact (D source) and extended (A source) of the Sgr A East HII regions.
2 Observations
2.1 Radio Continuum
Radio continuum observations were made with the D configuration of the Very Large Array (VLA) of the National Radio Astronomy Observatory111The National Radio Astronomy Observatory is a facility of the National Science Foundation, operated under a cooperative agreement by Associated Universities, Inc. (NRAO), at 43 GHz (7mm). The source was observed as part of a survey of UC HII regions in the Galactic Center, which took place May 29, 2009. The source was observed in the fast switching mode of the VLA (each cycle had 150 seconds on the source and 15 seconds on the complex gain calibrator - NRAO530) for a total of 20 minutes. 3C286 was used as a flux calibrator. Standard data editing and calibration of the gains was done in AIPS. Using standard calibration, we also reduced multi-configuration radio continuum data at 8.3 GHz (AY43). The 4.8GHz data were taken from Yusef-Zadeh & Wardle (1993).
2.2 [NeII] Line & 12.8m Continuum
The Sgr A East HII region cluster was observed in the [Ne II] (12.8 m) line with the high-resolution mid-infrared spectrograph TEXES on the NASA IRTF on 2009 June 3 and 2010 May 30 (UT). TEXES (Lacy et al., 2002) has several operating modes. These observations were made in two modes: high-resolution, cross-dispersed, with velocity resolution 4 km s-1 and spatial resolution 1.2″ along a 1.47.5″ slit, and medium resolution, long-slit, with velocity resolution 25 km s-1 along a 1.455″ slit. The pixel spacing is 0.36″ spatially and 0.95 km s-1 spectrally in cross-dispersed mode. It is 0.36″ and 8.9 km s-1 in long-slit mode. Maps were made by stepping the N-S oriented slit to the east, with 0.7″ steps in 2009 and 0.35″ steps in 2010. The Sgr A East HII region was mapped in 2009 in cross-dispersed mode by making a series of scans, each covering 307.5″ (RADec), which were pieced together to cover a 3468″ region (with some small gaps), with the help of a long-slit scan that covered the entire region. HII source D was reobserved in 2010 to obtain better spatial sampling and higher signal-to-noise ratio. These measurements also allowed us to detect 12.8m emission from the D source using our low spectral resolution data and medium resolution data taken in 2009.
The spectral coverage of the data was 2270 km s-1, which in the cross-dispersed observations was broken into 8 spectral orders of the high-resolution grating. [Ne II] line emission was detected in a 60 km s-1 interval centered at vLSR 46 km s-1. Dust continuum emission was only marginally detected outside of this spectral interval (Also see Figure 3 showing source D before and after deconvolution.)
The data were first processed with the standard TEXES pipeline reduction program (Lacy et al., 2002), which removes spikes, corrects for optical distortions, and produces wavelength and intensity calibrated maps. It was then processed with a maximum-entropy-method deconvolution routine, which improved the spatial resolution to about 0.7″, slightly better than the Infrared Telescope Facility (IRTF) diffraction limit. Because a part of the point-spread function is caused by seeing, which cannot be exactly the same for the observations of the PSF calibrator (VX Sgr) and the HII region, the results of the deconvolution should be viewed with some caution, but the close similarity between the deconvolved [Ne II] data and the higher resolution radio continuum data indicates that the results should be reliable. In addition, all of the features that we discuss in the [Ne II] data can be seen before deconvolution, although some sources, notably the two peaks in HII source D, blend together. The absolute astrometry of the 12.8m data is about few arcseconds. We obtained coordinates for the [Ne II] maps by aligning them with the radio maps. These should be good to better than 0.35” (1 pixel). The relative astrometry of the [Ne II] and 12.8um continuum should be better since they were observed simultaneously.
2.3 1.90m Continuum and Pa Line Data
Pa emission-line and continuum images of the Sgr A East region were obtained as part of the larger survey of the Galactic center by Wang et al. (2010), using the Near-Infrared Camera and Multi-Object Spectrometer (NICMOS) on HST (program 11120). Exposures were obtained in March–May 2008 using the NICMOS camera 3, which has a pixel scale of 0.20″. Images were obtained in narrow-band filters centered on the Pa emission line at 1.87m and the nearby continuum at 1.90m. A pattern of dithered observations was obtained at each pointing in the survey with each exposure having a duration of 48 seconds.
For this study we used a total of 8 exposures in each of the two filters that covered the region near source D. Calibrated images were retrieved from the Hubble Data Archive, which had been processed using the latest NICMOS instrumental calibrations and data reduction software. The eight calibrated images in each filter were combined using the ”multidrizzle” task in the STSDAS package of PyRAF. The final drizzle-combined images at Pa and 1.90m were subsequently rescaled using the latest NICMOS photometric zeropoint information to produce images in calibrated units of Jy.
To determine the position uncertainty of the stars, a Gaussian was fitted to two different F190N images with different exposures. Both images were used in making the drizzled mosaic. This allows us to to measure random pointing errors from exposure to exposure, as well as the uncertainties in our measurements of the centroid in the images. The random errors in pointing and measurements are on the order of . This is entirely consistent with the random relative errors associated with HST reacquiring guide stars in between exposures. In addition to this random error of , there is also an absolute rms uncertainty of in how well the coordinates of the HST guide stars are known. Thus, the coordinates of the HST images can be trusted only at the level of 0.2″.
2.4 IRAC Measurements
IRAC observed the SGR A D as part of the Galactic center (GALCEN) survey by Stolovy et al. (2006). It was covered by 5 exposures with 1.2 sec frame times. The IRAC flux densities for Sgr A D were obtained from both the GALCEN Catalog (Ramirez et al., 2008) and the independently reduced GLIMPSE II catalog (an extension of the GLIMPSE survey, Benjamin et al. (2003)). At 3.6, 4.5, and 5.8 m we use the GLIMPSE II measurements, which tend to be lower than the GALCEN measurements. The GALCEN catalog indicates that the source is near or at saturation at all wavelengths, although at 3.6 m the source is only slightly past the nominal saturation limit. The GLIMPSE II catalog does not include an 8 m flux density. At this wavelength (and only this wavelength) the IRAC images show a local minimum at the peak of the source which is characteristic of a strongly saturated source. We have attempted to apply T. Jarret’s IRACWORKS software222http://ssc.spitzer.caltech.edu/dataanalysistools/tools/contributed/irac/iracworks/ to recover the flux of Sgr A D from the saturated images. At 3.6 - 5.8 m IRACWORKS does not recognize Sgr A D as a saturated source, suggesting that cataloged flux densities are not less than of the true values. At 8 m IRACWORKS successfully fits the source for only 2 out of 5 of the exposures, but does find a consistent result of mJy, which is about 2.5 times higher than the lower limit provided by the GALCEN catalog. Reported magnitudes and flux densities are listed in Table 1.
| Source | Band | Magnitude | Flux Density (mJy) |
|---|---|---|---|
| 2MASS 17455154-2900231 | |||
| J | |||
| H | |||
| K | |||
| SSTGC 0556837 (GALCEN)aaMay be affected by saturation | |||
| 3.6 | |||
| 4.5 | |||
| 5.8 | |||
| 8 | |||
| SSTGLMA G359.9672-00.0811 (GLIMPSE II) | |||
| 3.6 | |||
| 4.5 | |||
| 5.8 | |||
| 8 | |||
| (IRACWORKS) | |||
| 8 | |||
| (TEXES) | |||
| 12.8 | 7500aaMay be affected by saturation |
3 Results
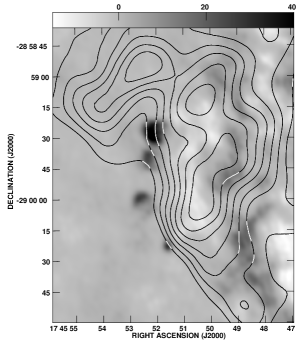
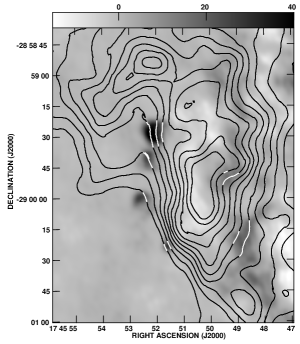
The large-scale distribution of thermal and nonthermal emission from Galactic center is complex. However, within 4′ of Sgr A*, the distribution of dust, molecular, ionized, and synchrotron emission shows that the 50 km s-1 GMC M-0.02-0.07 interfaces with the supernova remnant Sgr A East on one side and the cluster of HII regions on the opposite side. Figure 1a,b show the distributions of the 450 and 850 m thermal emission from dust, superimposed on a 20cm radio continuum image, respectively (Yusef-Zadeh & Morris, 1987; Tsuboi et al., 2009; Pierce-Price, 2000). Contours of submm emission arises from the eastern edge of the 50 km s-1 molecular cloud. These figures show that the cluster of compact HII sources Sgr A A thru D are distributed in a region relatively devoid of emission at 450 and 850m. The cavity in the submm distribution might be caused by a drop in dust temperature. We made several cuts across the region where there is a depression of submm emission and determined a constant 450m to 850m flux ratio. Since the emission is optically thin, this ratio corresponds to a constant temperature. We note that dust temperature can not be constrained because it is entangled with the uncertainty in the ratio of optical depths. Since there is no evidence for a temperature gradient in the dust distribution, it is possibile that the gas in the cavity is converted into formation of stars within the cloud. Source A is the most extended HII feature and lies to the north, whereas source D, the most compact HII source, lies to the south. The distribution of the four HII regions appear to be anticorrelated with the distribution of dust and molecular gas, consistent with kinematic evidence that the 50 km s-1 GMC is the parent cloud from which a cluster of massive young stars recently formed.
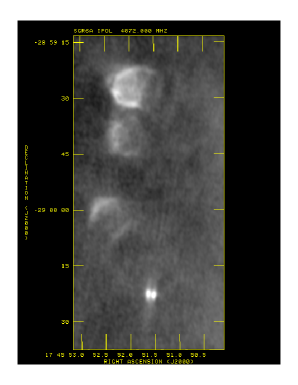
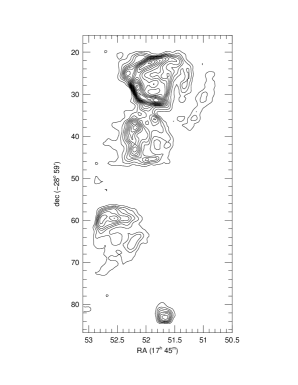
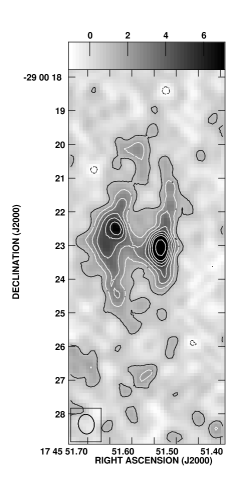
Figure 2a shows a grayscale image of free-free continuum emission from the Sgr A East HII cluster at 4.8 GHz and Figure 2b shows the integrated [NeII] line intensity map. The spatial distribution of [NeII] line emission matches very closely the free-free 4.8 GHz continuum distribution, demonstrating that [Ne II] is a good tracer of the ionized gas. Figure 2c shows a contour map of source D before and after deconvolution demonstrating the elongated structure of source D in both maps. Figure 2d shows the line and continuum maps in two different panels. The continuum map is from a 1200 km s-1interval blueward of the line. The continuum map (right panel of Fig. 2d) is narrower in the E-W direction than the line, and is centered on the peak of the line map within about 0.5′′ of the centroid of the line emission. Given the low resolution of the 2009 data, we can not determine the relative position of the continuum and line peaks with respect to each other. The high resolution data can not detect the continuum emission.
In this paper, we discuss two of the HII regions in the Sgr A East group: D, the bright, compact source to the south, and A, the most extended source to the north. Sources B and C have morphologies and kinematics similar to source A, but are more irregular and fainter.
3.1 The D Source
The brightest radio continuum source in Figure 2 is source D, which is resolved for the first time into two equally bright radio continuum sources, D1 (East) and D2 (West), separated by 12 at Position Angle (P.A.) 70∘. Each radio source consists of a compact source and a resolved structure elongated in the north-south (NS) direction. Contours of the emission at 4.87 GHz, as shown in Figure 3a, extend for or 0.7 pc, assuming that they are located at the Galactic center distance of 8 kpc. The Sgr A East HII regions have also been observed at 8.3 and 43 GHz. Figure 3b shows a grayscale image of source D at 43 GHz with a spatial resolution of 058 047. Both sources D1 and D2 show N-S structure with an extent of 4′′- 5′′. The elongated features of sources D1 and D2 each show a compact component at 43 GHz. Table 2 give the integrated flux, the size and the peak flux of individual sources D1 and D2 at 4.87, 8.3 and 43.3 GHz, respectively. The Gaussian fitted positions of D1 and D2 are and , respectively. The images from which the fitted data are obtained have identical spatial resolution 08 04 at all three frequencies. The integrated fluxes Sν for source D1 and D2 given similar spectral index of (where S) between 8 and 44 GHz.
| Source | (GHz) | S(mJy) | S(mJy) | ||
|---|---|---|---|---|---|
| D1 | 4.87 | 41.41.1 | 1.7 | 1.2 | 6.6 |
| ” | 8.45 | 32.32.3 | 1.7 | 0.7 | 8.6 |
| ” | 44.34 | 38.93.6 | 1.5 | 1.0 | 8.7 |
| D2 | 4.87 | 1.1 | 1.9 | 1.2 | 7.6 |
| ” | 8.45 | 27.31.8 | 1.4 | 0.5 | 10.00.5 |
| ” | 44.34 | 29.42.2 | 1.1 | 0.5 | 12.50.7 |
From the radio images, D1 and D2 appear to be a pair of stars, each of which has a north-south bipolar jet. This situation could occur if each star has a disk collimating its jet, and the two disks are coplanar, perhaps as a result of forming from the same cloud. But for this to be the right model, the two stars would have to be nearly identical in their luminosities and jet properties, including a difference in their N and S jets, as well as having closely aligned disks. This seems highly unlikely (see additional arguments against two stars, as described below). A model with one exciting source for the entire ionized gas distribution would seem more plausible if it could explain the spatial distribution of radio emission.
To examine the nature of the exciting star or stars in source D further, we compared the radio images with a Pa and 1.90m images of the region. The cross drawn on Figure 3a shows the peak position of the 1.90m emission. The position of the stellar source does not change when both 1.90 and 1.87m images are compared with each other. The centroids of the source at these wavelengths match to . Since the images in the these two filters were obtained back-to-back, without moving the telescope, the relative positioning should be within 10-20 milli-arcseconds. The 1.90m emission appears to coincide close to the compact component of source D2, suggesting that a single source in the vicinity of or coincident with D2 may be responsible for the ionization producing the extended radio continuum and Pa nebular emission. Alternatively, it is possible that the extinction is variable locally being responsible for a lack of 1.90m detection from source D. In the continuum image the D2 source is very bright 5.1 mJy while D1 is nearly undetected mJy. In the emission-line image, on the other hand, D1 and D2 sources have the flux of 3.70.2 and 7.8.2 mJy, respectively. If the extinction could be causing the D1 source to be hidden, then one would expect that both sources would be equally hidden in both bands, unless the P flux at the location of D1 is actually coming from something other than D1. If D1 were intrinsically as bright as D2 at 1.90m, but being hidden by extinction, then the ratio of their fluxes gives an equivalent magnitude difference of 1.9 mag due to extinction. We can make the same analysis for the hypothetical D1 source using IRAC measurements. If a point source is present at D1, then its brightness must be at least 40 times lower than the source at D2. Otherwise, we would detected the IRAC source looking slightly extended, and the position would be closer to the midpoint between D1 and D2. That means that a source at D1 must be at least 1.5-2.5 mag fainter than the source at D2.
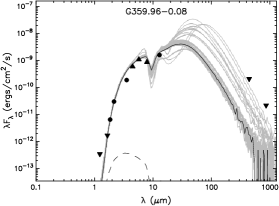
In order to characterize the properties and the evolutionary phase of the stellar source responsible for the excitation of ionized material in source D, we obtained the Spectral Energy Distributions (SEDs) of the compact source closest to D2 using measurements from 2MASS, IRAC and Pa and 1.90m of NICMOS/HST from 1.24m to 8m. The background subtracted Gaussian fitted position of the bright 1.90m source gives the following coordinates . Similarly, the peak radio position D2 at 43 GHz is at . The 1.9m fitted position gives an , offset of and 0.36′′, respectively, southeast of the peak radio emission in D2. Given the random pointing errors and absolute uncertainty in the 1.9m positions , it is likely that the 1.90m source could lie between D1 and D2 but closer to D2 by ” than to D1. Due to the poor resolution of the 12.8m continuum data, we can not identify the relative position of the continuum emission with respect to sources D1 and D2. Lastly, the IRAC GALCEN and GLIMPSE II catalogs identify the position of the IRAC source as . with a 0.2′′ and 0.3” uncertainty, respectively. The centroid of the IRAC source is shown as a triangle with an uncertainty of 0.2′′ in Figure 3a. This makes it very likely that the IRAC source corresponds to D2, and not D1. D1 and D2 could have not been separately resolved by IRAC, but if there were two sources of equal brightness, the point source would have appeared slightly more blurred and more centrally located than observed. Given the positional uncertainty, we can’t rule out the possibility of a single source that is centrally located between D1 and D2, but an association with D2 is most likely. Here, we name source D or G359.96-0.08 interchangeably between the central star and the peak of the radio emission.
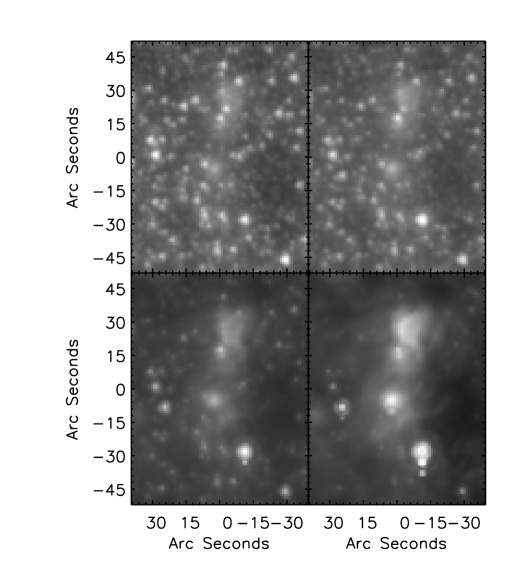
Figure 4 shows IRAC images of the Sgr A East A-D regions at 3.6, 4.5, 5.8, and 8 with Sgr A D source being saturated at 8 (Stolovy et al., 2006; Ramirez et al., 2008; Arendt et al., 2008). The associated infrared dark cloud is best seen to the west of the HII regions where submm emission is most prominent, as seen in Figure 1. D1 and D2 could have not been separately resolved by IRAC, but if there were two sources of equal brightness, the point source would appear slightly more blurred than observed. IRAC data indicate that the peak of the point source does seem to match closer to D2 than D1. We used lower limits to the saturated IRAC fluxes in the SED fitting. The SED of compact component of D2 is analyzed by comparing to a set of SEDs produced by a large grid of YSO models (Robitaille et al., 2007; Whitney et al., 2003). A linear regression fitter was used to find all SEDs from the grid of models that are fit with the assumption that the difference between the per datapoint and the per datapoint of the best fit is less than three. The physical parameters corresponding to those models are averaged along with their standard deviations. Figure 5 shows the fit to the SED of the star associated with source D or G359.96-0.08, and Table 3 gives the mean values of visual extinction, stellar mass, luminosity and temperature based on data from 2MASS, IRAC, 12.8m continuum, and upper limits at 450 and 850m. These physical characteristics are consistent with the assertion that the central star of G359.96-0.08 is a hot, massive star. This star ionizes the surrounding gas, producing thermal radio continuum with a total integrated flux of 81 and 89 mJy at 43.3 and 4.87 GHz, respectively. From the radio continuum and SED fitting using infrared continuum emission, it appears that the central star is of spectral type ranging between B0 and O9 with a luminosity V class (Vacca, Garmany, & Shull, 1996) can account for the ionization of the gas in source D, including both D1 and D2.
| Source | ||||
|---|---|---|---|---|
| D2 | 42.9 | 24.83.4 | 8.1E+04 | 3.6E+04 |
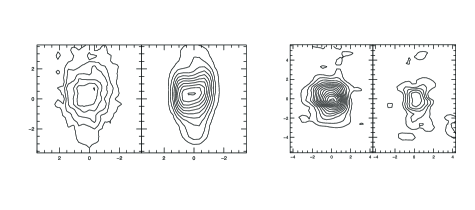
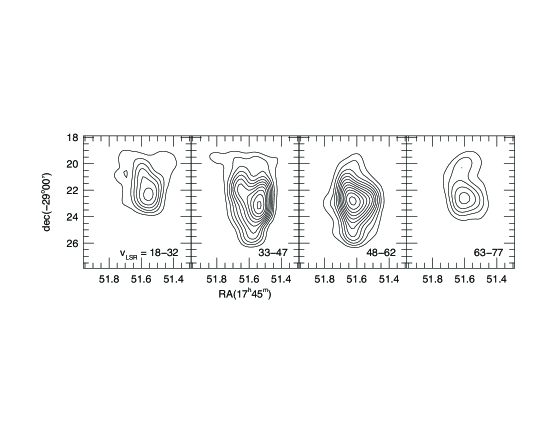
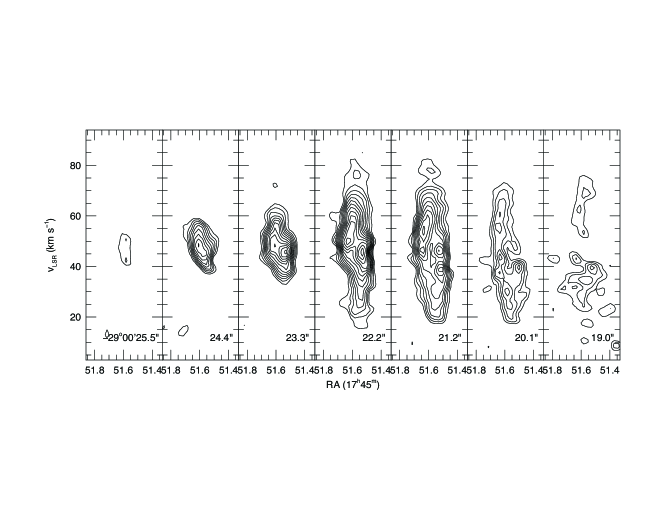
Figure 6 shows four channel maps of [NeII] line emission, each integrated over a velocity range of 15 km s-1. As is true of the radio continuum distribution, the [Ne II] emission is symmetric about a north-south line between D1 and D2, but only if the velocities are reflected about vLSR 47 km s-1. In an alternative display, the [Ne II] data cube is displayed in Figure 7 as a series of position-velocity diagrams. The panels in Figure 7 are cuts in right ascension at six different declinations, separated by 1.1″. In the cut passing at declination of , south of the peak emission, the line emission, as shown in the third panel from left, is narrow, both spectrally and spatially. The fourth panel from left shows clearly two blended peaks, one at 17h45m51.60s, and one at 51.56s. Following the naming used for the radio peaks, we will refer to them at D1 and D2. D1 peaks at vLSR = 48 km s-1, and has a red shoulder extending to 60 km s-1. D2 peaks at 45 km s-1, and has a blue shoulder extending to 35 km s-1. Going to the north, the spatial and spectral separation between D1 and D2 continues to increase, and the red and blue shoulders become more prominent. In the fifth panel from left, about 1.5″ north of the peak, at , the emission pattern forms an almost complete ring in the position-velocity diagram. All of the position-velocity diagrams show the same symmetry seen in the channel maps, being unchanged under a reflection through RA= 17h45m51.58s, and 47 km s-1.
The strong symmetry of the ionized gas kinematics about a line between D1 and D2 makes it even less likely that these peaks could be ionized by two stars or that they could be ionized by a star centered on D2. It is possible that the ionizing star lies on the line of symmetry. however, the position of the star at 1.90m shows that the source lies closer to D2 than D1.
3.2 Sgr A East HII A-C
Unlike the compact HII source D, sources A, B, and C appear rather similar, both morphologically, as seen in Figures 2a,b, and kinematically, in the [Ne II] data cube.
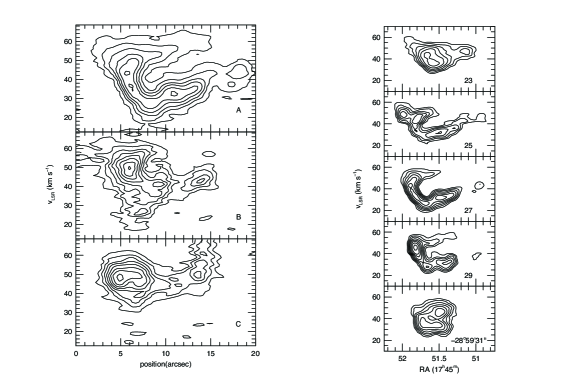
Morphologically, source A appears to have cometary structure similar to that of G29.96-0.02 (e.g. Fey et al., 1995). To test this suggestion, position-velocity diagrams of RA cuts through source A (as well as B and probably C). Figure 8a shows the position-velocity diagrams for sources A, B and C. Sources B and C appear to have smaller extents than source A both spatially and kinematically. Sources A and B appear to have cometary structure whereas source C is not resolved. The position-velocity diagrams of RA cuts through HII source A at five different declinations are shown in Figure 8b. The cuts along the northern and southern rims of the shell are narrower spectrally than the cuts passing through the center of the HII region, as shown in middle panels. The broad lines in the eastern rim of the shell and double lines near the center of the shell show a pattern that is very similar to that seen in many UC HII regions (e.g. Zhu et al., 2008). The characteristic position-velocity diagrams of several types of compact HII regions shown in Figs. 45-48 of Zhu et al. (2008), show that the kinematics of source A is clearly cometary. Position-velocity diagrams of all three sources, with 3″ wide cuts, are shown in Figure 9. The position velocity (PV) diagram for source B is similar to that for A, but shows a smaller extent in both position and velocity, so is not so well resolved. Source C may be similar, but is even less well resolved.
The PV diagrams of Figure 8 match bow shocks in which the stellar wind of an O star sweeps the ionized gas into a thin, paraboloidal shell. The position-velocity diagrams of sources B and C are very similar to that of source A. Most compact HII regions with recognizable kinematics observed in [Ne II] fall into the latter category, with the HII regions lying on the near sides of their molecular clouds, presumably because extinction through molecular clouds prevents observation of [Ne II] emission from those lying on the far sides. HII source A (as well as B and probably C) is unusual in that the orientation of its position-velocity diagram indicates that its head is tipped toward us. If it lies on the surface of a molecular cloud with its tail pointing out of the cloud, it must lie on the back side. This is somewhat surprising given the small extinction to the source. In addition, its velocity indicates that the star is moving relative to the 50 km s-1 molecular cloud. In fact, its kinematics matches very well that expected for ionized gas in a bow shock around an O star moving through molecular gas (see Wilkin, 1996; Zhu et al., 2008; Arthur & Hoare, 2006). The star is moving to the east an toward us at an angle of roughly 30∘. Perhaps this shouldn’t be surprising, given that this is the most commonly cited model for a cometary HII region, but it is not what was observed by Zhu et al., who found that most cometary HII regions are actually pressure-driven flows around stationary stars near the surfaces of molecular clouds. It seems likely that the turbulent environment near the Galactic center with high density gradient in molecular gas resulted in stars which rather quickly moved out of their natal clouds and are now drifting through lower density (and so lower extinction) molecular gas.
The ionizing stars for A, B, and C are not evident in IRAC data (see Fig. 4) . If present, they are not noticeably brighter than typical fore/background stars, nor are they located symmetrically at the centers of A-C. In stark contrast, D has an extremely bright point source. This difference alone indicates a significant difference between sources D and A-C. Additional difference between D and A-C HII regions comes from MSX observations. Source D has the extremely bright point source that is increasingly more prominent with increasing wavelength. However, the relative brightness of D drops noticeably compared to A-C when MSX data at 8 and 24m are used. This suggests a lower dust mass for D, or that the bulk of the dust is warmer.
4 Discussion
4.1 The Source of Ionization in Source D
The radio measurements indicate that D1 is optically thin at 5-44 GHz, although the slight increase in flux from D2 at higher frequencies suggests that it may be partially optically thick at the very core. The 1.9m measurements also indicate clearly a bright stellar source near the peak of the radio emission of D2. As the emission is predominantly optically thin in radio wavelengths, so adopting a distance 8 kpc and an ionized gas temperature of 8000 K, the total flux of 81 mJy at 43.3 GHz yields an estimate of the volume emission measure cm-3. The associated hydrogen recombination rate requires an ionization rate s-1, where is the hydrogen recombination coefficient into all levels but the ground state. As some ionizing photons might escape the immediate surroundings, be absorbed by dust or be absorbed very close to the exciting star, where free-free optical depth may be large, this estimate is a lower limit on the ionizing photon production rate by the central source. The parameters of the SED of this source suggest that the stellar source G359.23-0.063 is associated with a 25 M⊙ star (see Table 3) and 8 . These parameters compare well with the s-1 emitted by a O9/B0.5 star (Vacca, Garmany, & Shull, 1996). The full extent of the source in the NS direction is about 18′′. Assuming a source size of 9′′and an expansion velocity of km s-1 give an age of years (This age estimate could be a lower limit if the motion is due to flows along the surfaces of the cloud.) This presents the earliest phase of massive star formation in the 50 km s-1cloud.
The estimate for the mass of stars exciting sources A-C can not be made as the stellar source is not identified in these HII regions. However, if we assume that the A-C sources have similar masses to that of D, we can make an estimate of the total mass of stars in this regions. To compute the total cluster mass of Sgr A East, we adopt a standard broken power-law form of the IMF (Kroupa, 2001) and assume 100 M⊙ in stars above 20 M⊙ . This corresponds to a total stellar mass above 0.5 M⊙ of 940 M⊙ associated with a group of young stars in Sgr A East. Assuming that the typical age of the cluster is years, we estimate star formation rate of 0.01 to 0.001 M⊙yr-1. We can also make an estimate of the total mass of molecular gas that went into forming stars. We used 850 m images of Figure 1 to estimate the depleted gas mass by converting submillimeter flux to the mass of molecular gas. We estimate a subtracted flux of 15 Jy at 850m depleted from the region where the group of HII regions is distributed. We assumed that dust emission from the 50 km s-1 cloud was uniformly distributed inside and outside the HII regions prior the formation of stars. For a dust temperature of 20 K and a conversion factor from 850m to gas mass (Pierce-Price, 2000), we find a rough total gas mass of 7.7 M⊙ that dissipated and converted into 940 M⊙ of stars.
The near-infrared observations show that despite the ionized gas morphology suggesting a pair of compact HII region, it is probably a single source that is exciting both D1 and D2. Presumably D1 is produced by irradiation of a dense clump of gas distributed within a cavity that has been partly evacuated of lower density gas by the stellar radiation field. In this scenario, the clump has an angular diameter of AU and lies at a projected distance of AU from D2, and so intercepts approximately 10% of the ionizing photons escaping the D1 region. The observed 30 mJy flux at 43 GHz requires a total ionization rate at the clump surface of s-1 , implying that the exciting source is emitting ionizing photons at a rate s-1.
4.2 The Kinematics of Source D
We now attempt to construct a model to explain the observations of source D. In particular, we need to explain the spatial distribution of the ionized gas and infrared continuum emission, as well as the motions of the ionized gas.
The ionized gas is distributed between two sources, D1 and D2, each of which is elongated in the NS direction. It is nearly symmetric about a NS line passing between D1 and D2, but with the eastern peak, D1, lying somewhat north of the western peak, D2, with a p.a. 70∘. The infrared continuum, at both 1.9m and 12.8m shows a single peak that lies between the ionized gas peaks, but probably closer to D2. The kinematics of the ionized gas can be described by two probably related structures. A pair of spectrally broad features extend to the north from the D1 and D2 peaks. The eastern feature extends in velocity from near the molecular cloud velocity redward by about 30 km s-1. The western feature extends about 30 km s-1 blueward of the molecular cloud. Lower velocity emission is seen both north and south of the peaks, broadening both spectrally and spatially going to the north.
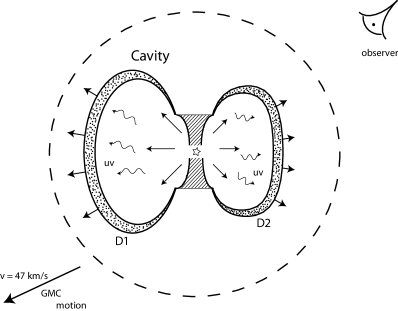
The two broad-lined emission features seem most naturally explained by a bipolar jet pair, probably interacting with the wall of a cavity. The jet could originate from a young star surrounded by a disk, lying between D1 and D2. The disk axis is tipped at a p.a. 70∘, with the west side tipped toward us, so that the western jet is blueshifted. The fact that the jets are not seen extending to the east and west of D1 and D2 indicates that the observed [Ne II] emission is not from the jets themselves, but from the region of interaction between the jets and a surrounding wall. In fact, the bright emission peaks could be simply regions of a wall which are illuminated by ionizing radiation, but the width of the emission lines indicates that jets are needed. The offset between the position of the 1.9 m continuum and the position of the axis of the symmetry of D1/D2 can also be explained by inhomogeneity of gaseous material in the vicinity of the star and/or the motion of the star. Figure 9 shows a schematic diagram of the relative location of D1, D2 and the central massive star with a flaring disk. The fact that D1 is redshifted and D2 is blueshifted could be explained if the disk is seen at an angle between edge-on and face-on, with the west side of the disk tipped toward us. The lack of symmetry in this diagram is likely the result of density gradient surrounding the star. The 50 km s-1molecular cloud lies mainly to the west of the central star.
High mass stars efficiently photoevaporate their circumstellar disks on timescales of 104 – 105 years. The piling up of the resulting disk wind as it expands against the surrounding medium could be responsible for the M⊙ of ionized material we identify as sources D1 and D2. The semianalytic photoevaporated disk-wind model of Hollenbach et al. (1994) applied to a 28 M⊙ star yields a mass flux M⊙ yr-1, indicating an age of years. The momentum of the material would be maintained by contributions from the momentum fluxes M⊙ km s-1 from each of the disk wind (,km s-1) (Drew, Proga, & Stone, 1998; Hoare, 2006) and stellar wind ( M⊙ yr-1 and v 1000 km s-1). Another potential contribution could arise from a fraction of the total momentum flux L⊙M⊙ yr-1 km s-1 in the photons emitted by the central star.
The extensions to the north could trace the regions of interaction of the jets with the cavity wall if the star is moving to the south, although it is not apparent why broad-lined emission would persist after the jets pass by. An explanation is also needed for the probable offset of the infrared continuum emission toward D2. One possibility is that the disk that collimates the jets is close enough to edge-on that it prevents a direct view of the central star even in the infrared. The near infrared continuum radiation could be scattered into our line of sight by the material that forms the ionized gas peak D2. Since D1 lies on the far side of the disk, backscattering (which would be less efficient) would be required for it D1 to be seen in scattered light. It may also be obscured by the disk if the disk extends out far enough to cover it. The 12.8m continuum is unlikely to be scattered, but it could also be affected by extinction, and it is not so convincingly offset from the center of D as is the 1.9m emission.
The spectrally narrow emission extending both north and south of the D peaks is even more difficult to explain than the broad-lined emission. The ring-like pattern seen in the position-velocity diagrams in Figure 7 could be due to gas in each cut lying on an expanding ring. The fact that the PV rings increase in spatial and velocity extent going to the north would indicate that the three-dimensional ionized gas distribution is on the surface of an expanding cone, with the expansion speed increasing to the north. Alternatively, the gas could be flowing along the surface of a cone if it is accelerating so as to make its speed increase linearly with declination. However, we cannot propose a physical model that would cause either of these flow patterns. We know of no other case of an expanding cone like what we suggest or any reason a conical wall would expand in this way. A flow along the surface of a cone seems more natural, but all cometary HII regions we have observed, with sources A-C being representative, are paraboloidal rather than conical, with much larger opening angles that in D. They also have most of their acceleration in a small distance from their vertexes. (A constant would result in , or , rather than the observed constant .) It is especially puzzling that the ionized cone has its vertex 3″ south of D, so presumably leading the ionizing star, which we think is moving in that direction. We have to conclude that we are unable to propose a consistent model for the north-south velocity of ionized gas associated with source D. The narrow-lined gas appears to be distributed on the surface of a wedge or cone with an opening angle 20∘, with its vertex 3″ south of the star.
4.3 The Kinematics of Source A
Why are cometary HII sources A-C oriented head-on, with velocity offsets indicating that their ionizing stars are moving through the 50 km s-1 molecular cloud, whereas most cometary HII regions seen in [Ne II] are seen tail-on with little stellar motion? The answer may lie in the circumstances of their formation. The location of the Sgr A East HII regions near the edge of the Sgr A East supernova remnant suggests that the ionizing stars may have formed as a result of compression of molecular gas by the SNR. If the stars formed in swept-up gas, they would have formed with the velocity of the gas. After their formation, the compressed shell would have slowed as more gas was swept up, and the stars could have drifted out of the compressed gas. The stars may now be moving through gas of low enough density that extinction does not affect the [Ne II] emission, as it would if they were still inside of a dense molecular cloud. From the orientation of its broken shell, it appears that the ionizing star of HII source A is moving to the east, as well as toward us. From the offset of its position-velocity diagram, its motion relative to the 50 km s-1 molecular cloud is 30 km s-1. The ionizing stars of sources B and C have similar motions. In particular, the position-velocity diagrams indicate that all three sources are moving toward us, while source B is moving to the east and source C is moving to the northeast.
The km s-1 velocity width of the [Neii] line is consistent with other ultra-compact Hii regions (e.g. Garay & Lizano, 1999). The characterization of a cluster of HII regions Sgr A A-D may not be correct, as these HII regions appear to be unbound due to their large physical separation, signifying isolated star formation near the Galactic center. Again, the site of on-going star formation is consistent with sites of massive star formation elsewhere (e.g. Garay & Lizano, 1999).
4.4 Conclusions
We have presented multi-wavelength observations of a chain of HII regions located at the eastern edge of the Sgr A East supernova remnant and the 50 km s-1 molecular cloud. These HII regions show the youngest star formation activity closest to the Galactic center. The youngest member of Sgr A East HII regions G359.956-0.08 or the Sgr A D source is estimated to have an age of roughly 1.5 years and consists of two elongated ionized features. We identified the central star responsible for ionizing both components of the D source. The SED fit of the central star indicates a mass of 25 M⊙ and a luminosity of 8 . The kinematics of ionized gas show a an E-W red and blue shifted flow with respect to the central star and a complex asymmetric velocity structure in the N-S direction. We presented a simple model in which the central star is surrounded by a disk constraining the flow of ionized wind. In this picture, the UV radiation from the central hot star may generate an outflow from the disk, sweeping up the ISM gas and forming the two components of ionized gas D1 and D2. Given that high density molecular material is distributed to the west, the ionized feature D2 is expected to lie closer to the central star. Future high spectral resolution observations of ionized gas and detailed modeling of the complex N-S velocity structure should explain better the kinematics of ionized gas presented here.
References
- Arendt et al. (2008) Arendt, R. G.; Stolovy, S. R.; Ramrez, S. V.; Sellgren, K.; Cotera, A. S.; Law, C. J.; Yusef-Zadeh, F.; Smith, H. A.; Gezari, D. Y. 2008, ApJ, 682, 384
- Arthur & Hoare (2006) Arthur, S. J. & Hoare, M. G. 2006, ApJS, 165, 283
- Bartko et al. (2009) Bartko, H., Martins, F., Fritz, T. K., Genzel, R., Levin, Y., Perets, H. B., Paumard, T., Nayakshin, S., Gerhard, O., Alexander, T. et al. 2009, ApJ, 697, 1741
- Benjamin et al. (2003) Benjamin, R. A., et al. 2003, PASP, 115, 953
- Cotera et al. (1999) Cotera, A. S., Simpson, J. P., Erickson, E. F., Colgan, S. W. J., Burton, M. G., Allen, D. A. 1999, ApJ, 510, 747
- dePree, Goss, & Gaume (1998) dePree, C. G., Goss, W. M. & Gaume, R. A. 1998, ApJ, 500, 847
- Drew, Proga, & Stone (1998) Drew, J. E., Proga, D. & Stone, J. M. 1998, MNRAS, 296, L6
- Fey et al. (1995) Fey, Alan L.; Gaume, Ralph A.; Claussen, Mark J.; Vrba, Frederick J. 1995, ApJ, 453, 308F
- Figer et al. (2002) Figer, D. F., Najarro, F., Gilmore, D., Morris, M., Kim, S. S., Serabyn, E., McLean, I. S., Gilbert, A. M., Graham, J. R., Larkin, J. E., Levenson, N. A., & Teplitz, H. I. 2002, 581, 258
- Garay & Lizano (1999) Garay, G. & Lizano, S. 1999, PASP, 111, 1049
- Ghez et al. (2008) Ghez, A. M., Salim, S., Weinberg, N. N., Lu, J. R., Do, T., Dunn, J. K., Matthews, K., Morris, M. R., Yelda, S., Becklin, E. E., Kremenek, T., Milosavljevic, M., & Naiman, J. 2008, ApJ, 689, 1044
- Gillessen et al. (2006) Gillessen, S., Eisenhauer, F., Quataert, E., Genzel, R., Paumard, T., Trippe, S., Ott, T., Abuter, R., Eckart, A., Lagage, P. O., Lehnert, M. D., Tacconi, L. J., & Martins, F. 2006, ApJ, 640, L163
- Goss et al. (1985) Goss, W. M., Schwarz, U. J., van Gorkom, J. H. & Ekers, R. D. 1985, MNRAS, 215, 69p
- Hollenbach et al. (1994) Hollenbach, D., Johnstone, D., Lizano, S. & Shu, F. 1994, ApJ, 428, 654
- Hoare (2006) Hoare, M. G. 2006, ApJ, 649, 856
- Hoare et al. (2007) Hoare, M. G., Kurtz, S. E., Lizano, S., Keto, E. & Hofner, P. 2007, Protostars and Planets V, p181
- Kroupa (2001) Kroupa, P. 2001, MNRAS, 322, 231
- Lacy et al. (2002) Lacy, J. H., Richter, M. J., Greathouse, T. K., Jaffe, D. T. & Zhu, Q. 2002, PASP, 114, 153
- Morris & Serabyn (1996) Morris, M. & Serabyn, E. 1996, ARA&A, 34, 645
- McKee & Ostriker (2007) McKee, C. F. & Ostriker, E. C. 2007, ARA&A, 45, 565
- Panagia (1973) Panagia, N. 1973, AJ, 78, 929
- Pierce-Price (2000) Pierce-Price, D., Richer, J. S., Greaves, J. S., Holland, W. S., Jenness, T., Lasenby, A. N., White, G. J., Matthews, H. E., Ward-Thompson, D., Dent, W. R. F., Zylka, R., Mezger, P., Hasegawa, T., Oka, T., Omont, A., & Gilmore, G. 2000, ApJ, 545, L121
- Ramirez et al. (2008) Ramirez, S. V., Arendt, R. G., Sellgren, K., Stolovy, S. R., Cotera, A., Smith, H. A., & Yusef-Zadeh, F. 2008, ApJS, 175, 147
- Reid & Brunthaler (2004) Reid, M. J., & Brunthaler, A. 2004, ApJ, 616, 872
- Robitaille et al. (2007) Robitaille, T. P., Whitney, B. A., Indebetouw, R., & Wood, K. 2007, ApJS, 169, 328
- Shu, Adams, & Lizano (1987) Shu, F. H. & Adams, F. C. & Lizano, S. 1987, ARA&A, 25, 23
- Serabyn, Lacy, & Achtermann (1992) Serabyn, E., Lacy, J. H., & Achtermann, J. M. 1992, ApJ, 395, 166
- Stolovy et al. (2006) Stolovy, S., et al. 2006, Journal of Physics Conference Series, 54, 176
- Tsuboi et al. (2009) Tsuboi, M., Miyazaki, A. & Okumura, S. K. 2009, PASJ, 61, 29
- Vacca, Garmany, & Shull (1996) Vacca, W. D., Garmany, C. D. & Shull, J. M. 1996, ApJ, 460, 914
- Wang et al. (2010) Wang, Q. D., Dong, H., Cotera, A., Stolovy, S., Morris, M., Lang, C. C., Muno, M. P., Schneider, G. & Calzetti, D. 2010, MNRAS, 402, 895
- Wardle & Yusef-Zadeh (2008) Wardle, M. & Yusef-Zadeh, F. 2008, ApJ, 683, L37
- Whitney et al. (2003) Whitney, B. A., Wood, K., Bjorkman, J. E., & Cohen, M. 2003a, ApJ, 598, 1079
- Wilkin (1996) Wilkin, F. P. 1996, ApJ, 459, L31
- Yusef-Zadeh & Morris (1987) Yusef-Zadeh, F. & Morris, M. 1987, ApJ, 320, 545
- Yusef-Zadeh et al. (1989) Yusef-Zadeh, F., Telesco, C. M. & Decher, R. 1989, IAU Symp. 136, Ed: Mark Morris, Kluwer Academic Publishers, Dordrecht, p.287
- Yusef-Zadeh & Wardle (1993) Yusef-Zadeh, F. & Wardle, M. 1993, ApJ, 405, 584
- Zhu et al. (2008) Zhu, Q-F.; Lacy, J. H., Jaffe, D. T., Richter, M. J. & Greathouse, T. K. 2008, ApJS, 177, 584
- Zinnecker & Yorke (2007) Zinnecker, H. & Yorke, H. W. 2007, ARA&A, 45, 481