Response of a bolometer to particles
Abstract
crystals are used as bolometers in experiments searching for Double Beta Decay without emission of neutrinos. One of the most important issues in this extremely delicate kind of experiments is the characterization of the background. The knowledge of the response to particles in the energy range where the signal is expected is therefore a must. In this paper we report the results on the response function of a bolometer to ’s emitted by 147Sm dissolved in the crystal at the growth phase. A Quenching Factor of () is found, independent of the temperature in the investigated range. The energy resolution on peaks shows a standard calorimeter energy dependence: . Signal pulse shape shows no difference between and / particles.
keywords:
Bolometers; Quenching Factor; ; Double Beta Decay1 Introduction
Bolometric detectors [1, 2] are used in particle physics experiments to search for rare events like Neutrinoless Double Beta Decay and Dark Matter interactions. They are sensitive calorimeters operated at 10 mK that measure the temperature rise produced by the energy deposited in particle interactions.
An array of bolometers made of crystals has been used in the CUORICINO experiment [3, 4] to search for the Neutrinoless Double Beta Decay of 130Te. A precise knowledge of the response function of these bolometers to each species of particles ( and ) is important for the background rejection. Indeed, a sizeable fraction of the background in the Double Beta Decay Region of Interest (RoI), that for 130Te is around 2.5 MeV [5, 6], is due to degraded particles that lose part of their energy in the detector support structure and the rest in a single bolometer mimicking a signal event.
While the response of crystals to interactions up to 2.6 MeV is well known from the routine calibrations performed with Th radioactive sources, there are still relevant items that should be addressed for particles. The most important are the Quenching Factor (QF), the relative energy resolution and, finally, possible signal shape differences with respect to interactions particularly in the region where the signal is expected.
The QF is defined as the amplitude ratio between the signal produced by an particle and the one produced by an electron depositing the same energy in the detector. It is expected to be very close to unity in thermal detectors since any kind of energy deposition should be converted into heat.
The ’s that can be normally measured in the bolometer are either coming from decays inside the crystals or by interactions induced by external sources. Those coming from internal contaminations (usually from U and Th chains) have energies higher than 4 MeV, well above the Double Beta Decay region of interest.
The QF for particles in the energy region [5.7-8.8] MeV was measured in detectors [7] using a 228Ra radioactive source. It was found to be . No deviation from constancy of QF as a function of energy has been observed. Nevertheless this measurement is based on an extrapolation of the calibration function at energies well above the region attainable with a Th source (2.6 MeV), where non-linearities of the bolometers play an important role [8].
In this work we studied the response of bolometer to an internal source producing monochromatic particles with energy close to the Q-value of 130Te Neutrinoless Double Beta Decay. We achieved this goal dissolving into a TeO2 crystal a small amount of natural samarium. The naturally occurring isotope 147Sm has an isotopic abundance of [11] and an half life of y [11]. To have a reasonable decay rate (count/hour) the crystal should contain only a few micrograms of natural Sm.
The particles are emitted in the 147Sm Nd + transition. The Q-value of this reaction is shared between the emitted particle and the recoiling nucleus. Since the decay is contained within the crystal, we measure the full transition energy of keV [11, 12].
Beside the obvious advantage of measuring the response in the actual RoI, an additional yet extremely relevant feature is present and could be fruitfully exploited. Bolometers, in fact, require a continuous monitoring of the operating temperature. Even tiny drifts can induce variations of the thermal gain, thus spoiling the energy resolution. To correct for this effect, a Si resistor (heater) glued to the detector surface produces heat pulses by Joule dissipation which are very similar to particle induced pulses and the temperature drift can be corrected offline on the basis of the measured heater pulse amplitude variation [9, 10]. Heaters however can experience electronic failures or grounding problems, resulting in changes of their pulse amplitude not related to temperature drifts. This calls for a frequent re-calibration of the entire system that is obviously a long time subtracted to physics data taking.
The presence of a long-lived monochromatic line in the proximity of the RoI could take the role of the heater and allows less frequent calibrations.
2 Doping of crystal with an -particle emitter
Two methods are currently used for growing crystals: Czochralski and Bridgman. The growth is rather difficult, special temperature gradient conditions as well as pulling and/or rotating rates being needed in order to obtain high quality crystals. Further post-growth thermal treatments are applied to the as grown ingots aimed at quenching the tendency of single crystals to cracking caused by high anisotropy of thermal coefficients. Inhomogeneities in the crystal due to the incorporation of Pt dissolved from the crucible is another problem frequently reported [14] and careful control of convection currents in the melt is needed to avoid the incorporation of the gas bubbles to the crystals, especially in the case of Czochralski growth.
crystals do not easily permit impurities inclusion in the lattice. The paratellurite structure, especially the asymmetric covalent Te-O bonds, limits the incorporation of the dopants to extremely low levels which results in very low segregation coefficients (k10-2). To avoid precipitation or aggregation of foreign ions during crystal growth only small amounts of dopant can be added to the melt and the resulting built-in concentration is often below the limit for chemical analysis [14]. Only a few successful doping of are reported in literature for ions like Fe or Cr [15] and Mg, Mn, Nb, Zr [16]. As a general rule for selecting the dopant, two criteria should be taken into consideration: radioactive properties of the nuclide and the incorporation to the host lattice of the ion.
In our particular case, where the detector has to be applied to the search for very rare events, supplementary constraints are imposed on the radio-purity of the chemical compound used for the doping. Moreover, for cryogenic applications of crystals, the incorporation of uneven ions in the lattice is to be avoided because of the possible problems of cooling paramagnetic materials at very low temperatures.
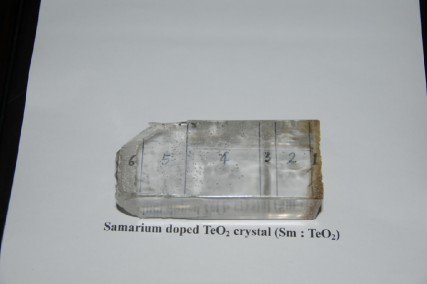
The Sm doped crystal reported in the present work was grown by a modified Bridgman method described in detail in [17]. For the growth, 6N purity powder was used. Tellurium oxide raw material was synthesized at SICCAS, Shanghai China, in a process described in detail in [18]. The crystal was grown in a dedicated furnace used for R&D purpose where ingots of typically 30 x 25 x 120 mm can be obtained. The crystal growth followed the protocol described in detail in [19]. Sm dopant was added to the raw material powder in oxide form using Sm2O3 powder of 6N purity. The doping process was performed in two steps. The Sm2O3/ powder was first melted in order to obtain an ingot of homogeneous oxides mixture from which a small sample was taken and used as dopant for the final crystal growth with a nominal dopant concentration of 510-6 g/g of Sm2O3/ . A charge of approximately 400 g (crystal seed excluded) was used for the final growth which resulted in an ingot of approximately 65 cm3. The grown ingot was colorless and free of cracks, bubbles and/or inclusions except for a small region due to a thermal instability during the growth process (see Fig. 1). It was subjected to special post-growth thermal treatment in order to avoid cracks during mechanical processing. A sample of approximately 30x24x28 mm3 (m=116.65 g) was extracted for cryogenic measurement from the region no.4 of the as grown crystal. The sample was cut and X-ray oriented with a precision better than 0.5∘ following the procedure described in [19] except for the chemical etching. Different samples were taken from each region (1 to 6) for ICP-MS measurements aimed at checking the general quality of the crystal and especially the uniform distribution of dopant along the growth direction. ICP-MS measurements were made using an "Agilent Technologies 7500 Series" instrument [19]. The measurements were made on samarium isotopes free of instrumental interferences: 149Sm, 152Sm and 154Sm. For each isotope the Sm concentration was inferred assuming the natural abundance. The mean value is found to be of the order of 30 ppb which gives for the 116.65 g sample approximately 3.5 g Sm.
3 Experimental set-up and Data Acquisition
The Sm doped crystal was operated in a cryogenic setup located deep underground in the Hall A of National Laboratory of INFN at Gran Sasso.
The crystal was equipped with two Neutron Transmutation Doped Ge thermistors (NTD) [20] of 331 mm3, thermally coupled to the crystal surface with 9 epoxy glue spots (0.8 mm diameter). The electrical conductivity of NTD, which is due to variable range hopping (VRH) [21] of the electrons, depends strongly on the temperature. The resistance changes with temperature according to [22]
| (1) |
and then resistance variation can be used to measure effectively the heat signal produced by interacting particles. The and of the two NTDs were measured to be respectively 1 and 3K. At the working temperature of 10 mK the value of R is 100 M.
A resistor of 300 k, realized with an heavily doped meander on a 2.332.40.6 mm3 silicon chip, was glued to the crystal and used as a heater to stabilize the gain of the bolometer.
The crystal was mounted in an Oxygen Free High Conductivity (OFHC) copper structure and kept in position by PTFE tips. The L shape of the PTFE pieces was chosen to profit from the high thermal contraction of the Teflon keeping tightly the crystal.
Finally, the detector was mounted and operated at 10 mK, cooled by an Oxford 1000 3He/4He dilution refrigerator. The crystal holder was mechanically decoupled from the cryostat in order to minimize noise vibrations induced by the cryogenic facility. A weak thermal coupling between the mixing chamber of the dilution refrigerator and the crystal holder was realized by means of thin high conductivity copper strips. The holder was also equipped with one NTD thermometer and one heater. In this way it was possible to stabilize the temperature of the crystal holder using a feedback device [23].
The cryostat was heavily shielded both internally and externally in order to decrease the background on the detector coming from radioactive materials. Below and above the detector there was a 10 cm thick layer of low-activity ancient Roman lead [24, 25]. Around the sides of the detector holder an additional 1.2 cm thick cylindrical Roman lead shield was present. The cryostat was surrounded by an additional external shielding composed by 10 cm low-activity lead, 10 cm standard lead followed by 10 cm borated polyethylene. The latter allows to reduce the neutron flux on the detector thanks to the high efficiency in thermalizing fast neutrons and to the high neutron capture cross section for thermal neutrons of 10B. The entire setup was enclosed in a Faraday cage to reduce electromagnetic interference.
The thermistors were biased through two room temperature 27 G load resistors. The large ratio between their resistances and those of the thermistors allows to have negligible parallel noise.
The read-out of the thermistors was performed through a room temperature DC coupled differential front-end [26] followed by a second stage of amplification both located on the top of the cryostat. After the second stage, and close to the DAQ (a 18 bit NI-PXI 6284 ADC unit), a 6 pole roll-off active Bessel filter acted as antialiasing filter.
The entire waveform of each triggered pulse was sampled with a rate of 1 kHz and recorded. The typical bandwidth is approximately 10 Hz, with signal rise and decay times of order of 40 and 200 ms, respectively.
The two thermistors are read by independent electronic channels and will be denoted in the following as Channel 1 and Channel 2.
4 Data Analysis and Results
Two separate sets of data have been collected at different holder temperatures (run1: 10 mK, run 2: 15 mK ) in order to investigate possible temperature dependencies of the Quenching Factor and differences of the pulse shape between and particles.
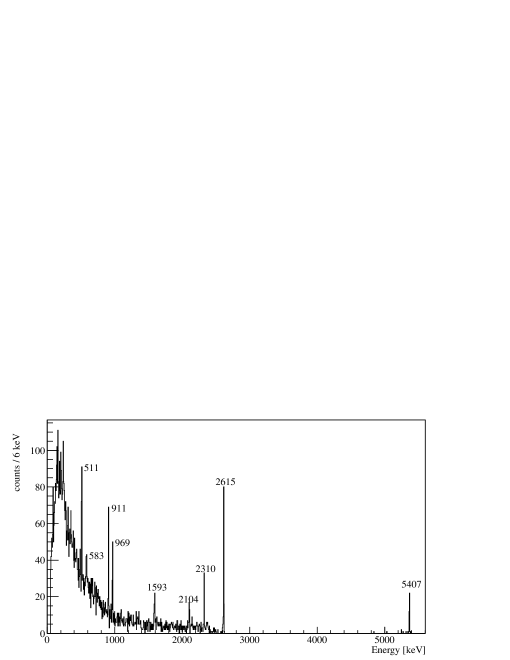
The energy calibration is performed using four 232Th sources inserted inside the external lead cryostat shield. The pulse amplitude (A) is estimated by means of an Optimum Filter technique [27]. The Channel 1 calibration spectrum in run 1 is shown in Fig. 2. Gamma lines from the 232Th decay chain are visible in the spectrum and listed in Table 1. The 147Sm line is also clearly visible as well as another line at 5.407 MeV from 210Po. This contamination originates during the crystal growth. The line from 210Po is not considered in our QF calculation since it lies in an energy region where the calibration is not reliable at the desired level of accuracy.
The calibration peaks are fitted using a Gaussian function + linear background.
| Isotope - source | Energy [keV] |
|---|---|
| e+ e- annihilation | 511.0 |
| 208Tl | 583.2 |
| 228Ac | 911.2 |
| 228Ac | 968.9 |
| 2614.5 keV DE | 1592.5 |
| 2614.5 keV SE | 2103.5 |
| 208Tl | 2614.5 |
The calibration function is a third order polynomial with zero intercept. The Quenching Factor is extracted from a simultaneous fit to the ’s and the line adding the QF as a free additional parameter. To properly take into account uncertainties on fitted amplitudes (Ai) and transition energies (Ei), the following likelihood function has been minimized:
| (2) |
where the index runs over the calibration peaks, P(A) is the polynomial calibration function to be estimated and is computed as:
| (3) |
The QF calculated for both channels and runs is reported in Table 2. The correlation between the QFs has been evaluated on the energy distribution of coincidence events in the peak, recorded simultaneously by the two channels. Taking into account the full covariance matrix, a and QF = is found for run1 and run2 respectively. The error is dominated by the uncertainty on the 147Sm Q-value. No temperature dependence is observed; the average QF is .
| Run | Channel | QF | QF error |
|---|---|---|---|
| 1 | 1 | 1.0076 | 0.0007 |
| 1 | 2 | 1.0075 | 0.0007 |
| 2 | 1 | 1.0078 | 0.0007 |
| 2 | 2 | 1.0075 | 0.0007 |
4.1 Energy Resolution and Pulse Shape
We have performed a study on the dependence of the energy resolution of the (232Th) and the (147Sm and 210Po) peaks as a function of energy.
The Optimum Filter [27], used for amplitude estimation, reduces the noise superimposed to the signal, maximizing the signal to noise ratio. The ultimate resolution is governed by the noise at the filter output, and does not depend on the pulse amplitude. We estimated this resolution, , on data samples recorded randomly and without triggered events.
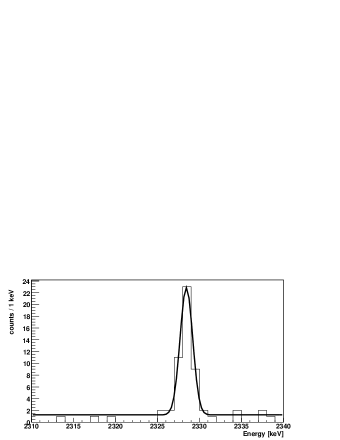
The energy resolution of and heater peaks has been calculated with Gaussian + linear background fits (see for example the fit on the 147Sm line in Fig. 3). The quantity is shown as a function of energy in Fig. 4. The squared heater resolution (black triangle) is well consistent with (dashed line), indicating that no physical process other than the noise contributes to it. On the other end, the resolution of lines lies above and exhibits a dependence on the energy.
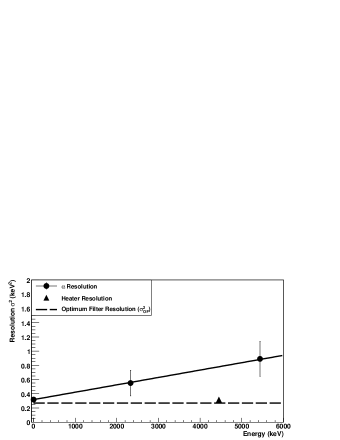
A linear fit on the points of Fig. 4 is performed, assuming that the resolution at zero energy is equal to the heater resolution () with the corresponding error. The energy dependence of the resolution is well in agreement with the behavior of a calorimeter, where not all the energy is eventually collected:
This behaviour indicates that in a macrobolometer, where all the energy is expected to be transformed into heat and measured, some phenomena are responsible for a missing part. We performed the same analysis on Channel 2 and found a consistent energy dependence: .
A more intriguing feature emerges from the energy resolution measured on the 208Tl line. Its value is worse than the one of an line of equivalent energy:
The crystal is however too small and the statistics too limited to allow a detailed study of the energy resolutions of the / branch.
We investigated the difference in pulse shape between and / particles. In bolometric detectors the shape of the signal is not constant with energy as detailed in [8]. Shape parameters, therefore, have been compared for events in the 147Sm peak ([2320-2334] keV) and in the sideband regions ([2200-2320] keV, [2340-2460] keV), mainly populated by /’s.
The rise and decay times, computed as the time difference between the 10% and the 90% of the leading edge and the 90% and 30% of the trailing edge respectively, are reported in Table 3. The error is dominated by the resolution of the sampling period. No difference is found within the error.
| Particle | Rise Time [ms] | Decay Time [ms] |
|---|---|---|
| 49.0 0.4 | 219.6 0.4 | |
| / | 49.0 0.4 | 219.9 0.4 |
5 Conclusions
We characterized the response function of a bolometer to particles with energy close to the Q-value of the 130Te Neutrinoless Double Beta Decay. To achieve this goal we dissolved into a TeO2 crystal a small amount of natSm at the growth phase.
A Quenching Factor for particles of () is found, independent of the temperature in the investigated range.
The energy resolution on peaks shows a standard calorimeter energy dependence: . Resolution on a peak is found to be worse compared to an line of equivalent energy, but the crystal is too small and the statistics too limited to draw any conclusion. Signal pulse shape shows no difference between and / particles.
Finally, the presence of a long-lived monochromatic line in the proximity of the 130Te Double Beta Decay RoI, could be used to correct thermal gain variation thus allowing less frequent calibrations.
References
- [1] S.Simon, Application of Low Temperature Calorimetry to Radioactive Measurements, Nature, 135, (1935) 763.
- [2] E.Fiorini, T.Niinikoski, Low Temperature Calorimetry For Rare Decays, Nucl. Instr. Meth. 224 (1984) 83.
- [3] C.Arnaboldi et al., CUORE: a cryogenic underground observatory for rare events, Nucl. Instr. Meth. A 518 (2004) 775.
- [4] C.Arnaboldi et al., Results from a search for the -decay of 130Te, Phys. Rev. C 78 (2008) 035502.
- [5] N.D. Scielzo et al., Double-beta decay Q values of 130Te, 128Te, and 120Te, Phys. Rev. C 80 (2009) 025501.
- [6] M. Redshaw, B. J. Mount, E. G. Myers, F. T. Avignone III, Masses of 130Te, 130Xe and double beta-decay Q-value of 130Te, Phys. Rev. Lett. 102 (2009) 212502.
- [7] A. Alessandrello et al., The thermal detection efficiency for recoils induced by low energy nuclear reactions, neutrinos or weakly intercating massive particles, Phys. Lett. B 408 (1997) 465.
- [8] M.Vignati, Model of response function of large mass bolometric detectors, Journal of Applied Physics 108 (2010) 8.
- [9] A. Alessandrello et al., Mehods for response stabilization in bolometers for rare decays, Nucl. Instr. Meth. A 412 (1998) 454.
- [10] C. Arnaboldi et al., A programmable calibrating pulse generator with multi-outputs and very high stability, IEEE Trans. Nucl. Sci. 50 (2003) 979.
- [11] S.Y.F. Chu, L.P. Ekström, R.B. Firestone, WWW Table of Isotopes http://nucleardata.nuclear.lu.se/NuclearData/toi/ .
- [12] M.C. Gupta, R.D. MacFarlane, The Natural Alpha Radioactivity of Samarium, J. Inorg. Nucl. Chem. 32 (1970) 3425.
- [13] J. Liebertz, Einkristallzüchtung von Paratellurit (TeO2), Kristall und Technik 4 (1969) 221.
- [14] I. Földvári et al., The role of impurities in the quality of paratellurite single crystals, Journal of Crystal Growth 52 (1981) 561.
- [15] I. Földvári et al., Optical absorption of chromium doped paratellurite, Phys. Lett. A 109 (1985) 303.
- [16] I. Dafinei et al., Growth of pure and doped crystals for scintillating bolometers, Nucl. Instr. Meth. A 554 (2005) 195.
- [17] J. Xu, S.Fan, B. Lu, Growth of 4 Li2B4O7 single crystals by multi-crucible Bridgman method, Journal of Crystal Growth 264 (2004) 260.
- [18] Y. Chu et al., Growth of the high quality and large size paratellurite single crystals, Journal of Crystal Growth 295 (2006) 158.
- [19] C. Arnaboldi et al, Production of high purity single crystals for the study of neutrinoless double beta decay, Journal of Crystal Growth 312 (2010) 2999.
- [20] E.E. Haller et al., Neutron transmutation doping of semiconducting materials, edited by R. D. Larrabee (Plenum Press, New York, 1984) 21.
- [21] A. Miller, E. Abrahams, Impurity conduction at low concentrations, Phys. Rev. 120 (1960) 745.
- [22] K. M. Itoh et al., Hopping Conduction and Metal-Insulator Transition in Isotopically Enriched Neutron-Transmutation-Doped 70Ge:Ga, Phys. Rev. Lett. 77 (1996) 4058.
- [23] C. Arnaboldi et al., CUORICINO: an array of macro bolometers, IEEE Trans. Nucl. Sci. 52 (2005) 1630.
- [24] A. Alessandrello et al., Measurements on radioactivity of ancient roman lead to be used as shield in searches for rare events, Nucl. Instr. Meth. B 61 (1991) 106.
- [25] A. Alessandrello et al., Measurements of internal radioactive contamination in samples of Roman lead to be used in experiments on rare events, Nucl. Instr. Meth. B 142 (1998) 163.
- [26] C. Arnaboldi et al., The programmable front-end system for CUORICINO, an array of large-mass bolometers, IEEE Trans. Nucl. Sci. 49 (2002) 2440.
- [27] E.Gatti, P.F. Manfredi, Processing the signals from solid state detectors in elementary particle physics, Riv. Nuovo Cim. 9N1 (1986) 1.