Vol.0 (201x) No.0, 000–000
22institutetext: The National Astronomical Observatories, 20A Datun Road, Beijing 100012, China
On the fairness of the main galaxy sample of SDSS
Abstract
Flux-limited and volume-limited galaxy samples are constructed from SDSS data releases DR4, DR6 and DR7 for statistical analysis. The two-point correlation functions , monopole of three-point correlation functions , projected two-point correlation function and pairwise velocity dispersion are measured to test if galaxy samples are fair for these statistics. We find that with increment of sky coverage of SDSS, of flux-limited sample is extremely robust and insensitive to local structures at low redshift. But for volume-limited samples fainter than at large scales , deviation of and of DR7 to those of DR4 and DR6 increases with larger absolute magnitude. In the weakly nonlinear regime, there is no agreement between of different data releases in all luminosity bins. Furthermore, of volume-limited samples of DR7 in luminosity bins fainter than are significantly larger, and of the two faintest volume-limited samples of DR7 display very different scale dependence than results of DR4 and DR6. Our findings call for cautions in understanding clustering analysis results of SDSS faint galaxy samples, and higher order statistics of SDSS volume-limited samples in the weakly nonlinear regime. The first zero-crossing points of of volume-limited samples are also investigated and discussed.
keywords:
galaxies: distances and redshifts — galaxies: statistics — cosmology: observation — cosmology: large-scale structure1 Introduction
Clustering analysis of galaxy samples thrives for the availability of modern massive galaxy surveys. The two mostly successful and biggest galaxy surveys to date are the two-degree field galaxy redshift survey (2dFGRS, Colless et al., 2003) and the Sloan Digital Sky Survey (SDSS, York et al., 2000). The final data release of the 2dFGRS offers 3-D mapping of roughly a quarter of million galaxies, the SDSS achieves spectra of million galaxies (Abazajian et al., 2009). The unprecedented number of galaxies and enormous volume surveyed by SDSS defines its unique role in the era of precision cosmology (Komatsu et al., 2010), by its power spectra and the two-point correlation functions (2PCF) at large scales (e.g. Tegmark et al., 2004; Eisenstein et al., 2005; Percival et al., 2010; Reid et al., 2010).
Another highly appreciated application of clustering analysis of galaxies is to relate galaxy distribution to dark matter and halos, aiming at inferring processes galaxies experienced during their formation and evolution. Interpretation of statistics of galaxy samples provided by SDSS prevails in category of the CDM+halo model and relevant extensions such as the halo occupation distribution (HOD, e.g. Berlind & Weinberg, 2002; Kravtsov et al., 2004; Zheng et al., 2005) and the conditional luminosity function (CLF, Yang et al., 2003). For example, works of Zehavi et al. (2002, 2005, 2010) systematically explored the luminosity and color dependence of galaxy 2PCFs and extensively quantified HOD parameters of galaxies; Cooray (2006) derived the occupation of central and satellite galaxies in halos and their corresponding conditional luminosity functions from a compilation of correlation functions of SDSS, attempting to draw clues of galaxy evolution with reference to high redshift samples; Li et al. (2007) rather directly compared projected correlation functions and the pairwise velocity dispersion (PVD) of SDSS with those of mock galaxy samples populated from N-body simulations by semi-analytic models (SAM) of Kang et al. (2005) and Croton et al. (2006), they find that SAM can roughly reproduced observed clustering of SDSS galaxies but have to reduce faint satellite fraction in massive halos in the prescription of SAM by percent to resolve discrepancies in PVD.
Yet there are challenges to the fairness of SDSS galaxy samples, i.e. whether galaxy samples of SDSS are complete and have enough volume to be a fair representation of the Universe. In fact prudence in reading out physics from measured statistics especially correlation functions has been called, Nichol et al. (2006) disclosed that exclusion of the Sloan Great Wall (at , Gott et al., 2005) would change the 2PCF by and the three-point correlation function (3PCF) by as much as of the sample defined by the r-band absolute magnitudes . The apparent influence of super structures on estimated correlation functions at large scales is somehow against intuition since one already takes it for granted that the SDSS galaxy sample’s depth and sky coverage is sufficient to accomplish homogeneity, spatial averaging would suppress the variance induced by a particular structure in a small patch of sky. Sylos Labini et al. (2009) noticed that the zero-crossing point of 2PCF of SDSS main galaxy sample varies with luminosity and sample depth, and anti-correlation is absent in the mostly recent measured 2PCF of SDSS luminous red galaxy (LRG) sample (e.g. Martínez et al., 2009; Kazin et al., 2010). By the extreme-value statistical analysis, Antal et al. (2009) purport that either the SDSS suffers from severe sample volume dependent intrinsic systematical effects or there is persistent density fluctuation not fading away over scales beyond standard CDM model prediction.
It is therefore important for one to check the fairness of galaxy samples used in order to endorse the confidence of relevant analysis. It is understood that fairness means differently for different statistics and also samples constructed in various ways. Zehavi et al. (2010) have laboriously evaluated finite volume effects and impact of super structures, they compared 2PCFs of volume-limited galaxy sub-samples in full depth with of the same sub-sample but limited in a smaller volume overlapped with the volume-limited sub-sample defined in the luminosity bin one dex lower. Their experiment leads to the conclusion that finite volume effects are insignificant for anisotropic and projected 2PCFs in nonlinear regime for their sub-samples of luminosity higher than . But they then find that including faint galaxies causes weird regulation to 2PCF, which is similar but of smaller amplitude to the discovery in Zehavi et al. (2005) using an early release of SDSS. We notice that such analysis for galaxies of luminosity lower than is missed though 2PCF of their faintest sub-sample is adopted for estimation of biasing and HOD parameters.
These works mainly concentrate on changes to two-point statistics by altering sample depth, we rather check the fairness by sky coverage enlargement, not only of 2PCFs but also of monopole of 3PCFs in redshift space, projected 2PCFs and PVDs. There are data releases 4, 6 and 7 of SDSS main galaxy catalogue (DR4, DR6 and DR7 by Adelman-McCarthy et al., 2006, 2008; Abazajian et al., 2009, respectively), the increment of sky coverage from DR4 to DR6 is roughly the same from DR6 to DR7. An advantage to investigate effects of sample volume on correlation function by sky angular coverage other than survey depth is that the restriction of apparent magnitudes of the survey definition limits permitted range of depth adjustment, in particular for those faint galaxies which are visible only at low redshift and support very shallow sample space. And one of our purpose is to see how correlation function evolves naturally with the progress of a real survey.
Section 2 describes SDSS data and estimation methods of statistics we used, results are shown in section 3, the last section is of summary and discussion.
2 Galaxy Samples and Estimation of Correlation Functions
2.1 sample construction

The safe galaxy sample of the New York University Value-Added Galaxy Catalog (NYU-VAGC, Blanton et al., 2005) 111http://sdss.physics.nyu.edu/vagc is a catalog of low redshift galaxies (mostly below ) defined by apparent magnitudes of . Three data releases in chronological order are selected, namely DR4, DR6 and DR7, which spectroscopic surveyed areas are about , and square degrees respectively. As spectroscopic coverage of SDSS is not uniform, we use only those regions of spectroscopic completeness greater than . We did not perform fibre collision correction to improve completeness, the correction only becomes significant at scales Mpc for SDSS galaxies (Zehavi et al., 2002). To ensure the correct geometry, galaxies in the three catalogues are also filtered with their own accompanied survey windows, bright star masks and completeness masks.
Flux-limited samples defined by r-band apparent magnitude range and redshift are generated. Consequently we obtain galaxies in DR4, in DR6, and in DR7. In order to explore influence of local galaxies on correlation functions, we also constructed confined flux-limited galaxy samples by near-end redshift cut of . Volume-limited sub-samples are also produced in consecutive luminosity bins starting from to in step of 0.5 magnitude and bin width of one magnitude, the absolute magnitude in NYU-VAGC is corrected to redshift and is corrected, but e-correction is not taken into account. We noticed that there are some galaxies having different apparent magnitudes in DR7 than in early data releases, so we constrcuted a couple of additional volume-limited samples from DR7 but filtered with masks of DR4 for comparison, measurements indicate that such differences have little influence on statistics employed.
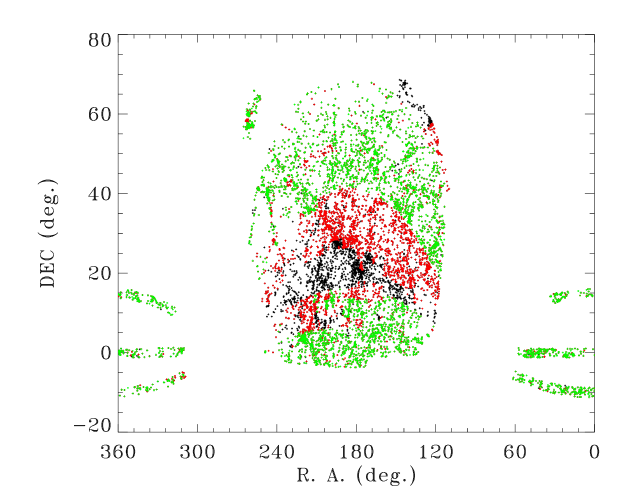
Details of these samples are shown in Tables 1 & 2 and Figure 1, comoving distances of galaxies are calculated in a flat CDM universe with , and .
| 0.010 | 0.037 | 0.046 | 0.071 | |
|---|---|---|---|---|
| DR4 | 300,661 | 281,400 | 268,247 | 216,373 |
| DR6 | 447,407 | 417,426 | 397,543 | 321,915 |
| DR7 | 535,845 | 498,445 | 473,980 | 382,921 |
| Label | Luminosity | redshift | comoving distance | number of galaxies | ||||||
|---|---|---|---|---|---|---|---|---|---|---|
| DR4 | DR6 | DR7 | ||||||||
| VL1 | 0.011 | 0.029 | 33.89 | 87.31 | 4,223 | 6,389 | 8,219 | |||
| VL1+ | 0.014 | 0.037 | 42.53 | 108.95 | 7,292 | 11,543 | 14,343 | |||
| VL2 | 0.018 | 0.046 | 53.32 | 135.61 | 11,639 | 18,328 | 22,500 | |||
| VL2+ | 0.022 | 0.057 | 66.77 | 168.27 | 19,209 | 29,463 | 35,932 | |||
| VL3 | 0.028 | 0.071 | 83.51 | 207.96 | 31,807 | 47,565 | 57,363 | |||
| VL3+ | 0.035 | 0.087 | 104.24 | 255.70 | 50,719 | 75,162 | 89,654 | |||
| VL4 | 0.044 | 0.107 | 129.83 | 312.96 | 59,215 | 87,295 | 103,924 | |||
| VL4+ | 0.054 | 0.131 | 161.21 | 381.91 | 60,132 | 89,602 | 107,207 | |||
| VL5 | 0.068 | 0.160 | 199.41 | 462.71 | 46,264 | 69,499 | 82,239 | |||
| VL5+ | 0.083 | 0.194 | 245.46 | 555.88 | 24,002 | 36,677 | 43,631 | |||
2.2 Estimation of correlation functions
2.2.1 Redshift space correlation functions
Isotropic 2PCF of separation in redshift space is measured with the estimator of Landy & Szalay (1993),
| (1) |
in which , and are respectively the normalised numbers of weighted galaxy-galaxy, random-random and galaxy-random pairs at given separation. To proceed the estimation with Eq. 1, corresponding random sample is generated following distributions of redshift, magnitude, geometric constraints, spectroscopic completeness and survey masks of each individual galaxy sample but with 20 times of numbers of points. Each galaxy and random point is assigned a weight according to their redshift and angular position to minimize the variance in estimated (Efstathiou, 1988; Hamilton, 1993),
| (2) |
where is the selection function at the location of th galaxy, is the mean number density, and . The is computed using a power-law with correlation length and (Zehavi et al., 2002).
Calculation of 3PCFs of all those galaxy samples lasts too long, we turn to measure the monopole of the 3PCF instead (Pan & Szapudi, 2005), which is a degenerated version of 3PCF defined as
| (3) |
and estimated via
| (4) |
where combined symbols of D and R are normalized numbers of triplets counted within and between data sets of galaxies and random points, e.g. if the number of galaxies around galaxy in bin is , in bin is , the in Eq. 4 reads
| (5) |
2.2.2 Projected 2PCF and PVD
To minimize the effect of redshift distortion due to galaxy’s peculiar motion, the separation (or in real space) is divided into two components, the parallel part and the perpendicular part with respect to line-of-sight, the anisotropic 2PCF is measured on grids of . Integration of over then yields a redshift distortion free function, the projected 2PCF,
| (6) |
which has practically an integration limit .
It is well known that the redshift distortion consists of two components dominated in different regimes, coherent infall is responsible for the clustering enhancement at large scales while the smearing of correlation strength at small scales is attributed to random motions. At large scales the boost to the 2PCF by the peculiar velocities takes a particularly simple form (Kaiser, 1987; Hamilton, 1992),
| (7) |
where is Legendre polynomials, is the cosine of the angle between and . Assuming there are relations
| (8) | ||||
where , and is the linear bias parameter, note that the first equation is independent on the functional form of .
To incorporate effects of random motion, the anisotropic 2PCF in redshift space is approximated by a convolution of in Eq. 7 with the distribution function of the pairwise velocity (c.f. Peebles, 1993),
| (9) |
and in general is assumed to obey an exponential distribution with PVD
| (10) |
The parameter usually is derived from the ratio of to at large scales via the first equation in Eq. 8, then other model parameters can be determined by combining Eq. 7 – Eq. 10 to fit the data grids. Note that Jing et al. (1998) assumed a slightly different exponential distribution function of pairwise velocity which is followed by Li et al. (2007).
2.2.3 Covariance Matrix
Covariance matrices our results are computed with the jack-knife technique (Lupton, 1993; Zehavi et al., 2002). Each galaxy sample is divided into twenty separate slices of approximately equal sky area, then we perform the analysis twenty times, at each time leave a different slice out. Covariance matrices are generated accordingly with these twenty measurements, for instance, covariance of 2PCF measured in two bins of and is simply
| (11) |
in which is the number of jack-knife sub-samples we used.
3 Results
3.1 Flux-limited samples
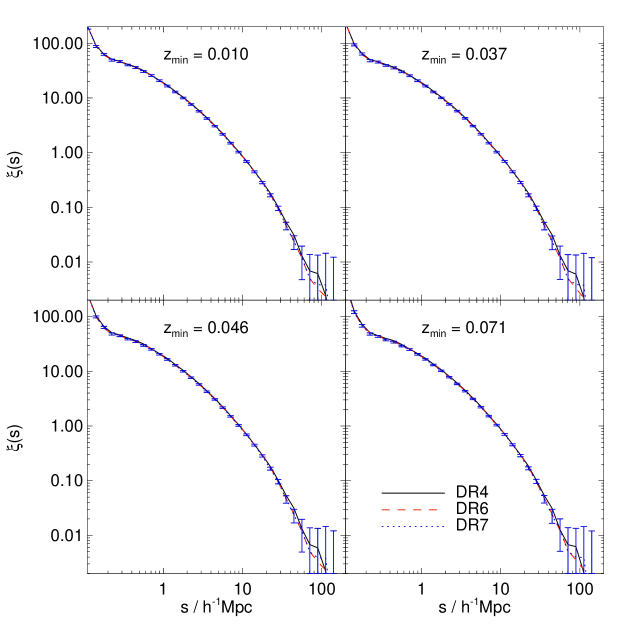
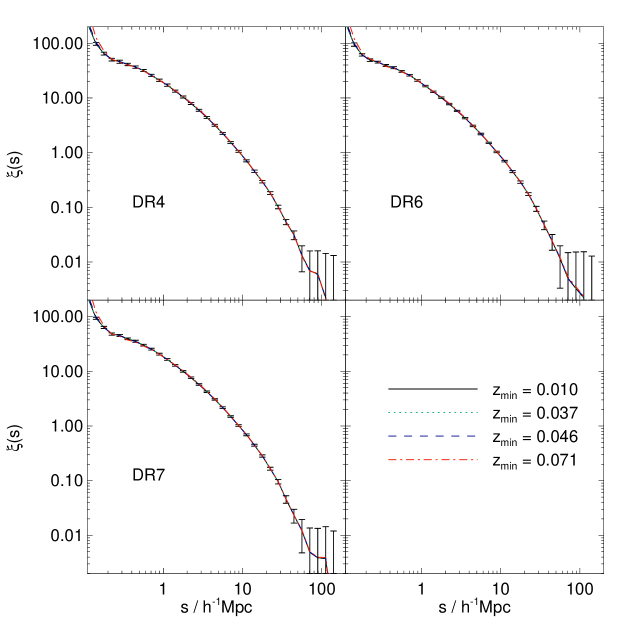
Isotropic 2PCFs of flux-limited samples in Table 1 are calculated firstly. Figure 2 manifest that the redshift space 2PCFs of flux-limited samples show little variation against data versions of SDSS. of DR4 exhibits some deviation at large scales , but is hardly significant for the huge cosmic variance at these scales. of flux-limited samples of the same data release are displayed in the right panel of Figure 2, there is no visible change to redshift space 2PCF of SDSS when galaxies with low redshift are excluded even when the lost of number of galaxies is as much as (Table 1). Thus eliminating local volume and enlarging sky coverage from DR4 to DR7 have little influence on the clustering strength measured, unlikely there is any significant sample volume dependent effects. As we are not interested in general discussion of the SDSS main galaxy catalogue as a whole, we stop preforming further analysis with other statistical measures.
It is well known that faint galaxies have much lower linear bias than luminous ones (e.g. Tegmark et al., 2004; Zehavi et al., 2005; Li et al., 2007), when we throw away many faint galaxies by imposing near-end redshifts limit it is expected that should display higher amplitude when lower redshift cuts increase. It could be that the lost in number of galaxies (after proper weighting) is too small to raise any serious deviation (Table 1), or in another words of flux-limited sample is dominated by galaxies around the redshift distribution peak.
3.2 Volume-limited samples
3.2.1 2PCF and monopole of 3PCF in redshift space


2PCFs and monopoles of 3PCFs of volume-limited samples of the three SDSS data releases are measured to probe possible differences. In this paper we only present the which amplitude is the strongest among configurations of (Pan & Szapudi, 2005). As seen in Figure 3, in nonlinear regime major discrepancies appear in the VL1 sample of the lowest luminosity, differences between results of DR4 and DR7 are around at scales as small as Mpc, while consistency of and of brighter volume-limited samples of SDSS is perfect at scales .
At scales greater than , for subsamples of VL3+ – VL5+ of different data releases are in good agreement within errorbars, but have variations at level of (Figure 4). For the five faint galaxy samples of VL1 – VL3, disagreement in of DR7 to DR4 is already apparent in the regime, which is confirmed by their . We conclude that modulation to correlation functions in redshift space resulted from enlargement of sky coverage mainly occurs at scales ranging roughly from to where is usually classified as weakly nonlinear regime in structure formation theory. Those applications and conclusion appear somehow suspicious based on 3PCFs of volume-limited samples of SDSS at large scales. For three-point correlation functions in redshift space, fairness of volume-limited samples is guaranteed only at small scales, i.e. in strongly nonlinear regime.
3.2.2 The First Zero-crossing points of 2PCFs
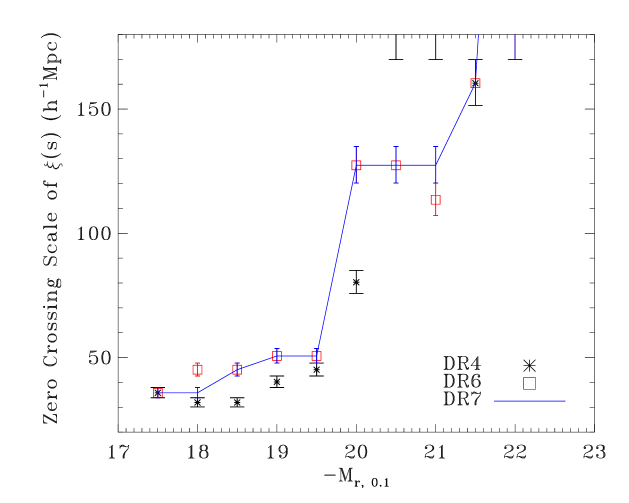
To investigate the charge of Sylos Labini et al. (2009) the first zero crossing scales of against median luminosity of volume-limited samples are plotted in Figure 5. Estimated is effectively averaged over a scale bin and the quoted scale is set to be . Unlikely we can right hit all zero points of by our scale binning, so we choose to show the range of scales within which experiences zero-crossing which is drawn as errorbars over the geometric mean of the pair of scales. From Figure 5 it is clear that in general the brighter is the characteristic luminosity of the sample, the larger the first zero crossing scale will be. The five faint volume-limited samples (VL1 – VL3) have roughly the same first zero crossing scale with mild variation between , then the crossing scale ascends abruptly to as large as more than and even higher than the largest scale we measured ().
For faint galaxy samples, their depths are typically small and so be their effective volumes, the systematical effect of integral constraint can not be ignored (Landy & Szalay, 1993; Bernstein, 1994). In the weak correlation limit, the cosmic bias resulted from integral constraint can be approximated by
| (12) |
in which is the estimated 2PCF, is the smallest size of the sample and is the average of the 2PCF over the sample volume, i.e. density variance at sample volume (Landy & Szalay, 1993). There is no a priori correction method to this bias unless we assume something to model the shape of the 2PCF. Since is positive, naturally will have a smaller first zero-crossing scale than . If as usual we assume that galaxy bias is linear and scale independent, , the correction to the first zero-crossing scale depends on sample volume only. As decreases with scale slowly, it is expected that the first zero-crossing scales of faint galaxy samples will gradually become larger when sample volume increases, which is true for VL2 – VL3. However, surprisingly, it is not for VL1 and VL1+. The faintest two subsamples have the smallest sample volume, but the first-zero crossing scale of VL1 does not change when SDSS marching from DR4 to DR7, while of VL+ the scale of DR7 becomes smaller than of DR4. Furthermore, the difference between depths of VL3 and VL3+ is not very large (Table 2), but the first zero-crossing scales of their differ hugely. Integral constraint alone could not explain the findings.
The increment of sky coverage from DR4 to DR6 is approximately the same as the gain from DR6 to DR7, the first zero crossing scales of DR7 only differ from DR6 slightly in two luminosity bins, while DR4 does not agree with other data releases significantly, which makes it difficult to clutch at other simple geometric explanation, such as assuming fractal galaxy distribution. Ergodicity bias could not be resorted too, for low luminosity samples with low characteristic redshift, the correction is positive (Pan & Zhang, 2010) and would push zero point to larger scales, which obviously contradicts observation. Neither could be redshift distortion, as on large scales redshift distortion acts on galaxy 2PCF as a multiplication.
The sudden change of the first zero-crossing scale from faint galaxies to bright galaxies probably implies that the composition of faint galaxy samples is very different compared with bright galaxy samples, which may be attributed to the shifting of leading role from satellite galaxies to central galaxies in samples brighter than (Li et al., 2007). Whatever the physical mechanism is, mathematically the effect to 2PCF is fully packed into a simple function, the galaxy bias. The linear biasing model assumes that on large scales the galaxy 2PCF in which is a deterministic, scale independent bias parameter and is the 2PCF of dark matter, obviously if the model holds, the zero point of will not change no matter what could be, e.g. scale dependent. If we presume that the problem of zero crossing is in biasing, then either stochastic or nonlinear bias has to be invoked. Simple calculation indicates that if we adopt the parametrization to bias of (Fry & Gaztañaga, 1993) and include the second-order bias parameter in 2PCF, to the leading order the effect is again multiplicative and can not shift the first zero point of 2PCF. It appears that stochastic biasing have to be considered. Details of the calculation however is beyond scope of this paper and will be presented elsewhere.
Another interesting aspect is that the first zero-crossing scales 2PCFs of samples VL4 and VL4+ of DR4 are larger than the largest scale of our measurements, but not of DR6 and DR7. The lack of anti-correlation in the two luminosity bins of DR4 is probably an evidence of the modulation due to the Sloan Great Wall as revealed by Zehavi et al. (2005) and Nichol et al. (2006), the increased sky coverage of DR6 and DR7 just successfully weakens the influence of the super structure (Zehavi et al., 2010).
3.2.3 Projected 2PCF and PVD


is a mixture of real space 2PCF and PVD. The entanglement can be sorted with the projected 2PCF . Measurements of are shown in Figure 6, actually we cross checked our of DR7 with available results of Zehavi et al. (2010), the agreement is excellent except for the sample VL2 of which our differs at scales . As seen in Figure 6, obviously that of DR4 and DR6 are in good agreement at scale range probed in most luminosity bins, of DR6 are slightly larger at large scale around in several faint samples but of low significance for the size of error bars. For VL1 and VL2, their of DR7 are boosted by more than in amplitude relative to of DR4, but the shape does not change. For subsamples in other luminosity bins, their are stable against data version, though for VL1+ and VL2+ there are some minor changes within errorbars.
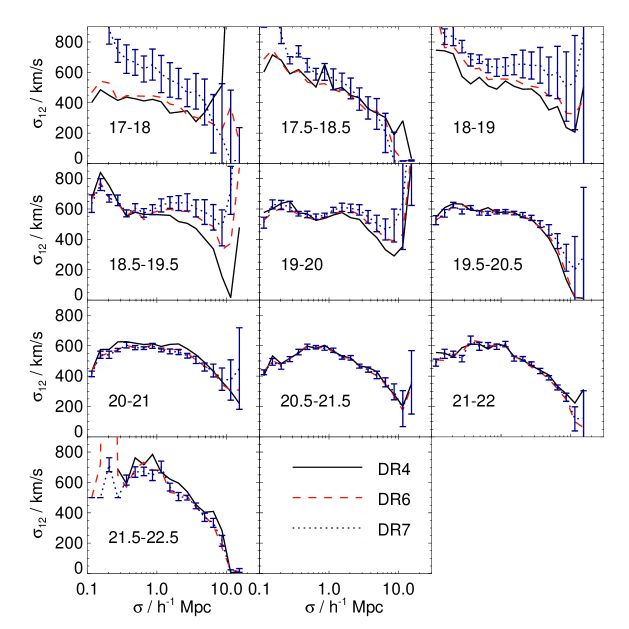
Figure 7 demonstrates the scale dependence of PVDs of different luminosity samples while Figure 8 is of the luminosity dependence of PVDs measured at scales of respectively. of subsamples VL1, VL2 and VL2+ of DR7 are significantly different to measurements of DR4. For VL2+, PVD of DR7 agrees with earlier data at small scales but then turns to be higher at scales Mpc which makes the scale dependence very weak; for VL2, of DR7 roughly keeps the shape of DR4 but has a much larger amplitude. of VL1 of DR7 has steeper scale dependence and stronger amplitude at small scales than results of DR4 and DR6. of VL1 subsamples of DR4 and DR6 are rather flat, and do not follow the general trend that PVDs of galaxy samples with lower luminosities should rise faster at smaller scales (also see PVDs of SAMs in Fig.5 of Li et al., 2007), but now DR7 reverts VL1 to track. Comparing distributions in celestial sphere of galaxies in the lowest luminosity bin of the three SDSS data releases reveals the variation is just induced by a big structure locates in area roughly of RA and DEC of (Figure 1). It is another example of impact of super structure on clustering analysis of LSS in addition to the Sloan Great Wall.
Li et al. (2007) realised that and PVDs of faint volume-limited samples of DR4 are too low to match prediction of SAMs. Instructed by the experiment of Slosar et al. (2006), they reduced fraction of satellite galaxies in massive halos in SAMs ad hoc by around and reproduced approximately the actual measurements, which then becomes a serious conflict for people to reconcile between models and observation. An eyeball check of our results with the SAMs prediction in Li et al. (2006) denotes that the amplitude boost in and PVDs of DR7’s faint volume-limited samples roughly compensate for the space between DR4 and SAMs, or at least ameliorate difficulties in theoretical modelling, although we do not have SAMs data to quantify the improvement. So unlike the Sloan Great Wall, the existence of a large structure in the Universe is actually positive to our working models, which somehow casts doubts in the proclaimed practice of cutting off super structures from original data to fit into an unified picture. After all, it is still early to say which is closer to the true clustering property of those faint galaxies, we might need a deeper and wider survey than the present SDSS DR7 to reach good fairness and reduce huge uncertainties.
4 Summary and Discussion
By extensive comparison of different data releases of SDSS main galaxy catalogue with 2PCFs in redshift space for flux-limited samples, 2PCFs/monopole of 3PCFs in redshift space for volume-limited samples, projected 2PCFs and PVDs for volume-limited samples, we have the following findings about galaxy clustering properties against the expansion of sky coverage of SDSS.
-
1.
2PCF in redshift space of flux-limited sample is extremely robust against sample volume change, which subsequently secures relevant application; is also insensitive to local structures at low redshift.
-
2.
2PCFs in redshift space of volume-limited samples of SDSS DR7 in luminosity bins brighter than are in good agreement with earlier data releases at scales . As scale being larger, the consistency is broken for volume-limited samples fainter than , and in general the deviation of DR7 to DR6 and DR4 grows with larger absolute magnitude. Zero crossing points of DR7’s do not differ much to DR6’s, but shifts away from DR4’s apparently.
-
3.
Volume-limited samples of SDSS display convergence in at scales except the one in the faintest luminosity bin; while in the weakly nonlinear regime, there is no agreement between of different data releases in all luminosity bins.
-
4.
Projected 2PCFs of volume-limited samples in luminosity bins brighter than are robust against data version, but for samples in fainter bins, of DR7 are significantly higher than those of earlier data. Similar phenomenon is also seen in PVDs, PVDs of the two faintest volume-limited samples also appear much steeper along scale in DR7 and then become flatter at higher luminosity, which actually turn to be closer to what SAMs predict shown in Li et al. (2007).
-
5.
The faintest volume-limited sample of is very peculiar, it suffers of the biggest variance due to enlargement of sky coverage, agreement of and of DR7 in redshift space with early data is breached at scales as small as ; of the sample is enhanced by around and PVDs distinguish much in amplitude and scale dependence from measurements of earlier data.
Fairness of a galaxy sample is assessed by statistical functions, one can not claim a general fair sample hypothesis without specifying the statistical measure used. It is possible that a galaxy sample is fair for one statistical function but not for another function. With our measurements, we conclude that current SDSS is not able to provide reliable 2PCFs (both of redshift space and projected) and PVDs of samples of characteristic luminosity fainter than , and third-order statistics in the weakly nonlinear regime for nearly all volume-limited samples.
For faint volume-limited subsamples, probably due to their very shallow depths, measurements suffers of greater finite volume effects such that enlarging sky coverage has larger influence on measurements of statistics than for bright subsamples. The inconsistency observed is manifestation of cosmic variance due to insufficient sample volume. The variances are comparable to the jack-knife errorbars which usually are regarded as good and robust approximation to the true errorbars (Zehavi et al., 2002). Now it seems that the technique underestimates the true variance, corresponding results about the habitation of faint galaxies in halos withdrawn from clustering analysis, e.g. Li et al. (2007) and Zehavi et al. (2010) are not very concrete. Conclusions about faint galaxies utilizing galaxy group catalogue constructed from SDSS DR4 (Yang et al., 2007, 2008) might also be problematic, we conjecture that a new group catalogue from DR7 may provide a very different paradigm.
In our analysis PVDs are derived under an general assumption that galaxy pairwise velocities are following closely to exponential distribution. The assumption might not be exact for satellite galaxies which pairwise velocity distribution can be better described by Gaussian (Tinker, 2007). For galaxies of low luminosity, they are mostly likely satellite, the obtained based on exponential distribution is biased and so be the relation of PVDs with galaxy luminosity presented in Figure 8. Nevertheless, our PVDs of different versions of VL1 are biased in the same way, the systematical bias will not affect our basic conclusion that PVD of VL1 of DR7 is very different to what is of DR4.
Recently there are several works applying 3PCF of SDSS (e.g. Sefusatti et al., 2006; Kulkarni et al., 2007; Marín et al., 2008; Marín, 2010; McBride et al., 2010), either to help determining cosmological parameters and galaxy biasing or to diagnose models of galaxy formation. Some results are using measurements of volume-limited subsamples of the SDSS main galaxy catalogues in the weakly nonlinear regime, our analysis however points out that one needs to be very cautious in taking relevant conclusions.
Another problem worthy of more discussion is the first zero-crossing point of 2PCF. Of course, part of the problem is induced by finite volume of samples, at least integral constraint is a serious systematics to low luminosity galaxy subsamples. But for subsamples with large volume of bright galaxies, absent of anti-correlation at large scales is still puzzling. Instead of assaulting validity of CDM models it is probably better to activate stochastic bias in models of galaxy 2PCF. Halo model alone can not solve the problem since at large scales 2PCF in halo model boils down to simple multiplication of bias parameter with linear 2PCF of dark matter. In the bucket of parameters of cosmological application, galaxy 2PCF at large scales by default is fully described by linear bias parameter and 2PCF of dark matter, the single bias parameter is largely degenerated with some other parameters, such as the normalization of density fluctuation and the matter density parameter , it is unclear if present estimation of cosmological parameters is significantly biased by the ignorance of possible exotic bias (e.g. the proposal of Coles & Erdogdu, 2007).
Acknowledgements.
This work is funded by the NSFC under grants of Nos.10643002, 10633040, 10621303, 10873035, 10725314 and the Ministry of Science & Technology of China through 973 grant of No. 2007CB815402. Authors enjoy wonderful discussion with Xiaohu Yang, Weipeng Lin and Xi Kang. This publication also makes use of the Sloan Digital Sky Survey (SDSS). Funding for the SDSS and SDSS-II has been provided by the Alfred P. Sloan Foundation, the Participating Institutions, the National Science Foundation, the U.S. Department of Energy, the National Aeronautics and Space Administration, the Japanese Monbukagakusho, the Max Planck Society, and the Higher Education Funding Council for England. The SDSS Web Site is http://www.sdss.org/. The SDSS is managed by the Astrophysical Research Consortium for the Participating Institutions. The Participating Institutions are the American Museum of Natural History, Astrophysical Institute Potsdam, University of Basel, University of Cambridge, Case Western Reserve University, University of Chicago, Drexel University, Fermilab, the Institute for Advanced Study, the Japan Participation Group, Johns Hopkins University, the Joint Institute for Nuclear Astrophysics, the Kavli Institute for Particle Astrophysics and Cosmology, the Korean Scientist Group, the Chinese Academy of Sciences (LAMOST), Los Alamos National Laboratory, the Max-Planck-Institute for Astronomy (MPIA), the Max-Planck-Institute for Astrophysics (MPA), New Mexico State University, Ohio State University, University of Pittsburgh, University of Portsmouth, Princeton University, the United States Naval Observatory, and the University of Washington. This publication also made use of NASA’s Astrophysics Data System Bibliographic Services.References
- Abazajian et al. (2009) Abazajian, K. N., et al. 2009, ApJS, 182, 543
- Adelman-McCarthy et al. (2006) Adelman-McCarthy, J. K., et al. 2006, ApJS, 162, 38
- Adelman-McCarthy et al. (2008) —. 2008, ApJS, 175, 297
- Antal et al. (2009) Antal, T., Sylos Labini, F., Vasilyev, N. L., & Baryshev, Y. V. 2009, Europhysics Letters, 88, 59001
- Berlind & Weinberg (2002) Berlind, A. A., & Weinberg, D. H. 2002, ApJ, 575, 587
- Bernstein (1994) Bernstein, G. M. 1994, ApJ, 424, 569
- Blanton et al. (2005) Blanton, M. R., et al. 2005, AJ, 129, 2562
- Coles & Erdogdu (2007) Coles, P., & Erdogdu, P. 2007, JCAP, 10, 7
- Colless et al. (2003) Colless, M., et al. 2003, ArXiv Astrophysics e-prints,astro-ph/0306581
- Cooray (2006) Cooray, A. 2006, MNRAS, 365, 842
- Croton et al. (2006) Croton, D. J., Springel, V., White, S. D. M., De Lucia, G., Frenk, C. S., Gao, L., Jenkins, A., Kauffmann, G., Navarro, J. F., & Yoshida, N. 2006, MNRAS, 365, 11
- Efstathiou (1988) Efstathiou, G. 1988, in Lecture Notes in Physics, Berlin Springer Verlag, Vol. 297, Comets to Cosmology, ed. A. Lawrence, 312
- Eisenstein et al. (2005) Eisenstein, D. J., Zehavi, I., Hogg, D. W., Scoccimarro, R., Blanton, M. R., et al. 2005, ApJ, 633, 560
- Fry & Gaztañaga (1993) Fry, J. N., & Gaztañaga, E. 1993, ApJ, 413, 447
- Gott et al. (2005) Gott, J. R. I., Jurić, M., Schlegel, D., Hoyle, F., Vogeley, M., Tegmark, M., Bahcall, N., & Brinkmann, J. 2005, ApJ, 624, 463
- Hamilton (1992) Hamilton, A. J. S. 1992, ApJ, 385, L5
- Hamilton (1993) —. 1993, ApJ, 417, 19
- Jing et al. (1998) Jing, Y. P., Mo, H. J., & Boerner, G. 1998, ApJ, 494, 1
- Kaiser (1987) Kaiser, N. 1987, MNRAS, 227, 1
- Kang et al. (2005) Kang, X., Jing, Y. P., Mo, H. J., & Börner, G. 2005, ApJ, 631, 21
- Kazin et al. (2010) Kazin, E. A., Blanton, M. R., Scoccimarro, R., McBride, C. K., Berlind, A. A., Bahcall, N. A., Brinkmann, J., Czarapata, P., Frieman, J. A., Kent, S. M., Schneider, D. P., & Szalay, A. S. 2010, ApJ, 710, 1444
- Komatsu et al. (2010) Komatsu, E., et al. 2010, ArXiv e-prints, astro-ph.CO/1001.4538
- Kravtsov et al. (2004) Kravtsov, A. V., Berlind, A. A., Wechsler, R. H., Klypin, A. A., Gottlöber, S., Allgood, B., & Primack, J. R. 2004, ApJ, 609, 35
- Kulkarni et al. (2007) Kulkarni, G. V., Nichol, R. C., Sheth, R. K., Seo, H., Eisenstein, D. J., & Gray, A. 2007, MNRAS, 378, 1196
- Landy & Szalay (1993) Landy, S. D., & Szalay, A. S. 1993, ApJ, 412, 64
- Li et al. (2007) Li, C., Jing, Y. P., Kauffmann, G., Börner, G., Kang, X., & Wang, L. 2007, MNRAS, 376, 984
- Li et al. (2006) Li, C., Kauffmann, G., Jing, Y. P., White, S. D. M., Börner, G., & Cheng, F. Z. 2006, MNRAS, 368, 21
- Lupton (1993) Lupton, R. 1993, Statistics in theory and practice (Princeton, N.J., Princeton University Press)
- Marín (2010) Marín, F. 2010, ArXiv e-prints, astro-ph/1011.4530
- Marín et al. (2008) Marín, F. A., Wechsler, R. H., Frieman, J. A., & Nichol, R. C. 2008, ApJ, 672, 849
- Martínez et al. (2009) Martínez, V. J., Arnalte-Mur, P., Saar, E., de la Cruz, P., Pons-Bordería, M. J., Paredes, S., Fernández-Soto, A., & Tempel, E. 2009, ApJ, 696, L93
- McBride et al. (2010) McBride, C. K., Connolly, A. J., Gardner, J. P., Scranton, R., Scoccimarro, R., Berlind, A. A., Marin, F., & Schneider, D. P. 2010, ArXiv e-prints, astro-ph/1012.3462
- Nichol et al. (2006) Nichol, R. C., et al. 2006, MNRAS, 368, 1507
- Pan & Szapudi (2005) Pan, J., & Szapudi, I. 2005, MNRAS, 362, 1363
- Pan & Zhang (2010) Pan, J., & Zhang, P. 2010, JCAP, 8, 19
- Peebles (1993) Peebles, P. J. E. 1993, Principles of physical cosmology (Princeton Series in Physics, Princeton, NJ: Princeton University Press)
- Percival et al. (2010) Percival, W. J., et al. 2010, MNRAS, 401, 2148
- Reid et al. (2010) Reid, B. A., et al. 2010, MNRAS, 404, 60
- Sefusatti et al. (2006) Sefusatti, E., Crocce, M., Pueblas, S., & Scoccimarro, R. 2006, Phys. Rev. D, 74, 023522
- Slosar et al. (2006) Slosar, A., Seljak, U., & Tasitsiomi, A. 2006, MNRAS, 366, 1455
- Sylos Labini et al. (2009) Sylos Labini, F., Vasilyev, N. L., Baryshev, Y. V., & López-Corredoira, M. 2009, A&A, 505, 981
- Tegmark et al. (2004) Tegmark, M., et al. 2004, ApJ, 606, 702
- Tinker (2007) Tinker, J. L. 2007, MNRAS, 374, 477
- Yang et al. (2003) Yang, X., Mo, H. J., & van den Bosch, F. C. 2003, MNRAS, 339, 1057
- Yang et al. (2008) —. 2008, ApJ, 676, 248
- Yang et al. (2007) Yang, X., Mo, H. J., van den Bosch, F. C., Pasquali, A., Li, C., & Barden, M. 2007, ApJ, 671, 153
- York et al. (2000) York, D. G., et al. 2000, AJ, 120, 1579
- Zehavi et al. (2002) Zehavi, I., et al. 2002, ApJ, 571, 172
- Zehavi et al. (2005) —. 2005, ApJ, 630, 1
- Zehavi et al. (2010) —. 2010, astro-ph.CO/1005.2413
- Zheng et al. (2005) Zheng, Z., et al. 2005, ApJ, 633, 791