Quantum molecular dynamics simulations of lithium melting using Z-method
Abstract
We performed first-principles molecular dynamics calculations for lithium using the projector augmented waves method and the generalized gradient approximation as exchange-correlation energy. The melting curve of lithium was computed using the Z-method technique for pressures up to 30 GPa, which agrees well with the experimental and two-phase simulated results. The change of the melting line slope from positive to negative was predicted by the characteristic shape inversion of the Z curve at about 8.2 GPa. Through analyzing the static properties, we conclude that no liquid-liquid phase transition accompanies the occurrence of the melting line maximum, which is caused by the higher compressibility of the liquid phase compared to the solid phase. In addition, we systematically studied the dynamic and optical properties of lithium near melting curve at critical superheating and melting temperatures. It was suggested that spectra difference at critical superheating and melting temperature may be able to diagnose the homogeneous melting.
pacs:
71.27.+a, 71.15.Mb, 71.20.-b, 63.20.dkI Introduction
The simple alkali metals like Li and Na have drawn extensive attentions recently due to their enigmatic melting behavior at high pressure. Intensive theoretical and experimental studies have demonstrated that they undergo a sequence of symmetry-breaking structural phase transitions and present rather complex crystalline phases under compressions Neaton1999 ; Neaton2001 ; Hanfland2000 . These structural changes are accompanied by a variety of intriguing phenomena, among which the most striking is the anomalous melting feature at high pressure. For sodium, its melting curve has been measured up to 130 GPa Gregoryanz2005 and subsequently reproduced by first-principles calculations based on either molecular dynamics or the usual Lindemann criterion Canales2008 ; Koci2008 ; Lepeshkin2009 . These studies have revealed the unusual melting behavior of Na, i.e., the existence of multiple maxima. For lithium, on the other hand, because of the difficulties in containing the sample under high pressure, the knowledge of its melting curve has long been confined to be less than 8 GPa Luedemann1968 ; Boehler1983 until a recent differential thermal analysis (DTA) measurement Lazicki2010 , which extended the melting line of Li up to 15 GPa and reported a maximum at about 10 GPa. Theoretically, a Lindermann model curve of Li was calculated Lepeshkin2009 to give an obvious discontinuity near the bcc-fcc-liquid triple point, which was not supported by experimental data Lazicki2010 . More directly, Tamblyn et al. Tamblyn2008 and Herndez et al. Hernandez2010 have from first-principles molecular dynamics (FPMD) simulations determined the melting temperature of Li over a broad pressure range. They both observed the negative slope of the melting curve. In addition, a new phase in liquid lithium with bonded tetrahedral local order at pressures above 150 GPa was also predicted Tamblyn2008 . A possible link between the maximum in the melting line and liquid-liquid phase transition (LLPT) was suggested for some systems, such as P Katayama2000 ; Monaco2003 and Cs Falconi2005 . As for Na, first-principles simulations have revealed that the maximum in the melting line occurs without any accompanying LLPT, and higher compressibility of the liquid phase than the solid phase causes the change of melting line slope from positive to negative Eduardo2007 . The cause of the anomalous melting behavior of Li still remains unclear. Though previous FPMD studies have found bcc-like to fcc-like structural transition in liquid Li Tamblyn2008 ; Yang2010 , the temperatures are well above the melting temperature and thus it could not be concluded that the similar structural transition occurs along the melting line. It is desirable to explore whether LLPT exists along the melting line and reveal what contributes to the melting curve maximum of Li.
There are two common strategies for FPMD calculation of the melting curve, i.e., the two-phase method Alfe2003 ; Belonoshko2005 corresponding to a heterogeneous melting and the one-phase approach Ogitsu2003 which involves a homogeneous melting. The first one can give accurate results at the cost of computational demanding, while the second usually causes superheating effect, though needs much less atoms. A useful alternative has been proposed by Belonoshko et al. Belonoshko2006 , which is referred to as Z-method. It combines the advantages of both techniques. When the system reaches the critical superheating , it could not be heated before transforming into a liquid structure. If let it evolve naturally as in Z-method, the temperature just drops down to the melting temperature . Along this line, recently, growing interests are concentrated on the mechanism of homogeneous melting through characterizing the crystal properties at Belonoshko2007 ; Davis2009 ; Leighanne2010 . However, no consensus could be reached. The dynamic and optical properties of crystal at , which are deemed useful for insight into the mechanism of melting, are still scarcely presented in the literature. Besides, the optical properties should be different for the superheating solid and the disordered liquid phase, and thus they could be able to diagnose the homogeneous melting. The similar idea has been suggested for diagnosing the shock melting of Al Ogitsu2009 .
Inspired by the above-mentioned facts, in this paper we calculate the melting curve of Li up to 30 GPa using the Z-method implemented by FPMD simulations. We show that the shape of Z curve inverse with pressure increased to 8.2 GPa, which predicts the presence of maximum in the melting curve, in good agreement with experimental measurement. Through examining the static properties of Li at and , we conclude that no LLPT occurs and liquid phase is more compressible than solid phase, which may be the cause to the melting line maximum. Besides, the dynamical and optical properties at and are studied. It is found that solid and liquid spectra show marked difference. This could be an efficient way of diagnosing the phase transition during the homogeneous melting. In the next section, the methods used in homogeneous melting simulation and optical properties calculations are described. In Sec. III, the calculated results are discussed and compared with experimental data. Finally, we close our paper with a summary of our main results.
II Method
We have performed FPMD simulations to determine the melting curve using Z-method, which has been proven successful to predict melting temperature in several systems, such as Al Bouchet2009 , H Davis2008 , MgO Belonoshko2010 and so on. The idea is to perform FPMD in the microscopic ensemble (NVE) on a single solid system at different initial (kinetic energy). A realistic can be reached without any external intervention on the dynamics of the melting process. On further increasing slightly, will drop naturally to the melting temperature at the pressure fixed by the chosen density. By performing long microscopic simulations at different cell volumes, it is possible to obtain points directly on the melting curve. The method is as straightforward as the two-phase method, and it requires half as many atoms in the simulation cell. However, it still requires a large amount of simulation steps to achieve complete melting curve.
We performed Z-method simulations of Li melting with ab initio Simulation Package (VASP) Kresse1993 for bcc structure (for eight densities). The all-electron projector augmented wave (PAW) method Kresse1999 ; Bloch1994 was adopted, retaining only the 2s electron in the valence, and the exchange-correlation energy was described employing the generalized gradient approximation (GGA) of Perdew-Burke-Ernzerhof (PBE) formalism Perdew1996 , as implemented in VASP. We used plane-wave cutoff of 150 eV, and the Brillouin zone was sampled only with the point. For each density the system was simulated for 10000-20000 steps with the time step of 2.0 fs, where the time scale lies between 20 to 40 ps for different initial in order to construct an isochoric curve versus . In this study, although the applied pressure range is up to 30 GPa, only the bcc structure was used in the MD calculations. A 256-atom bcc supercell was constructed.
Following the FPMD simulations, a total of ten configurations are selected from an equilibrated (in an average sense) portion of the molecular dynamics run, typically sampling the final picosecond of evolution. For each of these configurations, the electrical conductivity is calculated using the Kubo-Greenwood formula Harrison1970 . The Kubo-Greenwood formulation gives the real part of the electrical conductivity as a function of frequency ,
| (1) | |||||
| (2) |
where describes the occupation of the band, with the corresponding energy and the wave function at k, and is the k-point weighting factor.
III Results and Discussion
III.1 Melting curve
By performing the microscopic Z-method simulations, the system evolve freely without any temperature control, and in each case, after reaching , the isochore line drops to a point that should fall precisely along the melting curve. The isochore plots for each density are shown in Fig. 1, from which the melting points (the ones marked with square on each plot) and critical superheating points are extracted and shown in Table I with their respective error estimations.

| Pressure | Melting temperature | Superheating temperature |
|---|---|---|
| (GPa) | (K) | (K) |
| 1.310.03 | 495.369.27 | 578.1613.15 |
| 3.180.03 | 510.299.73 | 613.3812.46 |
| 5.350.02 | 521.7610.13 | 608.3612.11 |
| 8.210.02 | 541.1510.68 | 627.113.16 |
| 10.140.02 | 538.7810.34 | 626.8212.86 |
| 15.690.02 | 502.629.21 | 591.4212.02 |
| 19.600.04 | 489.327.92 | 578.7810.99 |
| 28.580.04 | 411.567.92 | 480.208.93 |
As can be seen in the plots in Fig. 1, these eight isochores naturally fall into two categories according to their characteristic shapes. The first three form a “Z” shape, while the last five form an inverse “Z” shape. The fourth plot should be noticed that the upper and lower cap of “Z” are nearly overlapped. These featured isochore characteristics just predict the anomalous melting behavior of lithium. When the volume is fixed at values corresponding to the isochores with “Z” shape, the pressure of the liquid phase is higher than that of the solid phase at the melting temperature. This implies that in condition of constant pressure, the liquid phase would have a larger volume, and thus the pressure derivative of the melting line in this region should be positive according to the Clausius-Clapeyron equation
| (3) |
where is the melting temperature, is the pressure, is the difference of molar volumes, and is the difference of molar enthalpies. On the other hand, in the region of the isochores with inverse “Z”, the case is totally opposite. That is, the solid phase would have a larger volume, consistent with the negative slope of the melting curve. In the case that the “Z” shape almost merges into one line as shown in the fourth plot in Fig. 1, the melting temperature would reach its maximum. We further show the pressure difference between the liquid () and solid () phases as a function of volume at melting point in Fig. 2, which are obtained from the isochore simulations. It is indicated that the melting curve maximum locates at about 8.2 GPa, where equals to . This agrees well with the recent experimental measurement Lazicki2010 of a negative slope above 1o GPa.

The melting curve along with the estimated errors is shown in Fig. 3, in comparison with experimental data and data from two-phase FPMD simulations. The maximum melting temperature of 540 K is determined to be in the pressure range from 8 to 10 GPa. There is reasonable agreement between the Z-method melting and experimental results from Boehler et al. Boehler1983 and Luedemann et al. Luedemann1968 , where the discrepancy is below 20 K. Especially, they reports a melting temperature of 508 K at 3 GPa, while we obtain 510 K at 3.18 GPa. And also unlike other single-phase simulations of Li, the present Z-method produces melting line very close to the two-phase simulation results up to 30 GPa we considered. The two-phase simulations have shown an interesting feature that bcc is more stable than fcc structure close to melting Hernandez2010 . Therefore, it should be reasonable to study the properties of lithium at melting and superheating temperatures just based on the simulation results of bcc structure in the following.

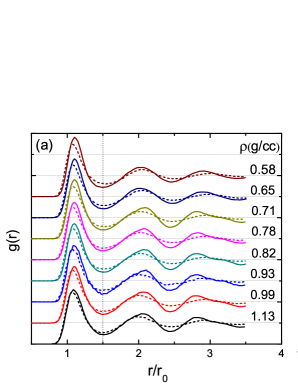
First-principles simulations have confirmed that the anomalous melting behavior of Na is attributed to the high compressibility of liquid phase than solid phase, and the maximum of the melting line occurs without any accompanying first-order LLPT. Through analyzing the pair correlation function (PCF) , we find that these conclusions also hold for Li. As we all know, PCF is usually used to examine atomic configurations, defined as , with the interatomic distance, the number of atoms, the density , and and the positions of atoms and , respectively. In Fig. 4(a) density dependence of PCF at and are presented with scaled by , where =. As seen in the figure, the shape of the PCF does not change up to 1.13 g/cm3 (30 GPa), which indicates that the compression in this pressure range is uniform with the local structue unchanged. However, the structure differences between and are noticeable especially for large values of . For example, the peak structure at around at is large blurred at . Furthermore, the coordination at and for different densities are given from integrating within a sphere of radius , as shown in Fig. 4(b). In particular, by integrating to the first minimum, the average coordination numbers can be obtained, as indicated in the Fig. 4(b). The first minimum of at is at , which is indicated by the dotted line. It is obvious that is nearly constant at 14 for these densities, similar to that of a bcc crystal. Thus our simulations give that no LLPT occurs along the melting line of Li up 30 GPa. It is consistent with the experimental results Lazicki2010 that no signature of bcc-fcc transition along the melting line was observed up to 15 GPa, though liquid structural transformation from bcc to fcc in pure liquid phase above melting temperature is a natural case Yang2010 . In addition, as can be seen from Fig. 4(b), beyond the first coordination shell, the coordination number for the liquid phase increases compared to the solid phase, which implies that the liquid phase is more compressible than the solid phase, and thus may lead to the maximum of the melting line.
Besides the above-presented clarification of the structure, we further examine the mean square displacement (MSD) at and in order to confirm that we indeed have a solid behavior at and a liquid behavior at for each of the volumes considered. Figure 5 shows the MSD up to 3 ps for GPa at K and K. For purpose of comparison, we also include the MSD at K (solid) and K (liquid). It is obvious to see that the MSD at increases linearly at long time, in a similar way as in pure liquid at K, while at the displacement reaches a constant nearly, which suggests that atoms are in a solid structure and could not diffuse away from their equilibrium positions (compare with MSD at K).

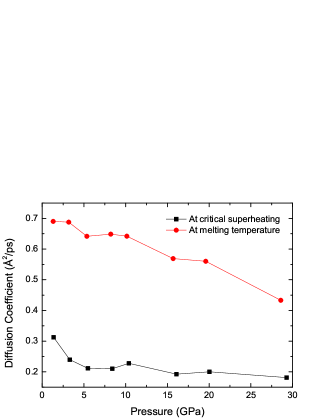
The diffusion coefficient , estimated using the MSD up to ps by
| (4) |
is shown in Fig. 6 for every pressure point in our calculated melting curve. Here it is verified that there is a remarkable difference in the atomic diffusion between at and at in the whole pressure range considered. As expected, the diffusion decreases with pressure generally. Especially, the diffusion coefficient at 1.31 GPa and K is about 0.69 , which is in excellent agreement with the experimental value of at 0 GPa and K Lowenberg1967 .
III.2 Dynamic conductivity and optical properties
The linear optical conductivities of superheated and melted Li at different densities (0.58, 0.78 and 1.13 g/cm3) calculated using Eq. (1) are shown in Fig. 7, which are averaged over ten snapshots selected during the course of FPMD simulations. For identical density, the spectra at and show marked differences. At , there are some structural peaks, while the dips fill in and only leave a shoulder at . Of note is the fact that our predicted difference between superheated solid and melting liquid is even more pronounced at lower densities. For example, at density of 0.58 and 0.78 g/cm3, there are two prominent peaks, while only one at 1.13 g/cm3. In addition, for critical superheated solid, the peaks broaden while moving to higher energy as density is increased. All of the superheated solid samples exhibit nearly free-electron characters. Again, the liquid spectrum is featureless and Drude-type. This allows us to expect the optical measurement to be able to diagnose the homogeneous melting.

Through extrapolating to the zero frequency limit, the dc conductivity can be determined by fitting with the simple Drude form Harrison1970
| (5) |
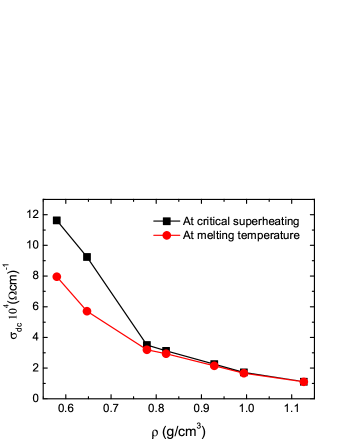
where represents effective collision time. Figure 8 presents the dc conductivity of lithium at and for different densities. The dc conductivity shows a systematic behavior in terms of density for both cases. Stronger ion-electron scattering with increasing density would diminish the conductivity. In addition, the conductivity decreases with the temperature for metals. It is thus natural that the conductivity decrease with increasing density in the region with positive melting line slope. However, in the region with negative melting line slope, the effect of increased scattering is more prominent than that of the decreased temperature, which plays a central role in diminishing the conductivity. The dc conductivities at are in order of , which is consistent with the experimental and other theoretical results of the liquid lithium in the similar density and temperature ranges Bestea2002 ; Kiezmann2008 . Also it can be seen from Fig. 8 that the dc conductivity difference between and becomes smaller with increasing density, and even undistinguished at 1.13g/cm3.
IV Conclusion
In summary, we have performed FPMD simulations of the melting curve of lithium up to 30 GPa using Z-method. The results are in good agreement with experimental measurements and the two-phase simulations. It can be concluded that the melting line maximum of lithium may be caused by higher compressibility of liquid phase than solid phase, without LLPT accompanied. In addition, we have also systematically studied the atomic dynamic diffusion behavior and electronic dynamic conductivity properties at the critical superheating and melting points of lithium, which have revealed prominent physical differences between the superheated solid phase and the disordered liquid phase. For these two homogeneous phases, interestingly, the electron conductivities, especially the dc components, show the merging tendency at high densities, which suggests the increasing role the local structure plays in determining the electron-ion scattering.
Acknowledgements.
One of the authors (D.L.) is grateful for helpful discussions with H. Liu. This work was supported by NSFC under Grants No. 51071032 and No. 10734140, by the National Basic Security Research Program of China, and by the Foundations for Development of Science and Technology of China Academy of Engineering Physics under Grant No. 2009B0301037.References
- (1) J. B. Neaton, and N. W. Ashcroft, Nature (London) 400, 141 (1999).
- (2) J. B. Neaton, and N. W. Ashcroft, Phys. Rev. Lett. 86, 2830 (2001).
- (3) M. Hanfland, K. Syassen, N. E. Christensen, and D. L. Novikov, Nature (London) 408, 174 (2000).
- (4) E. Gregoryanz, O. Degtyareva, M. Somayazulu, R. J. Hemley, and H. K. Mao, Phys. Rev. Lett. 94, 185502 (1995).
- (5) M. Martinez-Canales, and A. bergara, J. Phys. Chem. Solids 69, 2151 (2008).
- (6) L. Koi, R. Ahuja, L. Vitos, and U. Pinsook, Phys. Rev. B 77, 132101 (2008).
- (7) S. V. Lepeshkin, M. V. Magnitskaya, and E. G. Maksimov, JETP Lett. 89, 586 (2009).
- (8) H. D. Luedermann, and G. C. Kennedy, J. Geophys. Res. 73, 2795 (1968).
- (9) R. Boehler, Phys. Rev. B 27, 6754 (1983).
- (10) A. Lazicki, Y. W. Fei, and R. J. Hemley, Solid State Commun. 150, 625 (2010).
- (11) I. Tamblyn, J. Y. Raty, and S. A. Bonev, Phys. Rev. Lett. 101, 075703 (2008).
- (12) E. R. Hernández, A. Rodriguez-Prieto, A. Bergara, and D. Alfè, Phys. Rev. Lett. 104, 185701 (2010).
- (13) Y. Katayama, T. Mizutani, W. Utsumi, O. Shimomura, M. Yamakata, and K. Funakoshi, Nature (London) 403, 170 (2000).
- (14) G. Monaco, S. Falconi, W. A. Crichton, and M. Mezouar, Phys. Rev. Lett. 90, 255701 (2003).
- (15) S. Falconi, L. F. Lundegaard, C. Hejny, and M. L. McMahon, Phys. Rev. Lett. 94, 125507 (2005).
- (16) R. Eduardo, Hernández, and J. Íñiguez, Phys. Rev. Lett. 98, 055501 (2007).
- (17) J. J. Yang, J. S. Tse, and T. Iitaka, J. Phys: Condens. Matter 22, 095503 (2010).
- (18) D. Alfè, Phys. Rev. B 68, 064423 (2003).
- (19) A. B. Belonoshko, N. V. Skorodumova, A. Rosengren, R. Ahuja, B. Johansson, L. Burakovsky, and D. L. Preston, Phys. Rev. Lett. 94, 195701 (2005).
- (20) T. Ogitsu, E. Schwegler, F. Gygi, and G. Galli, Phys. Rev. lett. 91, 175502 (2003).
- (21) A. B. Belonoshko, N. V. Skorodumova, A. Rosengren, and B. Johansson, Phys. Rev. B 73, 012201 (2006).
- (22) A. B. Belonoshko, S. Davis, N. V. Skorodumova, P. H. Lundow, A. Rosengren, and B. Johansson, Phys. Rev. B 76, 064121 (2007).
- (23) S. M. Davis, A. B. Belonoshko, N. V. Skorodumova, A. Rosengren, and B. Johansson (unpublished).
- (24) L. C. Gallington, and A. Bongiorno, J. Chem. Phys. 132, 174707 (2010).
- (25) T. Ogitsu, L. X. Benedict, E. Schwegler, and E. W. Draeger, Phys. Rev. B 80, 214105 (2009).
- (26) J. Bouchet, F. Bottin, G. Jornard, and G. Zérah, Phys. Rev. B 80, 094102 (2009).
- (27) S. M. Davis, A. B. Belonoshko, and B. Johansson, J. Chem. Phys. 129, 194508 (2008).
- (28) A. B. Belonoshko, S. Arapan, R. Martonak, and A. Rosengren, Phys. Rev. B 81, 054110 (2010).
- (29) G. Kresse, and J. Hafner, Phys. Rev. B 48, 13115 (1993).
- (30) G. Kresse, and J. Joubert, Phys. Rev. B 59, 1758 (1999).
- (31) P. E. Blöch, Phys. Rev. B 50, 17953 (1994).
- (32) J. P. Perdew, K. Burke, and M. Ernzerhof, Phys. Rev. Lett. 77, 3865 (1996).
- (33) L. Löwenberg, and A. Lodding, Z. Naturforsch. A 22, 2077 (1967).
- (34) W. A. Harrison, Solid State Theory (Mc Graw-Hill, New York, 1970).
- (35) M. Bestea, and S. Bastea, Phys. Rev. B 65, 193104 (2002).
- (36) A. Kietzmann, and R. Redmer, Phys. Rev. Lett. 101, 070401 (2008).