Testing a prediction of the merger origin of early-type galaxies: a correlation between stellar populations and asymmetry
Abstract
One of the key predictions of the merger hypothesis for the origin of early-type (elliptical and lenticular) galaxies is that tidally-induced asymmetric structure should correlate with signatures of a relatively young stellar population. Such a signature was found by Schweizer and Seitzer (1992; AJ, 104, 1039) at roughly 4 confidence. In this paper, we revisit this issue with a nearly ten-fold larger sample of galaxies selected from the Two Micron All-Sky Survey and the Sloan Digital Sky Survey. We parameterize tidal structure using a repeatable algorithmic measure of asymmetry, and correlate this with color offset from the early-type galaxy color–magnitude relation. We recover the color offset–asymmetry correlation; furthermore, we demonstrate observationally for the first time that this effect is driven by a highly-significant trend towards younger ages at higher asymmetry values. We present a simple model for the evolution of early-type galaxies through gas-rich major and minor mergers that reproduces their observed build-up from to the present day and the distribution of present-day colors and ages. We show using this model that if both stellar populations and asymmetry were ideal ‘clocks’ measuring the time since last major or minor gas-rich interaction, then we would expect a rather tight correlation between age and asymmetry. We suggest that the source of extra scatter is natural diversity in progenitor star formation history, gas content, and merger mass ratio, but quantitative confirmation of this conjecture will require sophisticated modeling. We conclude that the asymmetry–age correlation is in basic accord with the merger hypothesis, and indicates that an important fraction of the early-type galaxy population is affected by major or minor mergers at cosmologically-recent times.
Subject headings:
galaxies: elliptical and lenticular, cD — galaxies: structure — galaxies: interactions — galaxies: peculiar galaxies: evolution — galaxies: general1. Introduction
It has become clear in the last decade that the distribution of galaxies is bimodal in color, and that this bimodality correlates with the structure (or morphological type) of galaxies (Strateva et al., 2001; Kauffmann et al., 2003; Blanton et al., 2003). Early-type galaxies are dominated by a spheroid of stars supported largely by random motions, and tend to have red colors and very low present-day star formation rates. They populate a tight color–magnitude relation (CMR; Sandage & Visvanathan, 1978, Bower et al., 1992, Ruhland et al., 2009); the tightness of this CMR is an indicator of their rather ancient stellar populations (Trager et al., 2000; Gallazzi et al., 2006). In contrast, late-type galaxies are dominated by a rotationally-supported disk of stars, and tend to have significant ongoing star formation at the present day, and populate a reasonably broad (at optical wavelengths) blue cloud whose colors reflect a combination of recent star formation and dust (Schiminovich et al., 2007). The stellar mass functions for the two classes of galaxy are different; early-type galaxies can extend to much higher stellar mass than late-type galaxies (Bell et al., 2003). This bimodality persists at all redshifts up to (Bell et al., 2004a, b; Faber et al., 2007).
One of the most remarkable features of the bimodality in the galaxy population is the observed correspondence between galaxy structure and stellar populations. Models of galaxy formation in a cosmological context predict that the structure of a galaxy reflects the dynamical assembly (merger history) of a galaxy (Kauffmann, White & Guideroni, 1993; Cole et al., 2000), whereas the cooling of gas and subsequent star formation is a property of the warm/hot reservoir of gas in a halo, which is relatively unaffected by galaxy interactions (Cole et al., 2000; Cattaneo et al., 2006). Galaxy formation models with ‘standard’ ingredients — the formation and evolution of dark matter halos, gas cooling, star formation and stellar feedback — predict that almost all galaxies should be forming stars at an appreciable rate (Cole et al., 2000; Croton et al., 2006; Cattaneo et al., 2006; Keres et al., 2009). This is in direct disagreement with observations of a red sequence, and is usually interpreted (for good reasons) as indicating not just a minor failing of (admittedly uncertain) prescriptions for these physical processes; rather, this deficiency is interpreted as the signature of a completely separate physical mechanism.
In this regard, the empirical correlation between a lack of star formation and a prominent stellar spheroid (bulge) is an important clue to the mechanism suppressing star formation (Kauffmann et al., 2006). A bulge appears to be a necessary (but not sufficient) requirement for the shut-down of star formation (Bell, 2008). Taken together with the bulge mass–black hole mass correlation (Magorrian et al., 1998; Häring & Rix, 2004), it is not unreasonable to postulate that feedback from accretion onto a supermassive black hole (active galactic nucleus [AGN] feedback) is an important mechanism by which galaxies quench their star formation (Di Matteo et al., 2005; Springel, Di Matteo & Hernquist, 2005; Croton et al., 2006; Bower et al., 2006; Cattaneo et al., 2006; Hopkins et al., 2008a, b; Somerville et al., 2008; Johansson, Naab & Burkert, 2009); although other physical mechanisms may also play a role (see, e.g., Naab et al., 2007, Dekel & Birnboim, 2008, Khochfar & Ostriker, 2008, Johansson, Naab & Ostriker, 2009, Dekel & Birnboim, 2006, Birnboim et al., 2007 or Guo & Oh, 2008 on gravitational heating, the influence of the development of virial shocks, and the heating of large halos with cosmic ray energy).
Galaxy merging plays a decisive role in this picture. Toomre & Toomre (1972) and Barnes & Hernquist (1992) argued that a natural formation route for early-type galaxies (in particular elliptical galaxies) was through the major merger of two pre-existing galaxies (although see, e.g., Burkert et al., 2008, Naab & Ostriker, 2009 for discussions of limitations of this obviously over-simplified picture). In the intervening time, an impressive variety of evidence has been amassed showing that the properties of early-type galaxies, at least at the broad level, are consistent with those expected for merger remnants: e.g., overall kinematics (Naab, Khochfar, & Burkert, 2006; Jesseit et al., 2007; Hoffman et al., 2009), the widespread existence of kinematically-decoupled cores (Emsellem et al., 2007), the distribution of isophotal shapes (Naab & Burkert, 2003; Naab, Khochfar, & Burkert, 2006), surface brightness profile shapes (Naab & Trujillo, 2006; Hopkins et al., 2008c), and low-level tidal debris around many elliptical galaxies (Malin & Carter, 1983; Schweizer & Seitzer, 1992; van Dokkum, 2005; Tal et al., 2009). Observations of merger remnants support this picture also, having surface brightness profiles, velocity dispersions and sizes in the near-infrared that are similar to intermediate-luminosity early-type galaxies (Dasyra et al., 2006; Rotheberg & Joseph, 2006).
It is argued that shocks and non-circular motions in a galaxy merger cause the gas to lose angular momentum, leading to the growth of the black hole mass and conditions suitable for efficient coupling of energy from an AGN to the diffuse gas in a galaxy (Sanders & Mirabel, 1996; Hopkins et al., 2008a, b). Circumstantial support for this picture of merger-driven AGN activity and feedback is seen in the tendency for the AGN hosts to have intermediate colors (between blue cloud and red sequence; Schawinski et al., 2007, 2010), rapidly-outflowing metal-enriched gas at kpc from an active quasar at (Prochaska & Hennawi, 2009), and rapidly-outflowing gas ( km s-1) in post-starburst galaxies — such velocities are not expected to result from starburst-driven winds and were interpreted as being relics of a quasar-driven wind (Tremonti et al., 2007). In such a picture, the suppression (or quenching) of star formation is reasonably rapid and follows the merger event (Kauffmann & Haehnelt, 2000; Di Matteo et al., 2005).
Another aspect that has come into focus in the last years is that the formation of red sequence (and early-type) galaxies is an ongoing process; in particular, more than half of the early-type galaxy population has come into place since (see, e.g., Bell et al., 2004a, Bell et al., 2004b, Faber et al., 2007, Brown et al., 2007; see van Dokkum et al., 2010 and Robaina et al., 2010 for analyses focused on the most massive galaxies). Thus, one expects that the mergers (that create the early-type galaxies) and the physical processes that lead to the truncation of star formation (that make those early-types red) continue to happen at relatively recent times. In this case, these physical processes, and their late-time signatures, should be observable at the present day (see Hopkins et al., 2010a for a detailed and thoughtful discussion of merging and early-type galaxy evolution in a cosmological context).
In this context, the work of Schweizer & Seitzer (1992) is of much importance. Motivated by the merger hypothesis for the origin of early-type galaxies, they sought a correlation between fine structure (from a tidal origin) and color offset from the CMR (in Schweizer et al., 1990 they did a similar work with a smaller sample with absorption line indices). If gas-rich mergers are the primary way in which early-type galaxies are made, then one expects a correlation between color offset and fine structure. Schweizer & Seitzer (1992) found such a correlation with confidence, albeit with considerable scatter; Tal et al. (2009) found a similar result with a complete sample of nearby ellipticals. Schweizer & Seitzer (1992) used stellar population models to explore this result in more detail, finding that the early-type galaxy colors could be reproduced by a variety of post-merger ages from 2 to 6 Gyr, depending on the model parameters used.
Yet, a number of issues are left open by these works. Number statistics was a clear issue in both cases (e.g., Schweizer & Seitzer, 1992 had a total of 69 galaxies in their sample; Tal et al., 2009 had 55 galaxies in their sample), and testing with a larger sample is clearly desirable. The definition of fine structure adopted by Schweizer & Seitzer (1992) is motivated by the type of tidal features regularly seen around nearby early-type galaxies (Malin & Carter, 1983; Schweizer & Seitzer, 1988; van Dokkum, 2005; Tal et al., 2009), but has two limitations. Firstly, it is impossible to measure their fine structure parameter automatically. Tal et al. (2009) partially remedied this by defining a reproducible metric that is readily applicable to deep data, although they studied a sample of elliptical galaxies only. Secondly, high-contrast tidal features are often the result of minor mergers or accretions, not major mergers. Finally, at the time at which Schweizer & Seitzer (1992) was written, it was impossible to disentangle age and metallicity influences on spectral indices or colors; it is important to verify that age is in fact the driving parameter of any correlations seen.
Cognizant of these issues, we have initiated an effort to confirm and expand on the landmark results of Schweizer & Seitzer (1992). We have defined a volume and -band luminosity limited sample (§2) of early-type galaxies using the Two Micron All-Sky Survey (2MASS; Skrutskie et al., 2006), the Sloan Digital Sky Survey (SDSS; Abazajian et al., 2005), supplemented with redshifts from the NASA/IPAC Extragalactic Database (NED). We have used asymmetry as an automated and repeatable metric for tidally-induced structure, and have analyzed it in conjunction with SDSS colors, and, crucially, ages and metallicities derived from absorption-line spectroscopy (Gallazzi et al., 2005); these parameters are described in §3. Because of our use of the SDSS as our imaging data we analyze the brighter inner parts of early-type galaxies (less sensitive diagnostic of faint tidal features) but with the advantage of a larger sample (over 600 galaxies). We present our results in §4. Finally, bearing in mind the insight gleaned from redshift surveys of red sequence and early-type galaxy evolution, we were in a position to model the spectral properties of early-type galaxies more completely than Schweizer & Seitzer (1992); this discussion is presented in §5. The casual reader is invited to skip to §4 directly, focusing in particular on Figs. 6 and 11. In what follows, we use AB magnitudes and assume H, and .
2. Data and fitting
2.1. Sample selection
Our aim is to test the relationship between fine structure and color deviation from the CMR for early-type galaxies. In order to test this relationship, a representative (but not necessarily complete) sample is required, and at distances close enough to allow us to discern both the global and tidal structure of early-type galaxies. Accordingly, we have chosen galaxies within a relatively thin, and nearby, distance shell for study. The bulk of our sample can be drawn from the SDSS, but the relatively bright galaxies in this sample lack SDSS spectra (for a variety of reasons, but partially because their fiber magnitudes were too bright to target as part of the SDSS main survey).
Accordingly, we have taken a hybrid approach for this work. The primary object selection was made from the 2MASS All-Sky Extended Source Catalog. We selected galaxies brighter than 13.5 mag in . We retrieved redshifts for these objects either from NED111The NASA/IPAC Extragalactic Database, http://nedwww.ipac.caltech.edu/ or SDSS, matching the objects by position; NED was used to fill in objects lacking spectroscopy from the SDSS. In order to achieve a good redshift completeness we only included galaxies from regions of the sky that are fully covered by spectroscopic sample of the SDSS DR3.
As described in detail by McIntosh et al. (2006), from a comparison to the SDSS main galaxy sample, it turns out that the K-band incompleteness of 2MASS is modest and the only major source of incompleteness are blue low surface brightness disk galaxies. In order to check the completeness of our particular 2MASS selection we follow a similar philosophy to Bell et al. (2003) and McIntosh et al. (2006), by exploring the 2MASS properties of galaxies selected in the optical regime. We selected a sample of galaxies with known redshifts and SDSS photometry from NED. With the same procedure as described in Bell et al. (2003), the SDSS magnitudes and the redshifts were fit with stellar population template spectra derived using the PEGASE stellar population code (see Fioc & Rocca-Volmerange, 1997, for an earlier version of the model). These template fits were used to estimate -corrections for the sample, and permitted estimation of the -band magnitude of a galaxy from the optical fluxes alone. In this way we could explore whether 2MASS detected all the galaxies which one would a priori expect to be detected. The integrated incompleteness is approximately 5%. Fig. 1 shows the color dependence of the completeness at , showing that the sample is less complete at bluer colors.


Figure 2 shows the completeness of the redshift data coming from the two sources. SDSS is most incomplete at the bright magnitudes, whereas in NED the completeness decreases with magnitude. This trend dominates the combined catalog, but the decrease of the completeness is much more moderate. With our selection criteria, at least one of the redshift data (SDSS or NED) is available for 91% of the galaxies, the incompleteness mainly coming from faint, galaxies.
For the structural studies we select a nearby subsample which is volume limited between . The corresponding and K-band absolute magnitude limit is (which approximately corresponds to , Bell et al., 2003). This sample contains 3006 galaxies. Its estimated completeness is approximately 90%; this completeness is dominated by the spectroscopic incompleteness (largely from SDSS, and this is primarily a geometric effect owing to the inability to place fibers on all objects) coupled with a modest trend to miss out low surface brightness, blue objects; for red galaxies, the focus of this work, the sample is essentially limited only by SDSS fiber placement.
2.2. Fitting
We carried out image fitting with GALFIT to select early-type candidate systems. For fitting the galaxy profiles we constructed an automated pipeline involving programs SExtractor version 2.3.2 (Bertin & Arnouts, 1996) and GALFIT version 2.0.3. (Peng et al., 2002). SExtractor creates a catalog of sources from an astronomical image. The output parameters can be used to create an initial setup for light profile fitting with GALFIT.
We pipeline was run on SDSS -band images. For each image, SExtractor was used to look up all sources and to identify the target galaxy, using SDSS positions as input. Besides our primary galaxy, we fit the nearby objects that could influence the light profile fit of the main galaxy. The selection of these secondary targets was made by distance and intensity: the object was ignored if the distance between the two objects exceeded 1.5 times the sum of their sizes, or the intensity of the secondary object was lower than 1% of the main object. In some cases SExtractor identifies parts of the galaxies, such as large Hii regions as separate objects. In order to correct these cases, check images were created with labeled fit targets. The images were visually inspected and unnecessary sources were untargeted. These results were used to create the GALFIT initial setup.
The main target galaxies were fitted with a Sérsic (1968) profile
| (1) |
where is the effective radius of the galaxy, is the surface brightness at this radius, is the Sérsic index (in the special case when we get the exponential profile, corresponds to de the Vaucouleurs profile) and so that the half of the flux is within . The nearby objects (secondary targets) were fitted either by Sérsic or, if more star-like, by the point spread function (PSF). The PSF was created from stars of each field image separately, based on Moffat profile fits in the form:
| (2) |
where is the dispersion radius and is the power-law index.
Initial values for sky level, flux, size and axis ratio were set using SExtractor output parameters. The Sérsic index and axis ratio for galaxies were set to initial values common for all objects, , . The fit parameters were constrained using empirical (observational) and SExtractor output information: was required to lie in the interval , axis ratio , position within 2 pixels of the SExtractor value, and half-light radius between 0 and 1.5. The pipeline first fits the objects separately, keeping the other objects fixed, and then finally fits the objects all together in the end, using their separate fit results as the initial guess. The sky is fixed at all times.
One way to test the fitting pipeline is to fit simulated objects of known parameters. We used a suite of simulated galaxies composed from a Sérsic bulge + exponential disk, with a wide range of magnitudes, bulge to total ratios and light profile parameters. We selected a test sample similar to our sample of interest: bulge dominated systems, having bulge to total ratios and magnitudes brighter than (the cut corresponds approximately to ). The simulated galaxies were fit by the pipeline described above. The fits give us an important sanity check of the fitting procedure. Our results show that Sérsic fit works relatively well, the simulated magnitudes are reproduced with an error mag for the test sample.
When fitting the real images, the Sérsic fit is successful and gives results similar to the SDSS photometric parameters for the majority of our galaxies. It also corrects the known error of the SDSS imaging pipeline that it tends to split up large objects into multiple sources. This affects 4.6% of the objects in our sample, mostly objects with . The Sérsic fit fails in 1.5% of the cases because the fit did not converge or the image file was corrupt. 1.9% of the fit results are unreliable because the fit did not move out from the initial setup or reached the fitting boundary. Figure 3 shows the fitted sizes (circularized ) compared with the SDSS radii. The fit gives results consistent with the SDSS sizes within 15%, when outliers are discarded.
We choose galaxies for further study, which appears to be a reasonable way to automatically reject a significant fraction of the disk-dominated galaxies (Bell et al., 2004b)222If instead a selection by -band concentration as calculated by the SDSS (defined as the ratio of the aperture containing 90% of the flux in the Petrosian radius to the half-light radius) being larger than 2.6 (Strateva et al., 2001) was used, the sample would remain unchanged at the 90% level.. We further exclude all objects with failed fits, as described above. The criterion is deliberately generous, and includes a large number of galaxies with prominent disks (Bell et al., 2004b). Accordingly, we classified the subsample by eye, classifying 553 objects as elliptical (pure bulge; E), 498 as lenticular (smooth, non-star-forming disk; S0), 479 as later types (Sa-Irr) and 27 as mergers.
We choose to visually exclude all galaxies with stars or companion/projected galaxies which made a major contribution to the asymmetry in the area in which asymmetry is measured. The spirit of this cut is to excise all systems where we were concerned that the asymmetry measurement would be corrupted by a non-interacting (or non-strongly-interacting) object (be it a projection or an interaction). While some form of masking might have been desirable, we adopted this conservative approach to account for objects missed by SExtractor and because the extent of the masked area is never straightforward to choose. We lose a little over 1/3 of the sample using this cut (it is our most important cut), and the loss is primarily geometric (and therefore introduces no bias) for the galaxies lost from bright stars and projections, and those galaxies thrown out because of a pre-merger satellite. We have confirmed that the color–magnitude diagram of these excised galaxies is very similar to the final sample of galaxies without projections (there are a few more outliers in the redwards and bluewards directions in the excised sample compared to the final sample, as is expected from a sample of galaxies where there is a projected star or galaxy contaminating the photometry). There is some natural fuzziness in this process, and some advanced mergers where the second nuclei (and large amounts of tidal disturbance) were within the asymmetry measurement area were included in the sample. After this final selection our sample contains 288 E and 319 S0 type galaxies, together 607 objects.
3. Asymmetry and stellar population measurements
For the investigation of the correlation between the post-merger structure and stellar population we need to construct two broad classes of metric: descriptions of the (hopefully tidally-induced) non-equilibrium structure of an early-type galaxy (§3.1), and parameters characterizing the stellar population, like color, age, and metallicity (§3.2).
3.1. Structure
We choose to use asymmetry as a repeatable diagnostic of non-equilibrium structure. This measure is insensitive to symmetric bars and rings (unlike the residual structure measures used by Tal et al., 2009), which are important structures in some S0s but are not (at least unique) indicators of a recent perturbation. Our metric is not as tailored as the fine structure parameter used by Schweizer & Seitzer (1992), but the asymmetry measurement is repeatable and can be automatically applied to survey datasets.
We adopt an asymmetry measure similar to methods discussed by Conselice, Bershady, & Jangren (2000). We measure asymmetry within an elliptical annulus of 0.8–3 . In this way we minimize the impact of the bright galaxy core on our asymmetry measure which would otherwise be very sensitive to centering uncertainties and the influence of dust disks and features in the inner part of early-type galaxies333Note that initially we chose to adjust the center to minimize asymmetry within 0.5. Galaxies with significant asymmetry often showed that the center of the brightest isophotes was offset from that of the fainter isophotes, yielding a change in the asymmetry with radius. We found that the GALFIT center was very close to a choice that minimized , with good S/N. Accordingly, in what follows, we choose to use the GALFIT center, and omit the central regions from the asymmetry measure. . A different choice of the aperture does not influence the results qualitatively, unless the inner is included in the asymmetry measure. The asymmetry calculating algorithm is carried out as follows in the steps 1-7, for an illustration see Figure 4.
-
1.
Rotate the image around the GALFIT center by 180∘.
-
2.
Subtract the rotated image from the original one.
-
3.
Integrate flux in quadrature within the elliptical annulus between 0.8-3 . This measure will have an additive contribution from noise which can be separated and corrected for. Let us separate the flux into signal and noise term, and analogously for the rotated image . Then the asymmetry flux integrated in quadrature over the image will read
(3) as signal and noise, as well as the both noise terms are uncorrelated. This will result in a non-zero asymmetry even in the case of , i.e. perfectly symmetric underlying signal. We can correct for this by estimating the noise contribution and subtracting it from the integral. We estimate using the GALFIT model image with noise similar to the observed data.
-
4.
Apply Poisson noise + read noise to the (symmetric) GALFIT model image.
-
5.
Measure asymmetry in the same way as for the actual image (steps 1-3, rotate, subtract, integrate in quadrature).
-
6.
Subtract model asymmetry from the object asymmetry.
-
7.
In the end we make the asymmetry measure independent of the total flux: normalize by the object (sky subtracted image) flux squared and integrated within the same area.
To summarize, our asymmetry measure is defined as
| (4) |
where denotes the flux of the galaxy, is the fitted Sérsic model, the primes denote the corresponding quantities rotated by 180 degrees, and the summation goes over pixels within the elliptical annulus 0.8-3 . Because the asymmetry is determined from the square of the asymmetry image, values of 0.01 are already very highly significant, suggesting asymmetries involving % of the flux (this definition counts asymmetric flux from both the positive and negative parts of the asymmetry image; other definitions divide the asymmetry by two to account for this effect).
The uncertainties in asymmetry were calculated in two complementary ways. Random uncertainties were estimated by subjecting symmetric model galaxies with realistic model and sky noise properties to the same procedure above; these random uncertainties are , and are shown by the horizontal component of the cross-shaped error bars in Figs. 6, 11 and 12. The second estimate of asymmetry uncertainty is systematic in nature, reflecting our choice to neglect the inner 0.8 when estimating the asymmetry (in order to minimize the effect of small centering uncertainties, and the influence of small dust lanes or disks in the inner parts of these early-type galaxies). We changed the inner cutoff to 0.6-1 and the outer cutoff to 2-4 ; the result was that the asymmetries changed significantly, because of the different area being probed, but to first order all galaxies moved to higher or lower values of asymmetry together. Experimentation revealed that the best way to visualize this source of uncertainty is as an uncertainty in asymmetry rank. The rank changed typically by %; we assign an asymmetry rank error of 5%, and for the purposes of visualization we translate this rank uncertainty into an asymmetry uncertainty using the asymmetries of galaxies that have ranks 5% different from the galaxy of interest. We show error bars calculated in this way in Figs. 6, 11 and 12 as the solitary horizontal error bars. The uncertainties from this source are a strong function of , increasing from very small values for low values of to large values for the tail of galaxies extending to large .
3.2. Stellar population diagnostics
We choose for consideration in this work two types of stellar population diagnostics: galaxy colors, as an indicator of broad changes in the stellar population; and luminosity-weighted stellar ages and metallicities — available for roughly 2/3 of the sample — as model-dependent but more information-rich stellar population diagnostics.
We use SDSS model color corrected for foreground extinction and AB offset, then k-corrected using method of Bell et al. (2003). Note that these colors are very similar to colors we measured ourselves within , and the results change only imperceptibly when such colors are used. We adopt the model colors because these are readily and publicly available. We assign uncertainties of 0.03 mag in g-r color to account for random photometric errors (sub-dominant) and calibration uncertainties from galaxy-to-galaxy in the zero-points of the SDSS photometry (the dominant contribution). The color combination was used because it is the bluest well-measured SDSS color combination. While, in principle, color is more sensitive to stellar population (as it straddles the 4000Å break), -band has poor S/N, and suffers from increased systematics compared to -band.
In order to aid in disentangling the effects of the age/star formation history of a galaxy from metallicity in driving its color, we use estimates of luminosity-weighted age and metallicity from Gallazzi et al. (2005). Gallazzi et al. (2005) derived ages and metallicities from all SDSS spectra with median S/N per pixel. This stringent S/N cut selects only of all galaxies, primarily those with high surface brightness cores. Our sample consists of E/S0 galaxies only, and therefore is much more complete than the whole sample: 97% of the Es and S0s in the sample with SDSS spectra in DR4 have age and metallicity estimates from Gallazzi et al. (2005).
Ages and metallicities are derived by comparing observed spectral absorption features (three primarily age-sensitive indices, 4000Å break strength D4000, H, H H, and two primarily metallicity-sensitive indices and ) with a library of Bruzual & Charlot (2003) models with a wide range of star formation histories and metallicities. The models have solar abundance ratio patterns (i.e., they do not allow for -element enriched abundance patterns), but the impact of this shortcoming on the derived ages and metallicities is not that severe owing to the choice of combined Magnesium and Iron indices as the metallicity-sensitive indices (see Gallazzi et al., 2005 for details and more discussion). In this paper, the main emphasis is on the age estimates (recall that the hypothesis being tested is that richly-structured early-type galaxies have younger ages), which depend primarily on the Balmer lines and the strength of the 4000Å-break. These ages are luminosity-weighted, i.e., the ages are the mean luminosity-weighted ages of the models that provided a reasonable fit to the five observed spectral indices, and are correspondingly younger than the mass-weighted ages of those model populations.
Section 2.4 of Gallazzi et al. (2005) discusses in detail the sources of random and systematic error in these age and metallicity estimates. Briefly, random errors (from the spectra themselves) do not cause any systematic shifts in the median ages or metallicities from their correct values (verified using simulations), and for our subsample lead to a typical uncertainty in log age of 0.1 dex and metallicity of 0.09 dex. The main systematic errors were identified to be alpha element overabundance uncertainties and the degree of burstiness in the star formation history of the galaxy population. The systematic errors in metallicity and log age from these sources was argued to be less than 0.05 dex for relatively large variations in alpha element overabundance and the fraction of galaxies undergoing large bursts (we will discuss further these uncertainties in §4.1). It is worth noting that the luminosity-weighted ages are reasonably model-dependent, and depend on when star formation is assumed to start and to the timing and amplitudes of bursts of star formation. For example, a model with given line strengths could be fit by a population that started forming stars 12 Gyr ago, or only 5 Gyr ago; this will naturally lead to dramatic differences in luminosity-weighted age. Accordingly, in this work, we use luminosity-weighted ages primarily as a tool to understand relative trends in age, and to attempt to disentangle the effects of age and metallicity on broad-band colors.
4. Results

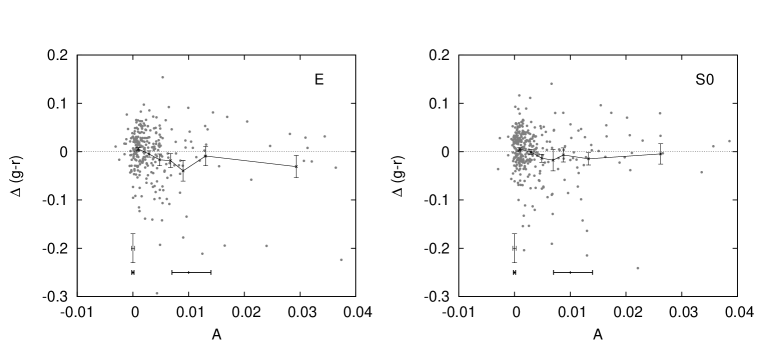
Figure 5 shows the CMR for the 605 E/S0 galaxies in our sample with measured asymmetries and SDSS Model magnitudes. We fitted a line to the main locus of the CMR, excluding blue outliers at from the fit. The equation of the fitted line is
| (5) |
We subtract this linear relation from the color to get the color offset from the red sequence: . The scatter of is with -clipping applied; much of this scatter is intrinsic (not measurement error, the typical measurement error in model for our sample is mag and is dominated by flat fielding and calibration uncertainties; see also Schweizer & Seitzer, 1992 and Ruhland et al., 2009 who also measure similar intrinsic scatter in the CMR444for the purposes of comparing scatter in with , note that ). The mean color offset is slightly negative, , because of the clipping of very blue outliers from the CMR fit.
| Sample | |||||
|---|---|---|---|---|---|
| Color–asymmetry | |||||
| E | 288 | -0.203 | 0.00026 | -0.114 | 0.027 |
| S0 | 319 | -0.0851 | 0.065 | -0.111 | 0.024 |
| all | 607 | -0.161 | 3.5 | -0.111 | 0.0031 |
| Color–asymmetry and | |||||
| E | 250 | -0.169 | 0.0037 | -0.107 | 0.046 |
| S0 | 275 | -0.139 | 0.010 | -0.121 | 0.023 |
| all | 525 | -0.157 | 0.00015 | -0.114 | 0.0045 |
| Age–asymmetry | |||||
| E | 190 | -0.37 | 7.4 | -0.363 | 2.9 |
| S0 | 199 | -0.316 | 2.8 | -0.375 | 6.4 |
| all | 389 | -0.351 | 5.4 | -0.376 | 6.2 |
| Metallicity–asymmetry | |||||
| E | 190 | -0.22 | 0.0012 | -0.0486 | 0.25 |
| S0 | 199 | -0.073 | 0.15 | -0.0178 | 0.40 |
| all | 389 | -0.173 | 0.00031 | -0.0235 | 0.32 |
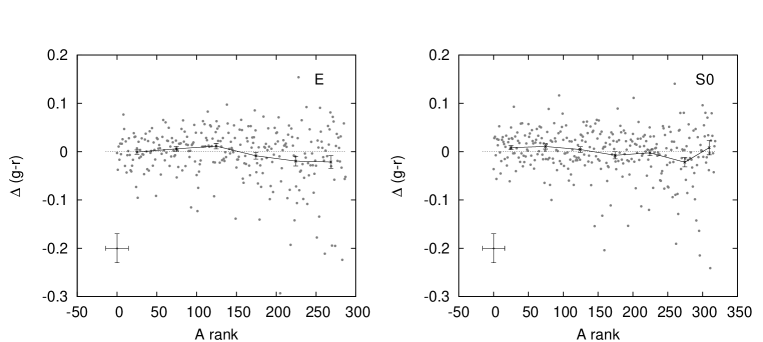
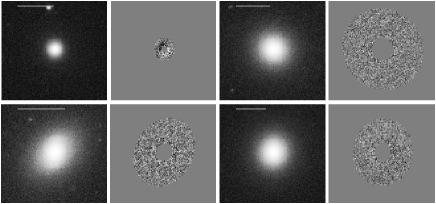
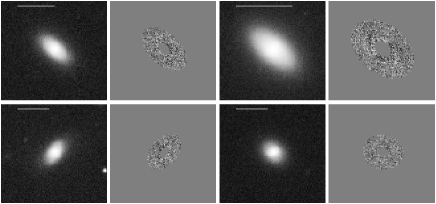
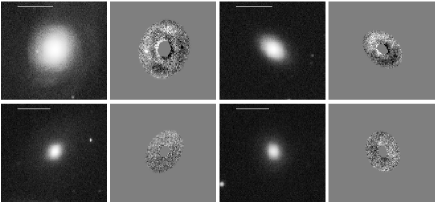
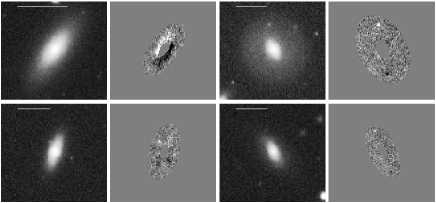
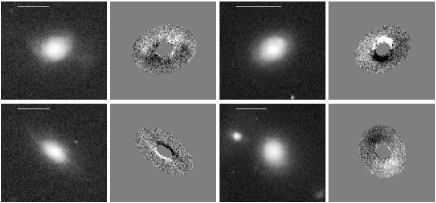
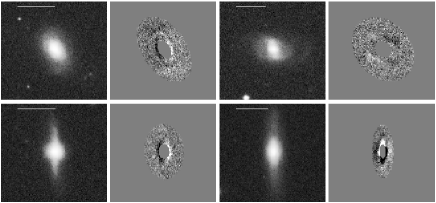
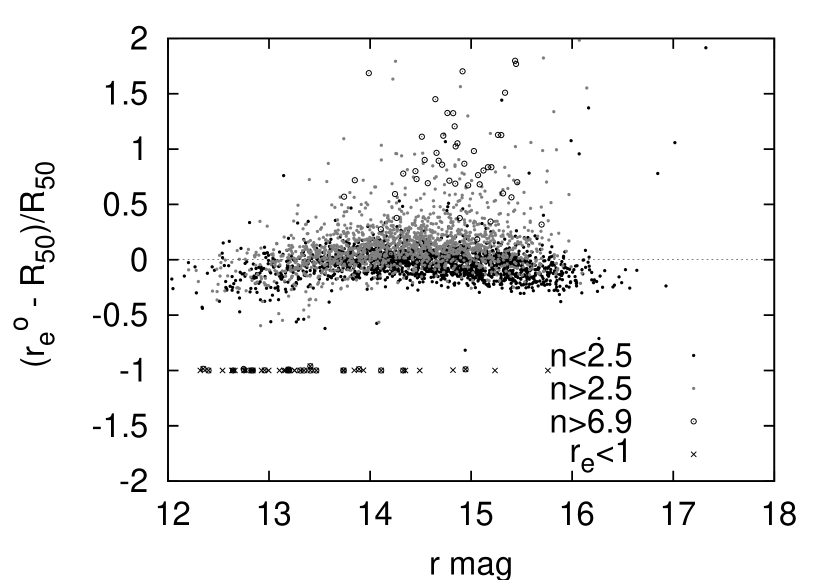
Figure 6 shows the color offset as a function of our asymmetry measure, with bin averages plotted with lines (5 bins equally spaced between of 0 and 0.01, a bin with and one with ). The data show a correlation between asymmetry and color offset for both E and S0 galaxies, with approximately the same slope and zero point; this figure can be compared reasonably directly with Figs. 2 and 3 of Schweizer & Seitzer (1992), and confirm their detection of a significant correlation between substructure in early-type galaxies and the offset from the CMR.
One obvious feature of this correlation is that it is very scattered; the scatter in the CMR exceeds the magnitude of the correlation between color offset and asymmetry. This scatter is primarily intrinsic (i.e., not measurement error; see for example Gallazzi et al., 2006 for a demonstration that the stellar populations of galaxies on the red side of the CMR differ substantially from those on the blue side). We explore this issue in sections 4.1 and 5.1.4 in some depth.
The correlation is clearest for — the run of both the mean and median color at is very similar. At larger asymmetry values, in particular for elliptical galaxies, there are quite a few galaxies with significant asymmetry but relatively red colors — the median color for ellipticals is reasonably red. We discuss this later in §5.2 in the context of dissipationless merging between already gas-poor early-type galaxies. Nonetheless, the bulk of the early-type galaxy population (those with ) shows a trend between color offset and asymmetry. To help visualize the trend, we ranked the E/S0 galaxies by and show how rank correlates with color in Fig. 7. We have investigated the significance of the correlation between and using Pearson’s correlation coefficient and Spearman’s rank correlation coefficient (see Table 1 for the full breakdown by galaxy type and stellar population diagnostic)555 We present one-sided probabilities as we test the significance of the observed (and expected) anticorrelation between stellar population diagnostics (color/age/metallicity) and asymmetry.. The correlation between and exists but has large scatter. Over the full range of color and asymmetry, the correlation between and has less than a 0.0035% probability of being from chance alone as estimated using Pearson’s correlation analysis (or a 0.015% probability of being from chance alone if one restricts attention to relatively low asymmetries and small color offsets). If instead one studies ranked color offsets and ranked asymmetries, a Spearman’s rank correlation analysis argues that the relationship between asymmetry and color for the combined E/S0 sample has less than 0.5% probability of being given by chance alone666This is a relatively modest significance, and if this were the only set of stellar population diagnostics, one may be concerned about the existence of this correlation. We will illuminate this issue later in §4.1.. In all cases, the values of correlation coefficient and significance change little if different contributions of inner/outer radii are used for defining the asymmetry values.
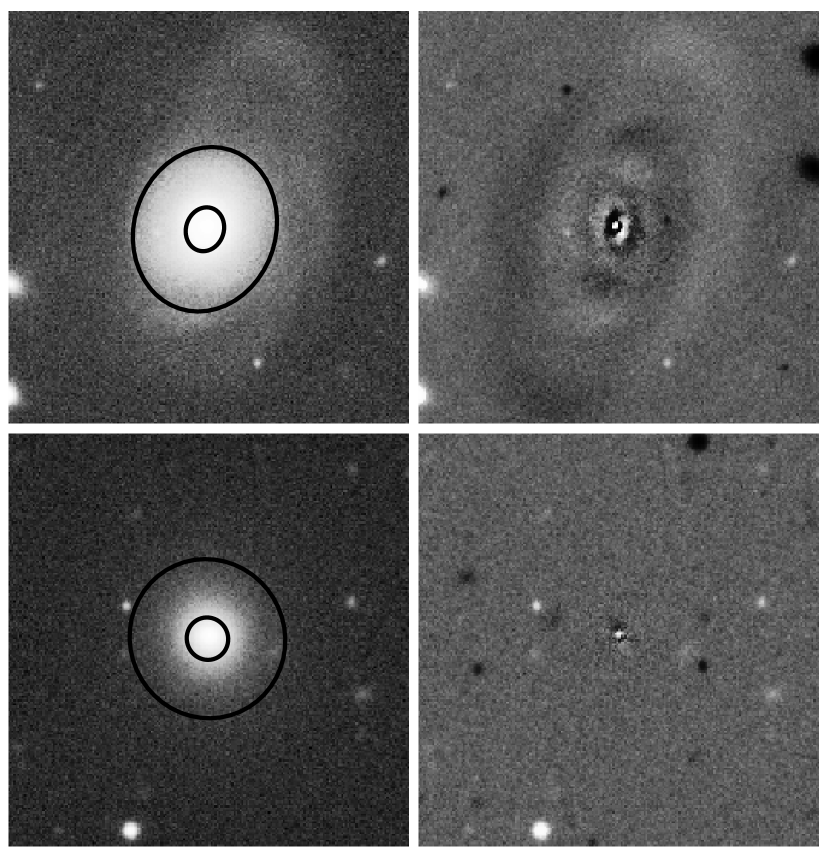
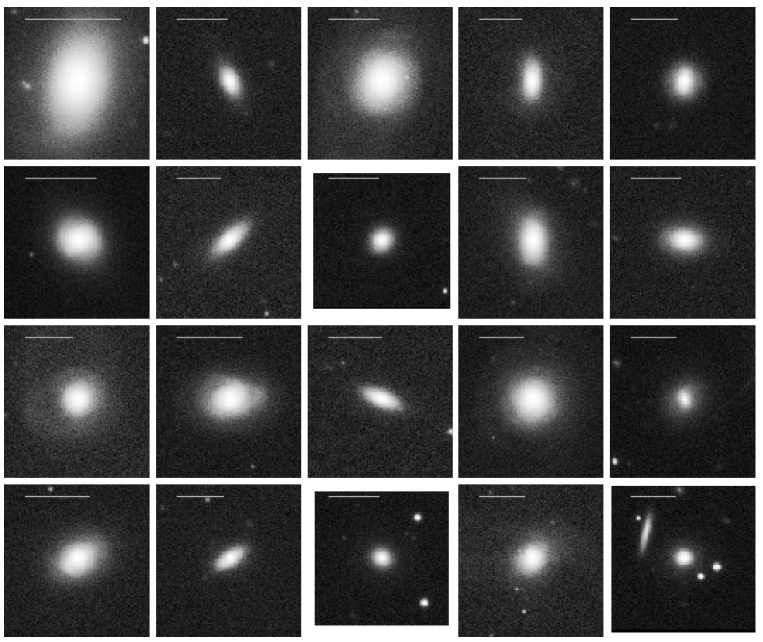
In Figures 8, 9, and 10 we show several examples of different asymmetry values for both morphological types, to allow the reader to generate some intuition for the asymmetries shown by the sample. In Fig. 8 shows a sample most symmetric Es and S0s, with asymmetry in the range . Fig. 9 shows galaxies with ; galaxies in this range are those that drive the bulk of the correlation between color offset and asymmetry. Fig. 10 shows highly asymmetric galaxies from the asymmetry bin . It is clear that the asymmetries being discussed here are not from isolated Hii regions, or low-level spiral arms; rather, these asymmetries are to a great extent driven by large-scale asymmetries, many of them matching qualitatively the form expected for tidal features. Taken together with Fig. 6, these figures underline the primary result of this work (and Schweizer & Seitzer, 1992; Tal et al., 2009): early-type galaxies with asymmetric signatures of tidal interactions tend to be offset from the locus of the CMR, in the sense that more asymmetric galaxies tend to be bluer than undisturbed galaxies (albeit with large scatter around this trend).
4.1. What drives these correlations, age or metallicity?
One of the unavoidable limitations of the work of Schweizer & Seitzer (1992) was that it was impossible to explore quantitatively whether it was age or metallicity that was driving the color–fine structure relation. Here, we make use of estimates of luminosity-weighted stellar age and metallicity, available for almost all of the of our sample with SDSS spectra (Gallazzi et al., 2005), to address this question quantitatively.
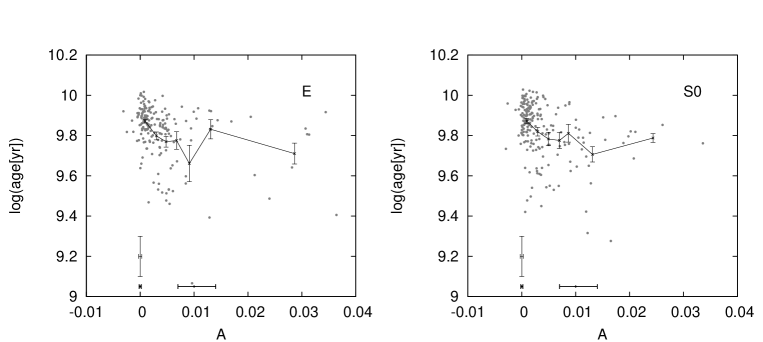
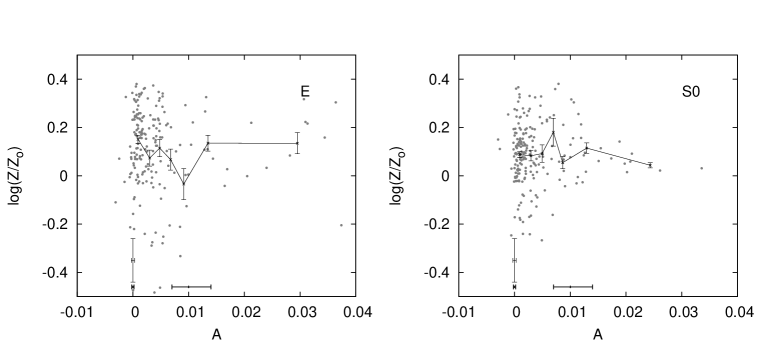
Figs. 11 and 12 show the run of luminosity-weighted age and metallicity as a function of asymmetry separately for E and S0 galaxies (the trends in median age/metallicity are very similar). There is a very strong correlation between age and asymmetry for both E and S0 galaxies (combined E/S0 sample has an essentially zero chance of being due to chance alone, from a Pearson’s or Spearman’s correlation coefficient), and a substantially weaker or no correlation for metallicity (with a 0.031% chance of being from chance alone according to a Pearson’s correlation coefficient, and a 1/3 chance of being from chance alone as measured by a Spearman’s coefficient).
It is worth discussing briefly the sources of uncertainty in this result. The random uncertainties ( dex in both log age and metallicity) are of little importance in this particular analysis, as one is seeking relative trends within a large and homogeneous dataset. The composite datapoints (mean for subsamples of 20 or more galaxies, typically) have small random uncertainties ( dex), and differences of dex in e.g., age between and are detected with great significance. Systematic effects could be more important. For example, if there were systematic differences in alpha element overabundance as a function of asymmetry to the tune of dex in alpha element overabundance (a very large effect), a trend in age of up to 0.05 dex could be produced (smaller than the observed trend in age with asymmetry) in conjunction with an offset in metallicity of similar amplitude but opposite sign (§2.4 of Gallazzi et al., 2005). Such a tendency is not seen; it is likely that alpha element overabundance is not an important driver of the observed trend in age (and weak or no trend in metallicity). Furthermore, as we saw earlier, changes in the inner/outer radii used to define asymmetry also change the results very little. One is left to conclude that genuine differences in star formation history, either through offsets in the age of the bulk of stars in the systems, or through a higher incidence of significant recent (last few Gyr) star formation activity between symmetric and asymmetric early-type galaxies is the main driver of the age–asymmetry (and therefore color–asymmetry) trend.
We can therefore conclude that the color–structure correlation is, to the extent that we can tell, driven primarily by age effects; this observation verifies the fundamental assumption made by Schweizer & Seitzer (1992). The correlation is actually substantially clearer in age–asymmetry space, as the contribution from random scatter in the metallicities to the color–asymmetry trend act to scatter out the color–asymmetry relation.
5. Discussion
Motivated by the work of Schweizer & Seitzer (1992), we showed that the color offset from the early-type galaxy CMR correlates with (primarily tidally-induced) asymmetry, although the scatter in the correlation is large. We showed, for the first time, that this correlation is driven primarily by age effects. In this section, we will explore further the meaning and limitations of these results. We will present a quantitative model-based discussion of the results, focusing on the bearing that these results have on the hypothesis that one of the primary formation routes of early-type galaxies is through galaxy merging. Then, we will wrap up with a discussion of the limitations of this work, and scope for future improvements.
5.1. A quantitative model of red sequence offsets
Like Schweizer & Seitzer (1992), we show a relationship between color offset from the red sequence and asymmetric structure of a galaxy. In Schweizer & Seitzer (1992), it was argued that the ‘fine structure’ being measured was a strong indication of a previous gas-rich galaxy merger. Thus, in that paper, they presented a model in which early-type galaxies were the product of gas-rich major merging, and they studied the time taken for major merger remnants to age as a way of translating their color offsets into timescales for early-type galaxy evolution. Their model had a number of free parameters: the two key parameters and controlled the duration and prominence of star formation after the merger event. They found that these parameters were of great importance in setting the timescales for fading of the remnant. In models with a large value of the remnant reddened only slowly, reaching the red sequence only after many Gyr. In models with short-lived post-merger star formation, they found a rapid evolution onto the red sequence.
One of the motivations of their work was to address the ‘gap’ between clear remnants from relatively recent mergers ( Gyr ago, e.g., NGC 3921 or NGC 7252) and ‘ancient’ early-type galaxies. Schweizer & Seitzer (1992) quote King’s question to Toomre at the 1977 Yale conference777Neither of us were at the Yale conference.: “You showed us 10 merging pairs and then asked us to look for, or at least accept the existence of, 500 remnants from so long ago that they no longer bear the ‘made by Toomre’ label. I would be much more impressed if you showed us the 20 or 30 such systems in the box immediately adjacent in your histogram. What do these merged pairs look like in their next few galactic years?”. While Schweizer & Seitzer (1992) argued that the blue, structured early-type galaxies in their study were reasonable candidates to fill the ‘King gap’, the considerable sensitivity of the evolution of the merger remnant to the properties of the merger and star formation after the merger made it difficult to reach a unique conclusion.
In this subsection, we revisit this issue with the benefit of more advanced stellar population models, and more critically, a more physically-motivated model for the color evolution of early-type galaxies. We will argue that the systems explored in this paper (and in Schweizer & Seitzer, 1992) fill the ‘King gap’, but that owing to natural scatter in the merger history of early-type galaxies and in the stellar populations of these newly-formed early-type galaxies, it is impossible to connect systems one-to-one with a given merger time with data of the type that we use here; King’s question was ill-posed, and will be very difficult to answer unambiguously.
5.1.1 Model ingredients
Clearly, there is a huge parameter space that can be explored when modeling the evolving early-type galaxy population, and arriving at a single unique picture that is clearly superior to the others will be impossible (as clearly articulated and demonstrated by Schweizer & Seitzer, 1992).
We take an approach that is motivated by the last decade of research on the evolution of the early-type galaxy population. There are now a number of surveys that have empirically tracked the evolution of the stellar mass density in early-type galaxies, with the general result that the growth in stellar mass density is driven primarily by an increase in the number of early-type galaxies (Chen et al., 2003; Bell et al., 2004a; Brown et al., 2007; Faber et al., 2007). Star formation is shut off in blue star-forming galaxies, and the remnant fades and reddens onto the red sequence (Bell et al., 2007). The exact mechanisms that shut off star formation are still a matter of some debate (merging and AGN feedback, environment, or gas exhaustion are all possibilities; furthermore, the balance of such processes and timescales on which they operate is likely to depend on a variety of parameters such as galaxy mass, or merger mass ratio; e.g., Johansson, Naab & Burkert, 2009); also open is the issue of how important any burst of star formation might be before the truncation of star formation (see Robaina et al., 2009 for a discussion of the average effects of galaxy mergers on star formation rate). Notwithstanding this uncertainty about mechanisms for shutting off star formation, it is not unfair to assume that the timescale for truncation of star formation is short, Gyr888We are assuming in the terminology of Schweizer & Seitzer (1992) that Gyr.. Evidence indicating the short timescale for star formation truncation include the detection of rapid, arguably AGN-driven winds in post-starburst999Galaxies with signatures of no current star formation but substantial star formation 1 Gyr ago. galaxies (Tremonti et al., 2007), the pronounced bimodality101010such bimodality is washed out if transitions from blue to red take any longer than 1 Gyr in the star formation rates of galaxies (Strateva et al., 2001; Bell et al., 2004a; Schiminovich et al., 2007), the high incidence of concentrated, post-starburst AGN galaxies in the ‘valley’ between the star-forming and non-star-forming galaxies (Schawinski et al., 2007), the modest population of blue morphologically early-type galaxies (if extended periods of star formation followed a merger, a large fraction of star-forming early-type galaxies would be observed; such a population is not common; Häußler, 2007, Ruhland et al., 2009, this paper) and analysis of the spectra of early-type galaxies (Gallazzi et al., 2006). In the context of this paper (which was motivated originally by the merger hypothesis), we will suppose that merging rearranges the stellar content of the remnant into a more spheroidal configuration and leads to the suppression of future star formation through AGN feedback or some other mechanism.
Thus, we model a constantly-growing early-type galaxy population (an exercise similar in spirit to, e.g., Harker et al., 2006, Ruhland et al., 2009, or Naab & Ostriker, 2009) as a population of galaxies with constant star formation rate, that then stop forming stars at times drawn from the following probability distribution: , where is the age of the galaxy in Gyr. For concreteness, we choose to assign Gyr, i.e., the formation of early-type galaxies in this model started 12 Gyr ago and continues at a slowly-reducing rate to the present day. Our default models are truncation-only for simplicity; we show later that bursts of star formation on truncation affect the results very little. We assign an early-type galaxy a metallicity drawn from a distribution with and a mean of solar metallicity111111The mean metallicity is of no importance in this paper, because we are exploring residuals from the color–magnitude relation., motivated by the metallicity scatter inferred by Gallazzi et al. (2006). We use the multi-metallicity PEGASE stellar population model to explore the color evolution of the early-type galaxy population. We neglect, for the sake of simplicity, possible differences in formation history as a function of galaxy mass121212We see no significant difference in the behavior of this sample, when splitting into a high-mass and low-mass subsample, justifying this oversimplification., while noting that the mean mass of our sample is somewhat less than .
5.1.2 Major merger model


The above model incorporates the effect of only one major merger: the one that created the early-type galaxy. The results of such a model are shown in Fig. 13; the results of a very similar model where 10% of the stars are formed in a burst on merging (motivated by Robaina et al., 2009) are shown in Fig. 14, and are very similar to the truncation-only model. The upper left panel shows the build-up in the number density of model red sequence, early-type galaxies, compared with observations of the build-up of the red sequence stellar mass density from Borch et al. (2006). The upper right panel shows the predicted evolution in the CMR zero point and scatter (think of this plot as a slice through the evolving color–magnitude relation at constant stellar mass): it is clear that there is a ‘core’ of red sequence galaxies, with a tail of blue early-type galaxies.
In the center left panel, we explore the relationship between truncation time (when star formation ceased) and color offset from the , 12 Gyr red sequence. One can see that after truncation of star formation, the model galaxy reddens rapidly, within Gyr, to within 0.1 mag of the red sequence. The subsequent reddening of the population is much slower. ‘Typical’ structured early-type galaxies, with , would be interpreted to be between 2 and 8 Gyr from their truncation event (depending on metallicity)131313 Recall that many of the early-type galaxies with slightly blue colors have little asymmetry in Fig. 6, and the large magnitude of this metallicity-dependent scatter in truncation time for a given color offset presents a natural and appealing explanation for this phenomenology. . It is to be noted that this timescale (in its value and scatter) is in rough agreement with Schweizer & Seitzer (1992); early-type galaxies less than from the locus of the color–magnitude are expected to be more than 1 Gyr from their ‘creation event’. The oldest red sequence galaxies are redder than the core of the CMR. This is one of the reasons that the locus of the CMR appears to evolve slower than an ageing stellar population in such models; the average color of an early-type galaxy is always being pulled bluewards by new arrivals to the red sequence.
We presented this relationship between truncation time and , but can it have any relationship to reality (this, at some level, is the part of the question that Schweizer & Seitzer, 1992 were less able to address quantitatively)? Put differently, in a model which is constrained to reproduce the number density evolution of early-type galaxies, is the color distribution of present-day early-type galaxies correctly predicted? The result of this exercise is shown in the lower-left panel of Fig. 13. The solid histogram shows the color offsets from the red sequence of the data, and the dashed histogram the major merger model. The two distributions are clearly very similar: a KS test yields a chance of the two distributions being drawn from the same distribution, which is a remarkable achievement for what is essentially a blind prediction, using only the observed red sequence number density growth and an assumed metallicity scatter.
In the center and lower right-hand panels, we show light-weighted ages of the systems (comparable to the ages derived by Gallazzi et al., 2005) as a function of truncation time (central panel), and the histogram of light-weighted ages (lower panel). It is clear that the luminosity-weighted ages are skewed considerably towards older ages than the truncation times, as is expected from any model galaxies that have a constant star formation rate before the truncation of star formation. The distribution of ages is reasonably encouraging, and has the asymmetry characteristic of the data. The average age of the model is offset from the data; inasmuch as luminosity-weighted ages are considerably more model-dependent than color this offset could be relatively easily remedied (but is not here, for the sake of simplicity). For example, one could bring the start of star formation to Gyr in the past and adopt a different parameterization of the early stages of truncation of star formation in early-type galaxy progenitors.
5.1.3 Minor merger model

Of course, minor mergers are much more frequent than major mergers, and are increasingly thought to be an important feature of the evolution of the early-type galaxy population (see, e.g., Naab, Johansson & Ostriker, 2009, Bezanson et al., 2009, Hopkins et al., 2010b). The primary relevant effect here is that the minor merger of a gas-rich satellite onto a pre-existing early-type galaxy may drive the galaxy’s color bluewards for a short time and induce asymmetry. In Fig. 15, we show a model that is identical to the major merger model above, but with the early-type galaxy population undergoing the accretion of a star-forming galaxy in the last 8 Gyr. The probability of accretion is modelled as being constant over the last 8 Gyr, with a total probability of 1 that a given galaxy accretes a star-forming satellite over that period. The mass ratio is randomly chosen from a uniform distribution over the interval [0.0,0.4]; the metallicity of the satellite is assumed to be identical to the primary galaxy for modeling convenience.
Fig. 15 shows many of the same phenomenologies as were seen in the major merger case (Fig. 13). The evolution of number of red sequence galaxies is similar, as is the color distribution produced at Gyr. The distribution of light-weighted ages is improved somewhat by the contribution of a small number of (bright) younger stars. Furthermore, the relationship between and the ‘last’ truncation time (the time of the last event to take place, be it a major or minor merger) is skewed considerably towards younger ages; it is already possible to be very close to the red sequence locus only Gyr after a minor merger.
5.1.4 Bringing it together: our interpretation of the asymmetry-color relation
Thus, the two key conclusions of the modeling effort are: i) the full color distribution of early-type galaxies at the present day is consistent with being built-up through truncation of star formation (as part of a merger event) at the rate inferred through observations of the build-up of the red sequence, and ii) minor mergers can lead to considerable short-lived color offsets (and presumably asymmetries), complicating considerably their interpretation.
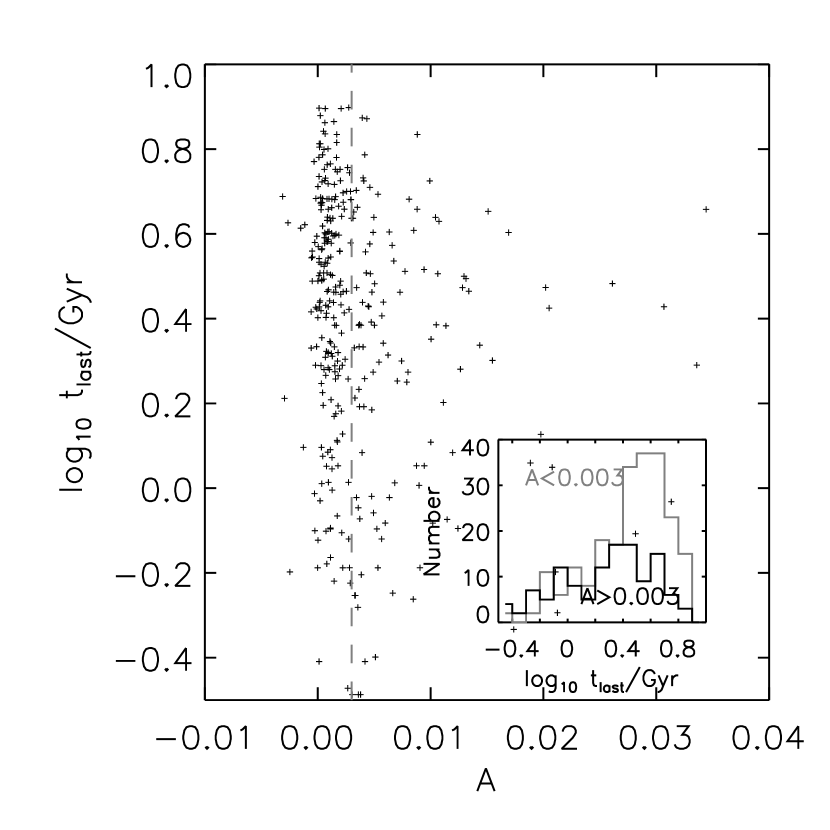
Despite the substantial scatter one expects in a majorminor merger model, the correlations shown in the central panels of Fig. 15 are still substantially stronger than the observed correlations between color/age and asymmetry (although the correlations of Tal et al., 2009 are almost as strong as those in the central panels of Fig. 15; it is possible that for elliptical galaxies residuals measured using deep data are well-correlated with time since last interaction). We quantitatively illustrate this issue in Fig. 16. We show the quantity , the lookback time at which the last major or minor merger occurred in the majorminor merger model, statistically inferred from luminosity-weighted age (Gallazzi et al., 2005). For each galaxy, a model galaxy with very similar luminosity-weighted age is found, and its is assigned to the galaxy of interest141414By doing this, we end up with more scatter than is necessary in the final –asymmetry relation. We choose a model galaxy with a given luminosity-weighted age at random, whereas nature is likely to ensure that highly structured galaxies tend to have a lower than average . . Such an inferred is purely statistical, by design reproducing the trend and scatter in the middle right panel of Fig. 15; such a statistical estimate is for illustrative purposes only and does not represent an estimate of that would be accurate in a galaxy-by-galaxy sense. We show the inferred in this way as a function of asymmetry; the inset panels show the distribution inferred for symmetric () and structured () galaxies. It is clear that asymmetry and correlate only very weakly; while structured galaxies have a weak tendency towards lower , there are a number of structured galaxies with high (i.e., rather red stellar populations). Put differently, this figure attempts to encapsulate quantitatively the fact that neither the stellar population parameters nor the asymmetry are perfect clocks: the scatter in star formation history, gas content, mass ratio and details of the merger orbits appear to add very significant scatter to the relationship between the stellar population and structural ‘clocks’.
| RA | Dec | log (age [Gyr]) | log (Z/Z⊙) | A | |
|---|---|---|---|---|---|
| 224.1003 | 49.6960 | -0.14 | 0.002 | ||
| 166.3744 | 3.6600 | -0.14 | 9.56 | -0.28 | 0.003 |
| 142.5555 | 49.4882 | -0.14 | 0.005 | ||
| 227.0540 | 56.4228 | -0.14 | 9.32 | -0.03 | 0.012 |
| 169.7402 | 58.0566 | -0.15 | 0.003 | ||
| 17.9440 | -0.6645 | -0.15 | 0.002 | ||
| 226.6311 | 40.6962 | -0.16 | 0.013 | ||
| 202.2038 | 53.4430 | -0.18 | 0.009 | ||
| 135.1501 | 46.6863 | -0.19 | 0.007 | ||
| 167.6620 | 3.7555 | -0.19 | 9.51 | -0.46 | 0.005 |
| 32.8899 | 13.9171 | -0.19 | 8.84 | -0.04 | 0.016 |
| 11.2468 | -8.8897 | -0.20 | 9.49 | 0.03 | 0.024 |
| 50.8886 | -0.4385 | -0.20 | 0.002 | ||
| 135.7590 | 40.4340 | -0.21 | 0.012 | ||
| 153.9239 | 7.0522 | -0.21 | 0.013 | ||
| 199.9037 | 3.0327 | -0.22 | 8.87 | -0.20 | 0.037 |
| 129.9133 | 3.8285 | -0.24 | 0.022 | ||
| 210.1692 | -1.9217 | -0.29 | 0.004 | ||
| 120.8668 | 25.1026 | -0.31 | 0.039 | ||
| 205.3000 | 1.7798 | -0.42 | 9.39 | -1.08 | 0.013 |
In this kind of picture, while one expects a broad correlation between color offset from the red sequence and asymmetry (as is observed), there will be a lot of scatter in this relationship for astrophysical reasons. Some relatively recent minor accretions, or interactions between already non-star-forming progenitors (dry mergers; van Dokkum, 2005; Bell et al., 2006; McIntosh et al., 2008), might be richly structured but already red; whereas some more ancient major interactions may remain blue for much longer, showing little asymmetry but blue colors. In such a picture, finding galaxies to fill the ‘King gap’ is not a particularly well-posed exercise. It is of course possible to define samples that will likely contain some fraction of the most recently-formed early-type galaxies. Such a candidate sample is presented in Fig. 17 and Table 2, where we present the 20 bluest objects in our sample, with . Inspection of Fig. 17 shows that many of them clearly show asymmetries generated by tidal effects; yet, some of this sample are not obviously asymmetric, illustrating the challenges of uniquely identifying a sample of ‘young’ early-type galaxies.
Yet, we would argue that there should be little concern about this difficulty to uniquely identify intermediate-age merger remnants. Much more important in our view is the finding that in this model, in which early-type galaxies are being produced at the right rate by major interactions (with or without the additional accretion of satellites), the correct distribution of early-type galaxy colors is straightforwardly reproduced. This indicates that as an ensemble, the (stellar population) properties of the early-type galaxy population are in accord with a model in which they are being built up by merging at the observed rate. Our result confirms a broad link between asymmetric (largely tidally-induced) structure and stellar population parameters, confirming a qualitative prediction of the merger hypothesis. Detailed -body and hydrodynamical modeling will be necessary to test this link quantitatively, by providing directly the predicted distribution of galaxies in the color/age vs. asymmetry plane as predicted by assembly histories derived from simulations of galaxy formation in a cosmological context.
5.2. Musings on the role of dissipationless (dry) merging
In recent years, it has been demonstrated that largely dissipationless merging between already-formed early-type galaxies (dry mergers) play a significant role in the build-up of the early-type galaxy population (Bell et al., 2004a; van Dokkum, 2005; Bell et al., 2006; Lotz et al., 2008; Faber et al., 2007; Skelton et al., 2009). In particular, the most massive early-type galaxies appear to grow only by dry merging (Bell et al., 2004a; Faber et al., 2007; McIntosh et al., 2008), although what that growth rate is remains somewhat unclear (van Dokkum, 2005; Bell et al., 2006; Masjedi et al., 2006; Scarlata et al., 2007; McIntosh et al., 2008).
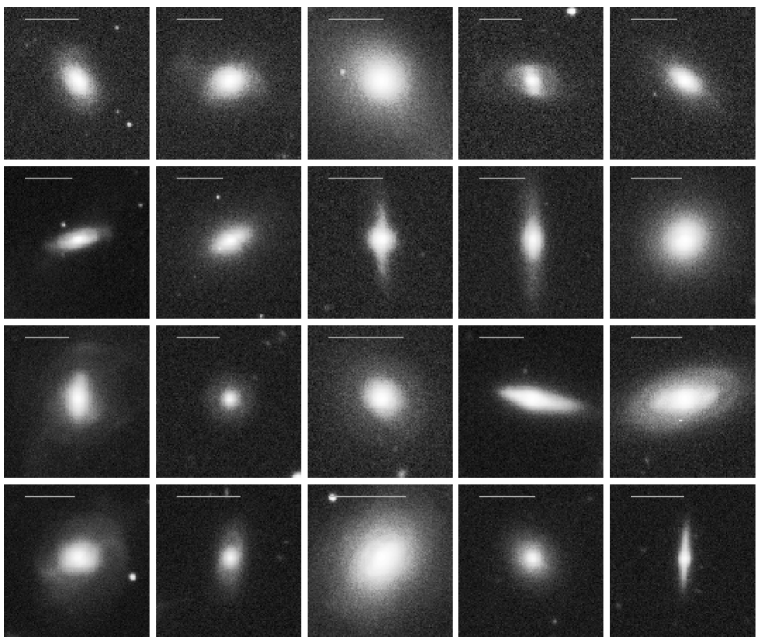
In this context, it is of interest to note the population of relatively red () and richly structured E and S0 galaxies in Figs. 6 and 11. We show a set of 20 randomly selected red highly asymmetric galaxies with and in Fig. 18. These systems are clearly undergoing (or have undergone) interactions, both minor and major, with already early-type galaxies. The relative prominence of this tail of red asymmetric E/S0 galaxies appears to be relatively independent of luminosity151515This was checked by splitting the sample in half by luminosity. There was no significant difference between the red asymmetric early-type galaxy fractions of the bright and faint bins. (somewhat in contrast to the naive expectation that dry interactions/mergers are more important for more luminous systems), indicating that such interactions are possible for systems of a wide range of luminosities from right up to the most luminous systems probed in our study .
It is of interest that many of the most structured early-type galaxies have this signature. Without a wide range of -body/hydrodynamical simulations to guide us, it is difficult to properly interpret this behavior. Two aspects will clearly play a role in setting the relative prominence of blue vs. red richly-structured early-type galaxies: the ratio of blue vs. red merger partners typical of the mergers that create early-type galaxies, and the issue of when one classifies a merger remnant as an early-type galaxy (almost always for two interacting early-type galaxies, as opposed to only at very late times for the remnant of a merger between two gas-rich galaxies).
It is also of historical interest to ask why there were relatively few such systems in the work of Schweizer & Seitzer (1992). Number statistics clearly will play a role, but also important is the differing nature of our measures of tidal structure in early-type galaxies. Schweizer & Seitzer (1992) attempted to measure fine structure characteristic of mergers between gas-rich systems, whereas we explore asymmetry, which is also sensitive to large-scale asymmetries and debris fields, more characteristic of mergers between early-type galaxies. This aspect, along with details of initial sample selection, is likely to play a role in this small difference between our two studies.
5.3. Comparison with Tal et al. (2009)
Tal et al. (2009) choose a complementary method to explore this issue, by quantifying the residuals from a smooth model fit for a sample of elliptical galaxies and correlating them with color offset from the CMR (residuals from a smooth fit for S0s would reveal the disk/bulge transition and bars, and would be significantly less meaningful). They used very deep data for 55 systems and traced tidal structure out to large radius, where dynamical times are long. They found that a large fraction of systems were disturbed, and found a clear but scattered correlation between color offset from the CMR and residuals, as seen by Schweizer & Seitzer (1992). Their results can be regarded as a high sensitivity analysis of the main body of the correlation shown in Fig. 6, where their higher sensitivity to faint debris has brought the color-residual correlation into sharp focus. Our result complements this analysis by i) using a larger sample and including S0 galaxies, showing it to be generally applicable to the population as a whole (albeit with a lower sensitivity measure of structure, largely because of limitations in SDSS depth), and ii) using age measures to explicitly illustrate that the main driver of such behavior is an age–structure relation.
5.4. Limitations of this approach, and outlook
As alluded to in the previous sections, a significant (and largely unavoidable) limitation of our study is the choice of asymmetry as a metric of tidally-induced disturbances. Our choice of asymmetry was motivated by the overriding consideration that the measurement be algorithmic and reproducible; asymmetry was chosen over other reproducible descriptions of structure (such as residuals from a smooth model fit; e.g., McIntosh et al., 2004 and Tal et al., 2009) to avoid symmetric bars or rings from contributing to our measure of structure. Yet, a key limitation of our metric is that systems can be asymmetric for a variety of reasons: asymmetry may be produced by fly-bys or mergers, major or minor interactions, ongoing or past interactions, gas-rich or gas-poor mergers. As such, asymmetry is a valuable but ultimately blunt tool; in this respect, our work is a useful way to start attacking the problem, but is not capable of answering higher-level, more detailed questions about the origin of the early-type galaxy population.
In principle, one could attempt to construct a richer description of structure, which would be more clearly correlated with particular types of interaction (e.g., a measure of the spatial scale of tidal debris, or a measure of the luminosity in tidal debris). Calibration with simulations would be a critical step in the establishment of such metrics (indeed, we have not yet calibrated our measure of asymmetry as part of this work). Yet, in practice, such metrics have proven difficult to reliably construct; the fine structure parameter of Schweizer & Seitzer (1992) is a good example of such a metric, which may be more physically meaningful but is difficult to reproduce.
6. Conclusions
One of the key predictions of the merger hypothesis for the origin of early-type galaxies is that tidally-induced asymmetric structure should correlate, at least in a broad sense, with signatures of a relatively young stellar population. Motivated by this argument, Schweizer & Seitzer (1992) studied the relationship between color offset from the CMR and tidally-induced fine structure, finding a correlation between the two quantities. They modeled the colors of these structured early-type galaxies, finding that such colors can be reproduced by a variety of models in which star formation truncates reasonably quickly, with typical timescales of a few Gyr to reach the colors characteristic of ancient early-type galaxies (although with much model dependence).
In this paper, we have re-examined this issue, incorporating a number of improvements over the work of Schweizer & Seitzer (1992): a sample from 2MASS/NED and the SDSS that is nearly ten times larger with well-measured colors; the use of a non-ideal, but reproducible and meaningful metric for tidally-induced structure, asymmetry; the use of luminosity-weighted ages and metallicities from the work of Gallazzi et al. (2005) using the SDSS; and, the ability to construct a more physically-motivated model of early-type galaxy evolution with which to interpret the results.
We found, in agreement with Schweizer & Seitzer (1992) and Tal et al. (2009), a correlation between offset from the CMR and asymmetry. Inspection of asymmetric systems gave weight to the notion that the main driver of asymmetries was galaxy interactions (although a variety of interactions can create asymmetries, leading to a natural ambiguity when interpreting the results). We demonstrated, for the first time, that age effects are driving this correlation. A fraction of asymmetric early-type galaxies have normal colors/ages, characteristic of mergers between already-formed early-type galaxies (dry mergers). The empirical correlation between stellar population age and tidally-induced asymmetries, for the bulk of the population, is the key result of this paper, and is consistent with the basic prediction of the origin of early-type galaxies through galaxy merging, and their modification by accretion of gas-rich satellites.
We interpreted these results in the context of a model in which the number of early-type galaxies is increasing constantly with time, in quantitative agreement with measurements of the evolving number density of red sequence (early-type) galaxies. Assuming that the ultimate effect of a galaxy merger is to truncate star formation (through either gas consumption or AGN feedback), we find that such a model reproduces the distribution of color offsets from the CMR; put differently, the merger hypothesis appears to give the correct distribution of present-day early-type galaxy colors. Under the assumption that both light-weighted stellar age and asymmetry are good ‘clocks’ of the time elapsed since the last major or minor merger, such a model predicts a rather tighter correlation between age and asymmetry than is observed. This indicates that astrophysical sources of scatter, e.g., the star formation histories of the progenitors, their gas content, and mass ratios, play an important role in setting the properties of the remnants. Thus, the broad correlation between age and asymmetry is in qualitative (but not yet quantitative) agreement with such a model. The existence of such a large scatter precludes the unambiguous identification of ‘young’ early-type galaxies from stellar population and asymmetry data alone; confirming the merger hypothesis using a few individual examples will be a challenging and ambiguous exercise.
We conclude that the properties of the early-type galaxy population as a whole are consistent with the bulk of them being formed by galaxy merging (some of these mergers are between already-formed early-type galaxies). In the case of stellar population parameters, there is a quantitative match between toy models of merger-driven growth and the observations. In the case of asymmetries, the existence of a broad and scattered correlation between stellar population parameters and asymmetry is in qualitative agreement with the expectations from the merger hypothesis, but our toy models (and even more sophisticated models) are currently incapable of providing expectations for how asymmetry should vary with time and interaction phase. Further work, using simulations to predict and calibrate the distributions of asymmetries, and using more sophisticated descriptors of galaxy structure, will help to more deeply explore this issue in the next years.
References
- Abazajian et al. (2005) Abazajian, K., et al. 2005, AJ, 129, 1755
- Barnes & Hernquist (1992) Barnes, J. E., & Hernquist, L. 1992, ARA&A, 30, 705
- Bell et al. (2003) Bell, E. F. et al., 2003, ApJS, 149, 289
- Bell et al. (2004a) Bell, E. F. et al., 2004a, ApJ, 608, 752
- Bell et al. (2004b) Bell, E. F. et al. 2004b, ApJL, 600, 11
- Bell et al. (2006) Bell, E. F. et al. 2006, ApJ, 640, 241
- Bell et al. (2007) Bell, E. F. et al., 2007, ApJ,663,834
- Bell (2008) Bell, E. F., 2008 ApJ, 682, 355
- Bertin & Arnouts (1996) Bertin, E., & Arnouts, S. 1996, A&AS, 117, 393
- Bezanson et al. (2009) Bezanson, R., van Dokkum, P. G., Tal, T., Marchesini, D., Kriek, M., Franx, M., & Coppi, P. 2009, ApJ, 697, 1290
- Birnboim et al. (2007) Birnboim, Y., Dekel, A., & Neistein, E. 2007, MNRAS, 380, 339
- Blanton et al. (2003) Blanton, M. R., et al. 2003, ApJ, 594, 186
- Borch et al. (2006) Borch, A., Meisenheimer, K., Bell, E. F., Rix, H.-W., Wolf, C., Dye, S., Kleinheinrich, M., Kovacs, Z., & Wisotzki, L. 2006, A&A, 453, 869
- Bower et al. (1992) Bower, R. G., Lucey, J. R., & Ellis, R. S. 1992, MNRAS, 254, 601
- Bower et al. (2006) Bower, R. G., Benson, A. J., Malbon, R., Helly, J. C., Frenk, C. S., Baugh, C. M., Cole, S., & Lacey, C. G. 2006, MNRAS, 370, 645
- Brown et al. (2007) Brown, M. J. I., Dey, A., Jannuzi, B. T., Brand, K., Benson, A. J., Brodwin, M., Croton, D. J., & Eisenhardt, P. R. 2007, ApJ, 654, 858
- Bruzual & Charlot (2003) Bruzual, G., & Charlot, S. 2003, MNRAS, 344, 1000
- Burkert et al. (2008) Burkert, A., Naab, T., Johansson, P. H., & Jesseit, R. 2008, ApJ, 685, 897
- Cattaneo et al. (2006) Cattaneo, A., et al., 2006, MNRAS, 370, 1651
- Chen et al. (2003) Chen, H.-W., et al. 2003, ApJ, 586, 745
- Cole et al. (2000) Cole, S., Lacey, C. G., Baugh, C. M., & Frenk, C. S. 2000, MNRAS, 319, 168
- Conselice, Bershady, & Jangren (2000) Conselice, Christopher J., Bershady, Matthew A., Jangren, Anna, 2000, ApJ, 529, 886
- Croton et al. (2006) Croton, D.J. et al., 2006, MNRAS 365, 11
- Dasyra et al. (2006) Dasyra, K. M., et al. 2006, ApJ, 651, 835
- Dekel & Birnboim (2006) Dekel, A., & Birnboim, Y. 2006, MNRAS, 368, 2
- Dekel & Birnboim (2008) —. 2008, MNRAS, 383, 119
- Di Matteo et al. (2005) Di Matteo, T., Springel, V., & Hernquist, L. 2005, Nature, 433, 604
- Emsellem et al. (2007) Emsellem, E., et al., 2007, MNRAS, 379, 401
- Faber et al. (2007) Faber, S. M., et al., 2007, ApJ, 665, 265
- Fioc & Rocca-Volmerange (1997) Fioc, M. & Rocca-Volmerange, B. 1997, A&A, 20, 306
- Gallazzi et al. (2005) Gallazzi, A., Charlot, S., Brinchmann, J., White, S. D. M., & Tremonti, C. A. 2005, MNRAS, 362, 41
- Gallazzi et al. (2006) Gallazzi, A., Charlot, S., Brinchmann, J., & White, S. D. M. 2006, MNRAS, 370, 1106
- Guo & Oh (2008) Guo, F., & Oh, S. P. 2008, MNRAS, 384, 251
- Häring & Rix (2004) Häring, N., & Rix, H.-W. 2004, ApJL, 604, L89
- Harker et al. (2006) Harker, J. J., Schiavon, R. P., Weiner, B. J. & Faber, S. M. 2006, ApJL, 647, 103
- Häußler (2007) Häußler, B. 2007, PhD Thesis, University of Heidelberg (http://www.ub.uni-heidelberg.de/archiv/7190)
- Hoffman et al. (2009) Hoffman, L., Cox, T. J., Dutta, S. & Hernquist, L. 2009, ApJ, 705, 920
- Hopkins et al. (2008a) Hopkins, P. F. et al., 2008, ApJS, 175, 356
- Hopkins et al. (2008b) Hopkins, P. F. et al., 2008, ApJS, 175, 390
- Hopkins et al. (2008c) Hopkins, P. F. Hernquist, L., Cox, T. J., Dutta, S. N., Rothberg, B., 2008c, ApJ, 679, 156
- Hopkins et al. (2010a) Hopkins, P. F. et al., 2010a, ApJ, 715, 202
- Hopkins et al. (2010b) Hopkins, P. F., Bundy, K., Hernquist, L., Wuyts, S., & Cox, T. J., 2010b, MNRAS, 401, 1099
- Jesseit et al. (2007) Jesseit, R., Naab, T., Peletier, R. F., & Burkert, A. 2007, MNRAS, 376, 997
- Johansson, Naab & Burkert (2009) Johansson, P. H., Naab, T., & Burkert, A. 2009, ApJ, 690, 802
- Johansson, Naab & Ostriker (2009) Johansson, P. H., Naab, T., & Ostriker, J. P. 2009, ApJL, 697, 38
- Kauffmann & Haehnelt (2000) Kauffmann, G., & Haehnelt, M. 2000, MNRAS, 311, 576
- Kauffmann, White & Guideroni (1993) Kauffmann, G., White, S. D. M., & Guideroni, B. 1993, MNRAS, 264, 201
- Kauffmann et al. (2003) Kauffmann, G., et al., 2003, MNRAS, 341,54
- Kauffmann et al. (2006) Kauffmann, G., Heckman, T. M., De Lucia, G., Brinchmann, J., Charlot, S., Tremonti, C., White, S. D. M., & Brinkmann, J. 2006, MNRAS, 367, 1394
- Keres et al. (2009) Kereš, D., Katz, N., Davé, R., Fardal, M., & Weinberg, D. H. 2009, MNRAS, 396, 2332
- Khochfar & Ostriker (2008) Khochfar, S., & Ostriker, J. P. 2008, ApJ, 680, 54
- Lotz et al. (2008) Lotz, J. M., et al. 2008, ApJ, 672, 177
- Magorrian et al. (1998) Magorrian, J., et al. 1998, AJ, 115, 2285
- Malin & Carter (1983) Malin, D. F., & Carter, D. 1983, ApJ, 274, 534
- Masjedi et al. (2006) Masjedi, M., et al. 2006, ApJ, 644, 54
- McIntosh et al. (2004) McIntosh, D. H., Rix, H.-W., & Caldwell, N. 2004, ApJ, 610, 161
- McIntosh et al. (2006) McIntosh, D. H., Bell, E. F., Weinberg, M. D., & Katz, N. 2006, MNRAS 373, 1321
- McIntosh et al. (2008) McIntosh, D. H., Guo, Y., Hertzberg, J., Katz, N., Mo, H. J., van den Bosch, F. C., & Yang, X. 2008, MNRAS, 388, 1537
- Naab & Burkert (2003) Naab, T., & Burkert, A. 2003, ApJ, 597, 893
- Naab, Khochfar, & Burkert (2006) Naab, T., Jesseit, R., & Burkert, A. 2006, MNRAS, 372, 839
- Naab, Khochfar, & Burkert (2006) Naab, T., Khochfar, S., & Burkert, A. 2006, ApJL, 636, 81
- Naab & Trujillo (2006) Naab, T. & Trujillo, I. 2006, MNRAS, 369, 625
- Naab et al. (2007) Naab, T., Johansson, P. H., Ostriker, J. P., & Efstathiou, G. 2007, ApJ, 658, 710
- Naab & Ostriker (2009) Naab, T. & Ostriker, J. P. 2009, ApJ, 690, 1452
- Naab, Johansson & Ostriker (2009) Naab, T., Johansson, P. H. & Ostriker, J. P. 2009, ApJL, 699, 178
- Peng et al. (2002) Peng, C. Y. et al., 2002, AJ, 124, 266
- Prochaska & Hennawi (2009) Prochaska, J. X., Hennawi, J. F. 2009, ApJ, 690, 1558
- Robaina et al. (2009) Robaina, A. R., et al., 2009, ApJ, 704, 324
- Robaina et al. (2010) Robaina, A. R., Bell, E. F., van der Wel, A., Somerville, R. S., Skelton, R. E., McIntosh, D. H., Meisenheimer, K., & Wolf, C. 2010, ApJ, 719, 844
- Rotheberg & Joseph (2006) Rothberg, B. & Joseph, R. D. 2006, AJ, 131, 185
- Ruhland et al. (2009) Ruhland, C., Bell, E. F., Häußler, B., Taylor, E. N., Barden, M., McIntosh, D. H., 2009, ApJ, 695, 1058
- Sandage & Visvanathan (1978) Sandage, A., & Visvanathan, N. 1978, ApJ, 225, 742
- Sanders & Mirabel (1996) Sanders, D. B., & Mirabel, I. F. 1996, ARA&A, 34, 749
- Scarlata et al. (2007) Scarlata, C., et al. 2007, ApJS, 172, 494
- Schawinski et al. (2007) Schawinski, K., Thomas, D., Sarzi, M., Maraston, C., Kaviraj, S., Joo, S.-J., Yi, S. K., & Silk, J. 2007, MNRAS, 382, 1415
- Schawinski et al. (2010) Schawinski, K., Dowlin, N., Thomas, D., Urry, C. M., Edmondson, E. 2010, ApJL, 714, 108
- Schiminovich et al. (2007) Schiminovich, D., et al. 2007, ApJS, 173, 315
- Schweizer & Seitzer (1988) Schweizer, F., & Seitzer, P. 1988, ApJ, 328, 88
- Schweizer & Seitzer (1992) Schweizer, F., & Seitzer, P. 1992, AJ, 104, 1039
- Schweizer et al. (1990) Schweizer, F., & Seitzer, P., Faber, S. M., Burstein, D., Dalle Ore, C. M., & Gonzalez, J. J. 1990, ApJL, 364, 33
- Sérsic (1968) Sérsic, J. L., 1968, Atlas de galaxias australes (Cordoba, Argentina: Observatorio Astronomico)
- Skelton et al. (2009) Skelton, R. E., Bell, E. F., & Somerville, R. S., 2009, ApJL, 699, 9
- Skrutskie et al. (2006) Skrutskie, M. F., et al. 2006, AJ, 131, 1163
- Springel, Di Matteo & Hernquist (2005) Springel, V., Di Matteo, T., & Hernquist, L. 2005, MNRAS, 361, 776
- Somerville et al. (2008) Somerville, R. S., Hopkins, P. F., Cox, T. J., Robertson, B. E., & Hernquist, L. 2008, MNRAS, 391, 481
- Strateva et al. (2001) Strateva, I. et al. 2001, AJ, 122, 1861
- Tal et al. (2009) Tal, T., van Dokkum, P. G., Nelan, J., & Bezanson, R. 2009, AJ, 138, 1417
- Toomre & Toomre (1972) Toomre, A., & Toomre, J., 1972, ApJ, 178, 623
- Trager et al. (2000) Trager, S. C., Faber, S. M., Worthey, G., González, J. J. 2000, AJ, 120, 165
- Tremonti et al. (2007) Tremonti, C. A., Moustakas, J., & Diamond-Stanic, A. M. 2007, ApJL, 663, L77
- van Dokkum (2005) van Dokkum, P. G. 2005, AJ, 130, 2674
- van Dokkum et al. (2010) van Dokkum, P. G., et al. 2010, ApJ, 709, 1018