Vibrational density of states of silicon nanoparticles
Abstract
The vibrational density of states of silicon nanoparticles in the range from 2.3 to 10.3 nm is studied with the help of molecular-dynamics simulations. From these simulations the vibrational density of states and frequencies of bulk-like vibrational modes at high-symmetry points of the Brillouin-zone have been derived. The results show an increase of the density of states at low frequencies and a transfer of modes from the high-frequency end of the spectrum to the intermediate range. At the same time the peak of transverse optical modes is shifted to higher frequencies. These observations are in line with previous simulation studies of metallic nanoparticles and they provide an explanation for a previously observed discrepancy between experimental and theoretical data [C. Meier et al., Physica E, 32, 155 (2006)].
pacs:
63.22.Kn,62.25.Jk,81.05.Cy,02.70.NsI Introduction
Modern nanotechnology is leading to the development of a new generation of applications and devices based on nanostructured materials. An important part of the development of many nano-devices is the thermal design. If the heat generated inside a device cannot be transported away efficiently, the system will fail or even break due to overheating. Thermal properties like heat capacity and thermal conductivity as well as many other material properties are strongly influenced by the vibrational density of states (VDOS). For this reason a profound understanding of the laws governing the vibrational properties of nanostructured materials is of high technological and fundamental interest.
This article focuses on the vibrational properties of silicon nanoparticles. Silicon is an important engineering material whose bulk properties have been studied extensively. Its favourable electrical properties have made it the base material for all microelectronics and advanced technology exists for the manufacturing of nanostructured silicon based devices.
The vibrational properties of bulk crystalline Si have been studied both experimentally using neutron scattering techniquesDolling:63a ; Nilsson:72a as well as theoretically using empirical and first-principles methods.Pandey:73a ; Giannozzi:91a ; Wei:94a In addition to this, Raman scattering experiments have been used in numerous studies of the vibrational properties of silicon nanostructures.Richter:81a ; Furukawa:88a ; Sui:92a ; Munder:92a ; Fujii:96a ; Tanino:96a ; Wang:99a ; Saviot:04a ; Adu:05a ; Meier:06a ; Ristic:09a In many of these studies it is found that the first order peak due to the transverse optical (TO) phonon at the point is broadened and its maximum shifted to lower energies. The phonon-confinement modelRichter:81a ; Campbell:86a attributes this behaviour to the fact that in nanostructures more vibrational modes can become Raman active than in bulk crystals since the translational symmetry is broken and consequently no selection rule applies. In Ref. Meier:06a, , Meier et al. observed pronounced decreases of the Raman shift in Silicon nanoparticles. A comparison with calculated values based on the phonon-confinement model showed the experimentally observed decrease of the Raman shift to be considerably stronger than predicted by the model calculations.Meier:06a
Theoretically, the vibrational properties of nanostructured silicon have also been studied. Heino has calculated phonon dispersion relations for silicon thin films using molecular-dynamics simulationsHeino:07a whereas Saviot et al. have studied low frequency vibrational modes in silicon nanoparticles using an elastic continuum model.Saviot:04a Hu et al. and Valentin et al. employed empirical atomistic force models to calculate the VDOS of silicon nanoparticles by diagonalization of the dynamical-matrix.Hu:01a ; Valentin:07a The latter two studies did not include relaxation effects from the particle surfaces.
In this work, we use molecular-dynamics simulations in combination with the modified embedded-Atom method (MEAM)Baskes:89a ; Baskes:92a potential for silicon from Ref. [Baskes:94a, ] to calculate the vibrational density of states and selected zone-boundary phonon frequencies for silicon nanoparticles with diameters in the range 2.3 – 10.3 nm. These simulations include surface effects and the results show changes from the bulk density of states that are similar to those observed in metallic nanoparticles.Kara:98a ; Meyer:02a ; Meyer:03a ; Meyer:07a While the limitations of the potential do not allow us to make quantitative predictions, our calculations show clear trends in the developement of the particle VDOS as the particle size is reduced. In particular, we observe an increase of the VDOS at low frequencies, a shift of the high frequency modes to higher frequencies and a transfer of weight from the TO mode peak to intermediate frequencies. Our results provide an explanation for the discrepancy observed in Ref. Meier:06a, .
II Computational Details
The calculations of vibrational properties of Si nanoparticles presented in this work are all based on molecular-dynamics simulations using the MEAM potential for Si from Ref. Baskes:94a, . The advantage of the MEAM formalismBaskes:89a ; Baskes:92a is that it is not only suitable for simulations of pure Si in the diamond structure but that it has also been used successfully in studies of composite systems combining Si with other elements like, Ni,Baskes:94a Mb,Baskes:99a or Au.Kuo:04a A disadvantage of the potential is that it severely overestimates the phonon frequencies in silicon.Heino:07a Qualitatively the potential gives however a fair description of silicon and reflects the characteristic features of its phonon dispersion relations. Since in this work we are more interested in the qualitative changes of the VDOS than quantitatively exact frequencies and since we hope to exploit the potential’s transferability in future work focusing on composite systems, we decided to use this potential despite its shortcomings.
| 2.3 | 2.8 | 4.1 | 6.1 | 8.2 | 10.3 | |
|---|---|---|---|---|---|---|
| 329 | 657 | 1803 | 5815 | 14175 | 27943 |
In order to study the influence of particle size on the vibrational properties in Si nanoparticles, we constructed a set of model particles by cutting a spherical region out of an ideal diamond lattice. The diameters of the particles and the number of atoms they contain are summarized in Table 1. In addition to the nanoparticle configurations we used a bulk-like configuration containing 1,000,000 Si atoms arranged on an ideal cells diamond lattice.
Prior to the calculation of vibrational frequencies, we carefully equilibrated our model systems at . In order to determine the equilibrium lattice constant of the bulk configuration at this temperature, the Parinello-Rahman technique was employed to perform simulations at constant pressure (). After the determination of the lattice constant, the configuration was re-equilibrated with a fixed volume. All simulations were carried out using the velocity Verlet algorithm with a time step . In simulations of the bulk configuration, periodic boundary conditions were applied.
For the calculations of vibrational properties from our simulations we relied on the velocity-autocorrelation function. The total VDOS of a system of atoms is proportional to the Fourier-transform of the velocity-autocorrelation function averaged over all atoms. The normalized VDOS of an atom system is thus given by
| (1) |
where denotes the velocity of the -th atom. Information about individual vibrational frequencies can be obtained by this method if the velocities of the atoms are projected onto a plane wave.
For a mode with wave-vector and a normalized polarization vector we calculated the function
| (2) |
where
| (3) |
is the projection of the velocities on the plane wave and denotes the average position of the -th atom. For a crystalline system with translational symmetry the function should have sharp peaks at the positions of the phonons with wave-vector that have a component along the polarization vector .
The vibrational modes of systems without translational symmetry are not plane waves. For systems similar to perfect crystals (for example a finite piece cut out of an infinite crystal) one finds however that the vibrational modes are well described by phonon-like wave-packets. Such wave-packets appear in as more or less broadened peaks whose maxima can still be used to determine the dominant frequency of the mode. The quality of the peaks in — if there are clear, isolated peaks — can therefore be used to judge to what extent the phonon picture applies to the system in question.
III Results
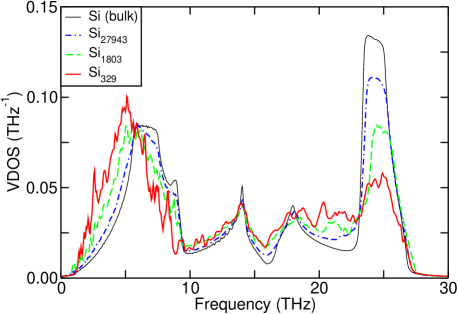
In Fig. 1 we compare the VDOS that we obtained for three selected nanoparticles with the result of crystalline bulk Si. Since for the smaller particles the discrete nature of the spectrum becomes notable, we have broadened the VDOS data with a finite line-width corresponding to an energy of 0.5 meV (0.12 THz). As observed previously in Ref. Heino:07a, , the MEAM potential from Ref. Baskes:94a, leads quantitatively to strongly exaggerated phonon frequencies. Qualitatively however, the results show a clear evolution of the VDOS as the particle size is diminished with the strongest changes occurring at the upper and lower end of the frequency spectrum.
It can be seen from Fig. 1 that with decreasing particle size the large peak of transverse acoustic (TA) modes in the rage 0 – 10 Thz is shifted to lower frequencies. The resulting increase of the VDOS is further amplified by the fact that the curves become more linear for the smaller particles. These two changes lead together to a significant increase of the low-frequency VDOS. There is however no notable loss of the height of the TA mode peak.
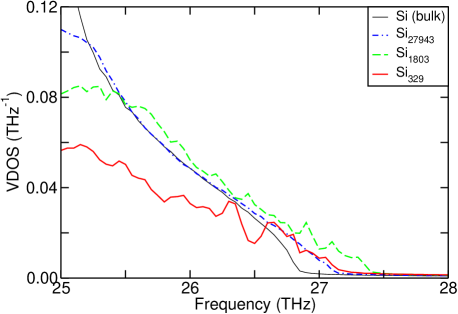
In the high-frequency range the VDOS of the Si nanoparticles show a different behavior. As shown by Fig. 1, the strong peak of the TO modes around 25 THz loses its height rapidly with increasing particle size without a significant increase in peak width. In addition to this, the TO peak is slightly shifted to higher frequencies. This can also be seen in Fig. 2 where we show the high frequency flank of the TO peak without line broadening. This figure makes it clear that for the nanoparticle systems this flank of the peak and the cutoff frequency are located at higher frequencies than in the bulk system. Due to the lower peak height the VDOS curves of the particles eventually cross the bulk line at frequencies between 25 and 26.5 THz but it is clear from Fig. 1 that this is not due to a peak broadening but a shift to higher frequencies. The shift of the TO peak will be discussed in more detail below by looking at the frequencies of individual vibrational modes.
Interestingly we observe a non-monotonous behavior of the cut-off frequencies as shown by the fact that the cut-off frequencies of the and particles are both lower than that of . We interpret this as an indication that our smallest particles are below the limit of the scaling regime in which the physical properties scale monotonously with the particle size in a simple manner. This view is confirmed by other results discussed below.
At intermediate frequencies, the VDOS data presented in Fig. 1 show only little differences between the nanoparticles and the bulk system. In particular, the shape and the position of the longitudinal acoustic (LA) modes peak at approximately 14 THz remains remarkably constant for all of our model systems. On the other hand, the position of the longitudinal optical (LO) mode peak at 18 THz is slightly shifted to higher frequencies. In the regions to the left and to the right of the LO peak the VDOS increases with decreasing particle sizes. This increase accounts obviously for the loss of weight in the TO peak.
Capillary pressure is a pressure in a material that is caused by curved surfaces or interfaces. The magnitude of this pressure depends upon the curvature of the surface and the materials surface or interface stress (which is independent from the curvature). While this phenomenon is well known and easy to understand in the case of fluids, the situation is slightly more complex in the case of crystalline solid materials. A detailed overview of the effects of curved surfaces in solid systems has been given by Wolf and Nozière.Wolf:88a
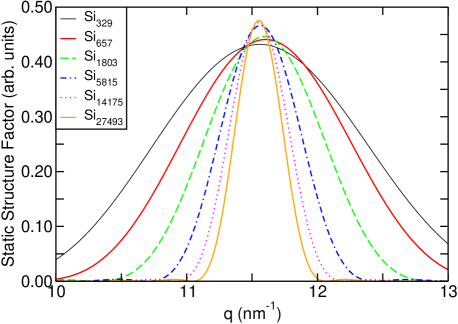
In nanoparticles capillary pressure can have a notable effect on the lattice constant insdie the particle since the small size of the particles leads to extremely high surface curvatures. Such effects have previously been observed theoretically an experimentally in metallic nanoparticles (see for example Ref. Meyer:03a, and references therein). In order to account for the effect of capillary pressure as well as surface relaxation effects on the lattice constant in our calculations of individual vibrational modes at high-symmetry points of the Brillouin zone, we have calculated the static structure factor of the model particles and obtained the lattice constant from the position of the peak.
Figure 3 shows the static structure factor along the direction for all of our model particles. Except for the smallest particle, the maximum of the peak shifts to larger values of with decreasing particle size. This is the expected behavior since the smaller particles should have a larger capillary pressure (assuming a positive surface stress for Si) and consequently a smaller lattice constant. The fact that the position of the maximum of the particle moves against the trend is another indication that this particle is outside the scaling regime for Si particles. It should be understood here that the lattice constants derived from are only meant to be used as approximate, average values since the crystal lattice in the nanoparticles is not homogenous. Capillary pressure compresses the lattice inside the particles whereas the surface stress has the inverse effect in the vicinity of the surface.
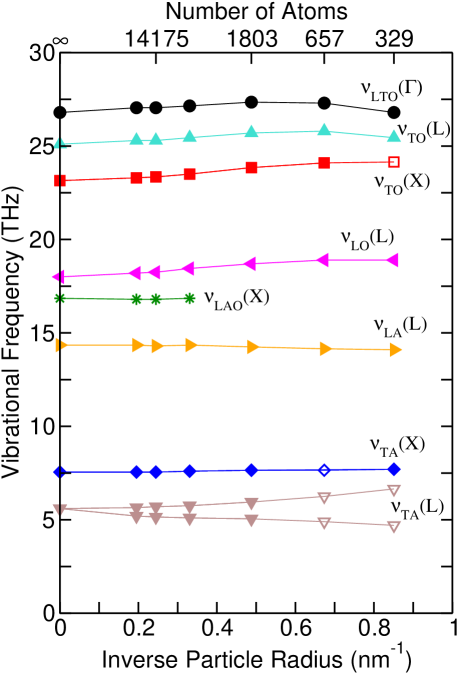
With the average lattice constants derived from the static structure factor calculations, we calculated the frequencies of the vibrational modes corresponding to the , X, and L point of the Brillouin-zone of the diamond lattice for all of our model nanoparticles using the method outlined in Sec. II. The frequencies obtained from the maxima of the peaks in the projected density of states are presented in Fig. 4. Note that at the point the LO and TO modes and at the X point the LA and LO modes are degenerate. For this reason the frequencies of these modes are denoted by and (X), respectively.
For the larger particles and the bulk system the analysis procedure gave straightforward, unambiguous results indicating that the vibrational modes are sufficiently similar to plane waves. In case of the smaller particles and , however, the projected density of states sometimes showed a group of similar peaks instead of a single peak. If in such a case it was still possible to identify one peak that was clearly most consistent with the rest of the data we marked the corresponding data point with an open symbol in Fig. 4. In the case of the (X) mode, however, it turned out to be impossible to identify matching peaks for all particles smaller than so that these points were dropped from the figure.
A special case is the (L) mode. For this mode, the projected density of states of all nanoparticles showed two clearly distinguishable peaks. This indicates that the degeneracy of this mode is lifted in the finite particles. For this reason we included two distinct data sets for this mode in Fig. 4.
The behavior of the individual frequencies is generally consistent with the changes in the total density of states shown in Fig. 1. In the bulk system, the TA modes at the L and X point define the upper and lower boundary of the flat plateau on top of the TA peak. The broadening and shift of this peak in the total VDOS compares well with the fact that (X) remains nearly constant, whereas the lower branch of the L-point TA mode shifts to lower frequencies for smaller particles.
In the intermediate frequency regime, the sharp maxima of the LA and LO mode peaks correspond to (L) ad (L) in the bulk case. Again, the very small shift of (L) and the slightly stronger upward shift of (L) compare well with the changes in the total VDOS. This indicates that these modes are well described by the bulk-phonon picture.
At high frequencies, (X) and (L) correspond to the lower and upper bound of the TO peak in the bulk case, whereas defines the cut-off frequency. The general increase of these frequencies with decreasing particle size (except for ) reflects the shift of the TO peak and the cut-off point in the same direction as shown in Fig. 1 and 2. Moreover, the data in Fig. 4 support a slight sharpening of the TO peak; however the diminishing height of this peak in the VDOS makes it hard to verify this in Fig. 1. The slight decrease of the TO mode frequencies in the case of the smallest particle gives further evidence of the growing deviations from the bulk behavior in particles with diameters below 3 nm.
Although the general trends of Fig. 4 agree well with the behavior of the VDOS, one has to be careful not to stretch these comparisons too far. As pointed out in the last paragraph, represents the cutoff frequency in the bulk case. In case of , however, the calculated value of is the same as in the bulk case, although Fig. 2 clearly shows that modes with higher frequencies are present in this cluster. This discrepancy is another hint that this particle is close to the limit of the regime where the phonon picture can be applied successfully.
With decreasing size of a nanoparticles, the fraction of atoms that is located at or near its surface increases at the expense of the fraction of atoms in the interior of the particle. This means that the contribution of surface modes to the total VDOS becomes increasingly important for the smaller particles.
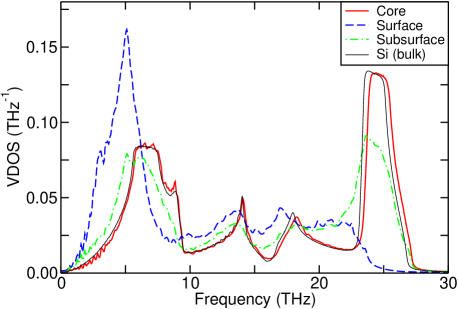
In order to get insight into the influence of surface modes on the total VDOS, we have classified the atoms of one of our particles () into three different groups: core atoms with a distance to the center nm, surface atoms with a coordination number and subsurface atoms with a perfect coordination but . The subsurface layer is necessary since atoms that are close to the surface generally do not behave in the same way as atoms deep in the particle. The core, surface, and subsurface groups contain 2809, 835, and 2171 atoms, respectively. For each of the three groups we then calculated its contribution to the total VDOS of the particles. The resulting partial or local VDOS of the three regions in the particle are shown in Fig. 5 together with the VDOS of bulk Si.
The partial VDOS shown in Fig. 5 reveal substantial differences between the three groups of atoms. The VDOS of the core atoms is very similar to the bulk curve. Below 15 Thz, in the range of the TA and LA modes, the two curves are nearly identical whereas the TA and TO peaks of the core atoms are slightly shifted to higher frequencies. This behavior of the core atoms agrees well with the trends of the bulk-like modes shown in Fig. 4.
The VDOS of the surface atoms in Fig. 5 is markedly different from the bulk VDOS. At low frequencies a strong peak can be seen at frequencies below the TA peak of the bulk and core atoms. At intermediate frequencies the peak of the surface atoms LO modes appears to be shifted to lower frequencies and a broad band of modes is present around 20 Thz. At high frequencies, in the range of the TO modes of the bulk and core atoms, however, the surface VDOS is very low.
A comparison of the trends observed in Fig. 1 with the surface VDOS in Fig. 5 shows that in those areas where the surface VDOS in is notably larger than the bulk VDOS, the total VDOS increases for the smaller particles. We therefore attribute the shift of the TA peak to lower frequencies, the increases of the VDOS at intermediate frequencies as well as the marked decrease of the TO peak to the growing influence of surface modes on the total VDOS. Not surprisingly, the subsurface atoms show a behavior somewhere between the two other groups.
IV Summary and Conclusions
We have studied the vibrational properties of silicon nanoparticles with diameters in the range 2.3-10.3 nm using molecular-dynamics simulations. Our results show clear changes of the VDOS as the particles become smaller. The strongest changes are visible in the low- and high-frequency part of the spectrum. At low frequencies, the VDOS increases as the particles become smaller and the TA mode peak is shifted to lower energies whereas at the upper end of the spectrum, the height of the TO mode peak is significantly reduced although the peak is shifted slightly () to higher frequencies. Finally, an increase of the total VDOS is observed at intermediate frequencies between the peaks of the LA and TO bands.
Our calculations of the frequencies of individual vibrational modes and partial VDOS show that the observed VDOS changes are driven by two distinct mechanisms. The first mechanism is the growing fraction of surface atoms in the smaller particles which increases the contribution of surface modes to the total VDOS. As shown by the partial VDOS of the surface atoms in Fig. 5 this effect accounts for the shift of the LA peak to lower frequencies, the increase of the VDOS at intermediate frequencies and the notable decrease of the TO peak.
While the surface modes lead to an overall downward shift of the VDOS, the picture changes if one looks at the frequency change of specific bulk-like phonon modes. As shown by Fig. 4 and confirmed by the behavior of the core atoms in Fig. 5 (the partial VDOS of the core atoms should not be affected by surface modes), the frequencies of the bulk modes are either unchanged or increase as the particles become smaller. The most likely reason for this behavior is the presence of a capillary pressure inside the core of the particles that compresses and stiffens the lattice.
In summary one can say that there are two different surface effects that affect the VDOS of Si nanoparticles in an opposing manner. While the appearance of surface modes that are not present in bulk Si pushes the VDOS of the particles to lower frequencies, the frequencies of the remaining bulk modes are increased by the effect of capillary pressure.
The increase of the VDOS at intermediate frequencies at the expense of the height of the TO peak that is caused by the surface modes provides a good explanation for the experimentally observed strong decrease of Raman shifts in silicon nanoparticles.Meier:06a Calculations of Meier et al.Meier:06a have shown that the measured Raman frequencies are lower than those predicted by the phonon confinement model. Their calculations, however, used the dispersion relations of bulk silicon and did not include any changes of the VDOS in the nanoparticles. Our results suggests that the transfer of weight from the TO peak to lower frequencies caused by the appearance of surface modes can account for the discrepancy between the experimental results and the phonon confinement model.
In general, our calculations agree well with previous studies of the vibrational properties of fcc and bcc metal nanoparticles.Kara:98a ; Sun:01a ; Meyer:02a ; Meyer:03a ; Meyer:07a ; Roldan:07a Similar to the observations in this study, the metallic nanoparticles show an increase and more linear behavior of the VDOS at low frequencies whereas the high frequency LA peak (note that there are no optical modes in the fcc and bcc lattices) is diminished and shifted to higher frequencies. Partial density of states calculations have shown that the increase of the low-frequency VDOS and the loss of weight of the LA peak in copper nanoparticles can be attributed to modes localized at the particle surfacesMeyer:03a ; Meyer:07a whereas the shift of the LA peak is caused by capillary pressure.Meyer:02a ; Meyer:03a We conclude that the TA and TO peaks in the Si nanoparticles undergo similar changes as the TA and LA peaks in the metallic systems.
The structure of the calculated VDOS and the fact that we were able to derive phonon frequencies from the projected density of states shows that the phonon picture can be successfully used to describe the vibrational modes in Si nanoparticles with diameters down to sizes below 4 nm. For particles with diameters of 3 nm and less our results indicate an onset of non-monotonous changes of physical properties as a function of the particle size. This means that the size of these particles is below the lower limit of the scaling regime where properties scale with the particle diameter in a simple manner. The vibrational modes of particles in this range are still rather bulk-like, but deviations from the bulk picture become more pronounced. This finding agrees with Ref. Valentin:07a, where it was concluded that for silicon particles with diameters above 2.5 nm the VDOS becomes bulk-like.
Unfortunately, the limitations of the MEAM potential employed in this work do not allow calculations of quantitatively correct phonon frequencies. For this reason it would be interesting to verify our results with another model. While DFT calculations of the larger particles are currently out if reach, it might be possible to perform such calculations for the smallest particles used in this study.
Acknowledgements.
R.M. would like to thank A. Lorke and C. Meier for fruitful discussions and insight into their experimental results. We also thank P. Entel for his discussions about our simulations. Support by the Shared Hierarchical Academic Research Network (SHARCNET),SHARCNET Laurentian University, and the Deutsche Forschungsgemeinschaft (SFB 445) is gratefully acknowledged.References
- (1) G. Dolling, in Inelastic Scattering of Neutrons in Solids and Liquids, Vol. II, edited by S. Ekland (International Atomic Energy Agency, Vienna, 1963)
- (2) G. Nilsson and G. Nelin, Phys. Rev. B 6, 3777 (1972)
- (3) B. P. Pandey and B. Dayal, J. Phys. C: Solid State Phys. 6, 2943 (1973)
- (4) P. Giannozzi, S. de Gironcoli, P. Pavone, and S. Baroni, Phys. Rev. B 43, 7231 (1991)
- (5) S. Wei and M. Y. Chou, Phys. Rev. B 50, 2221 (1994)
- (6) H. Richter, Z. P. Wang, and L. Ley, Solid State Comm. 39, 625 (1981)
- (7) S. Furukawa and T. Miyasato, Phys. Rev. B 38, 5726 (1988)
- (8) Z. Sui, P. P. Leong, I. P. Herman, G. S. Higashi, and H. Temkin, Appl. Phys. Lett. 60, 2086 (1992)
- (9) H. Münder, C. Andrzejak, M. G. Berger, U. Klemradt, H. Lüth, R. Herino, and M. Ligeon, Thin Solid Films 227, 27 (1992)
- (10) M. Fujii, Y. Kanzawa, S. Hayashi, and K. Yamamoto, Phys. Rev. B 54, R8373 (1996)
- (11) H. Tanino, A. Kuprin, H. Deai, and N. Koshida, Phys. Rev. B 53, 1937 (1996)
- (12) N. Wang, Y. Tang, Y. Zhang, C. Lee, I. Bello, and S. Lee, Chem. Phys. Lett. 299, 237 (1999)
- (13) L. Saviot, D. B. Murray, and M. C. Marco de Lucas, Phys. Rev. B 69, 113402 (2004)
- (14) K. W. Adu, H. R. Gutiérrez, U. J. Kim, G. U. Sumanasekera, and P. C. Eklund, Nano Lett. 5, 409 (2005)
- (15) C. Meier, S. Lüttjohann, V. Kravets, H. Nienhaus, A. Lorke, and H. Wiggers, Physica E 32, 155 (2006)
- (16) D. Ristić, M. Ivanda, and K. Furić, J. Mol. Struct. 924–926, 291 (2009)
- (17) I. H. Campbell and P. M. Fauchet, Solid State Comm. 58, 739 (1986)
- (18) P. Heino, Eur. Phys. J. B 60, 171 (2007)
- (19) X. Hu, G. Wang, W. Wu, P. Jiang, and J. Zi, J. Phys.: Condens. Matter 13, L835 (2001)
- (20) A. Valentin, J. Sée, S. Galdin-Retailleau, and P. Dollfus, J. Phys.: Conf. Ser. 92, 012048 (2007)
- (21) M. I. Baskes, J. S. Nelson, and A. F. Wright, Phys. Rev. B 40, 6085 (1989)
- (22) M. I. Baskes, Phys. Rev. B 46, 2727 (1992)
- (23) M. I. Baskes, J. E. Angelo, and C. L. Bisson, Modelling Simul. Mater. Sci. Eng. 2, 505 (1994)
- (24) A. Kara and T. S. Rahman, Phys. Rev. Lett. 81, 1453 (1998)
- (25) R. Meyer, S. Prakash, and P. Entel, Phase Transitions 75, 51 (2002)
- (26) R. Meyer, L. J. Lewis, S. Prakash, and P. Entel, Phys. Rev. B 68, 104303 (2003)
- (27) R. Meyer and P. Entel, Z. Kristallogr. 222, 646 (2007)
- (28) M. I. Baskes, Mater. Sci. Eng. A261, 165 (1999)
- (29) C.-L. Kuo and P. Clancy, Surface Sciences 551, 39 (2004)
- (30) D. E. Wolf and P. Nozière, Z. Phys. B 70, 507 (1988)
- (31) D. Y. Sun, X. G. Gong, and X.-Q. Wang, Phys. Rev. B 63, 193412 (2001)
- (32) B. Roldan Cuenya, A. Naitabdi, J. Croy, W. Sturhahn, J. Y. Zhao, E. E. Alp, R. Meyer, D. Sudfeld, E. Schuster, and W. Keune, Phys. Rev. B 76, 195422 (2007)
- (33) http://www.sharcnet.ca