In savvy pursuit of Local Group blue massive stars
Abstract:
The important role of metallicity on massive star evolution and the combination of multi-object spectrographs and 10m class telescopes, have lead to numerous systematic studies of massive stars in Local Group galaxies. While color based quests of blue massive stars are relatively successful, they must be confirmed with spectroscopy and usually lead to lists dominated by B-type modest-mass stars. We have developed a friends of friends code to find OB associations in Local Group galaxies, presented in Garcia et al. (2009). One of the key points of the method is the photometric criterion to choose candidate OB stars from the reddening-free Q parameter, that could be easily extended to include from GALEX to near-IR photometry. While not a new idea, one of our code’s strong advantages is the automatic determination of evolutionary masses for the members, enabling a quick and more insightful choice of candidates for spectroscopy, and the identification of potential advanced evolutionary stages. We present our work on the very metal-poor irregular IC 1613 (Garcia et al. 2010a). The association properties are not only a powerful aid towards finding the most interesting candidate massive stars, but also reveal the galaxy’s structure and recent star formation history.
1 Introduction
Massive stars are chief agents of galactic-scale feedback, shaping the ISM with mighty winds throughout their evolution, and utterly disrupting their environment in the supernova explosion that puts their lives to an end.
Metallicity (Z) has a crucial two-fold role on blue massive star (BMS) evolution: (i) through the equations of stellar structure, and (ii) through the stellar wind (since , Mokiem et al. 2007). BMSs must be therefore studied systematically as a function of metallicity.
In particular, we are in dire need to understand what happens at metallicities smaller than the Small Magellanic Cloud’s, to make the connection with the early Universe first stars. The irregular galaxy IC 1613 is ideal to study the very-poor metallicity regime (Garcia et al. 2010b), located 714 Kpc away (Dolphin et al. 2001) with metallicity 0.04 to 0.2 Z⊙ (Talent 1980, Davidson & Kinman 1982, Dodorico & Dopita 1983, Peimbert et al. 1988, Kingsburgh & Barlow 1995, Tautvaišienė et al. 2007, Herrero et al. 2010). However, the required exposure times for quantitative spectroscopy of stars at this distance are long. It is therefore critical to build a good BMS candidate list.
2 What is AUTOPOP?
AUTOPOP is a highly customizable, modular code written in IDL. A detailed discussion of its use and the underlying theoretical concepts are given in Garcia et al. (2009).
Provided with a photometric catalogue of stars and user-defined target selection criteria for BMS, and isochrones, it automatically finds OB associations and analyzes their color-magnitude diagram. The final product is a list of candidate blue massive stars and their masses.
Here we present a brief description of the code and its application to IC 1613. For more details we refer the reader to Garcia et al. (2009, 2010a).
2.1 Input material
The code must be fed: (i) a photometric catalog, (ii) user-defined criteria for target selection and extinction correction, and (iii) isochrones for age and mass determination.
The only requirement for the input catalog is to have coordinates, and the colors required for target selection/extinction correction. Since the code is modular the format is free, although in this case the user must also provide the reading routine.
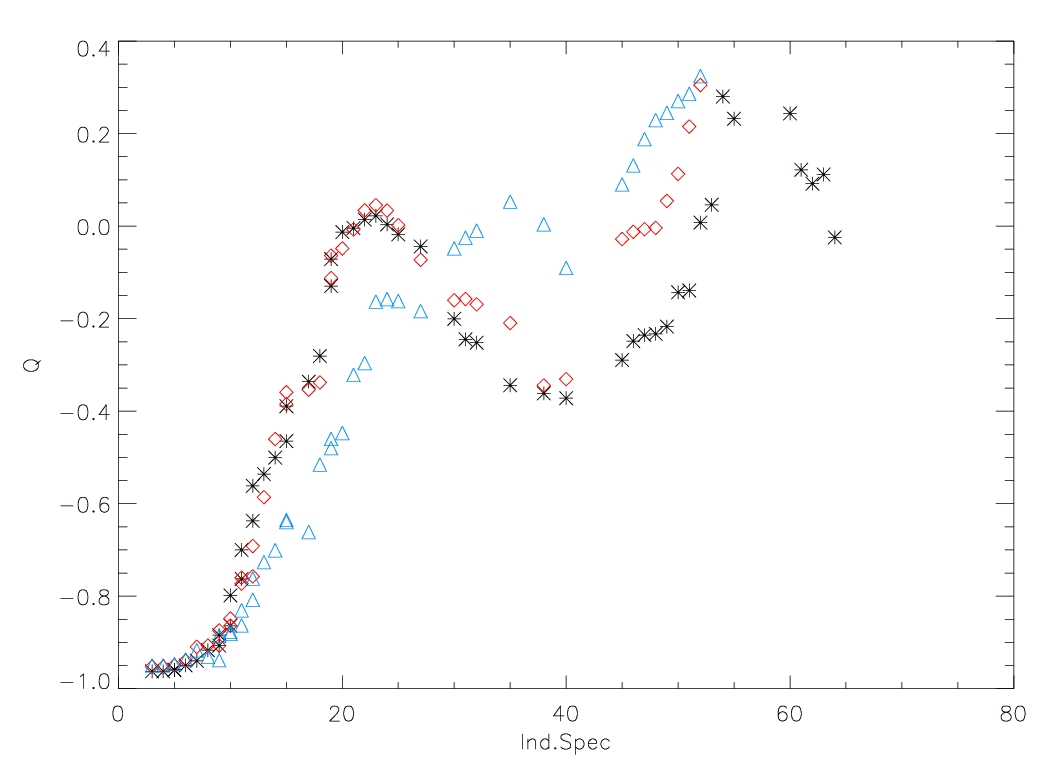
At the moment, the target selection criteria is based on the reddening-free Q parameter
| (1) |
which increases monotonically towards later spectral types in the interval , corresponding to O3-A0 types (see Fig. 1). In Fig. 5 of Garcia et al. (2009) we showed that most known OB stars in IC 1613 have .
However, following its versatility philosophy, the code allows to easily modify the target selection criteria. For instance, instead of using only optical photometry, the code could be changed to allow a linear combination of more colors including GALEX and 2MASS data. Alternatively, the selection criteria could be based on fits to the spectral energy distribution made, for instance, with CHORIZOS (Maíz-Apellániz 2004). The latter method has been applied to M31 by Kang et al. (2009).
Finally, the user is free to use the isochrones of his/her choice, with the only requirement that it is stored in an IDL structure storing all the fields used by AUTOPOP.
2.2 Code core
The code consists of two main modules: automatic finding of geometrical groups in the sky, which we shall call OB associations, and the isochrone analysis of such associations.
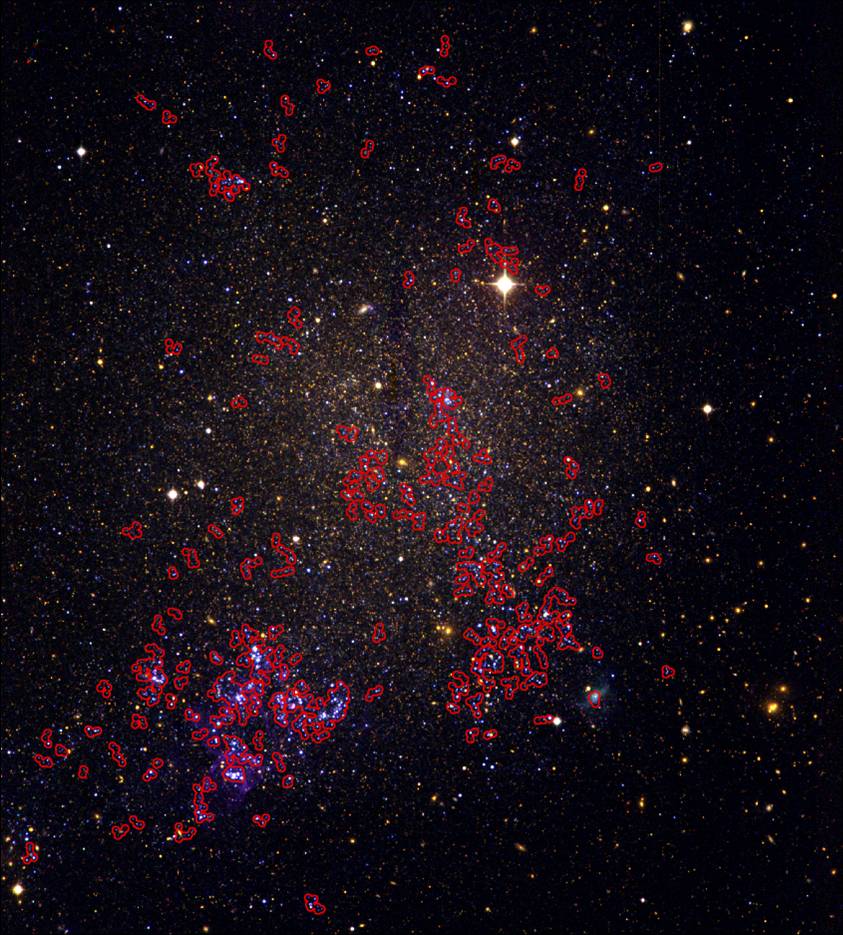
The search of groups in the sky follows the Friends-of-Friends philosophy or Path-Linkage criterion, after Battinnelli (1991): two stars belong to the same association if they dist less than a given search distance (). Given a target, the program looks for other stars within the search distance and registers them as members of the same association. The search is repeated for all the new members until no star is found within from any of the peripheral stars. Besides the list of points with spatial coordinates, the code must also be provided with the search distance and the minimum number of members for a group to be considered so. These parameters are specific for different galaxies (or input catalogs), as we found they may be strongly dependent on the instrumental set-up (Garcia et al. 2010a).
Because the search of groups is run on a BMS candidate list, the resulting geometrical groups are considered OB associations. One may argue that there are systematics on this kind of codes (see Bastian et al. 2007) and that OB associations are actually hierarchical groups, a subset of the continuum of star formation only constrained by definition (see Elmegreen & Efremov 1998). This has been thoroughly discussed in Garcia et al. (2009,2010a) and shall not be repeated here, but the conclusion is that physical or not, these groups are helpful in sorting out the content of blue massive stars in a galaxy.
The photometric analysis to derive masses and ages is made in the Q vs Vdered parameter space, Vdered being the observed stellar magnitude corrected from extinction. Such correction can be made thanks to the relation of Q with spectral type (therefore intrinsic color) for early-type stars. Massey et al. (2000) parametrized this relation for low-metallicity stars:
| (2) |
using Kurucz’ ATLAS9 Z=0.08Z⊙ models (no such relationship exists for metallicity as low as IC 1613’s). This equation will not hold if the reddening law deviates from the standard behaviour, but in this case a traditional correction in the B-V vs V diagram will not be valid either.
Even though photometric errors are larger in the Q vs Vdered parameter space compared to the traditional B-V vs V diagram because more colors are involved, we preferred the former because isochrones are more spread, and extinction is individually corrected towards each target. Finally, the code for automatic isochrone analysis basically finds which isochrones enclose the star and derives the evolutionary stellar properties from interpolation of the closest points of those isochrones.

3 Products from IC 1613 analysis
In short, AUTOPOP ingests a photometric catalog and returns a list of groups of likely OB stars, their ages, and masses for the members. The most direct application is a ready-to-use list for spectroscopy of the most massive members of a given galaxy. The output tables for OB association members and properties are VO friendly, hence can be easily cross-matched with lists of X-ray sources or other public catalogs, increasing the chances to find interesting targets.
We have applied AUTOPOP to the analysis of the BMSs population of stars in IC 1613 (Garcia et al. 2009, 2010a). The input catalog of stars was built from observations of IC 1613 with the 2.5m Isaac Newton Telescope (INT) using the Wide Field Camera (WFC). The field of view () covers the whole galaxy with a resolution of 0.33/pixel. The faint limit is V=25, and the maximum V-magnitude error for a V=23 star is 0.1mag. More details are provided in Garcia et al. (2009).


For the study of the association populations we used Lejeune & Schaerer (2001)’s basic grid isochrones of Z=0.004 (0.2Z⊙), who recalculated Charbonnel et al. (1993)’s stellar tracks with improved relations of photometric colors and stellar parameters.
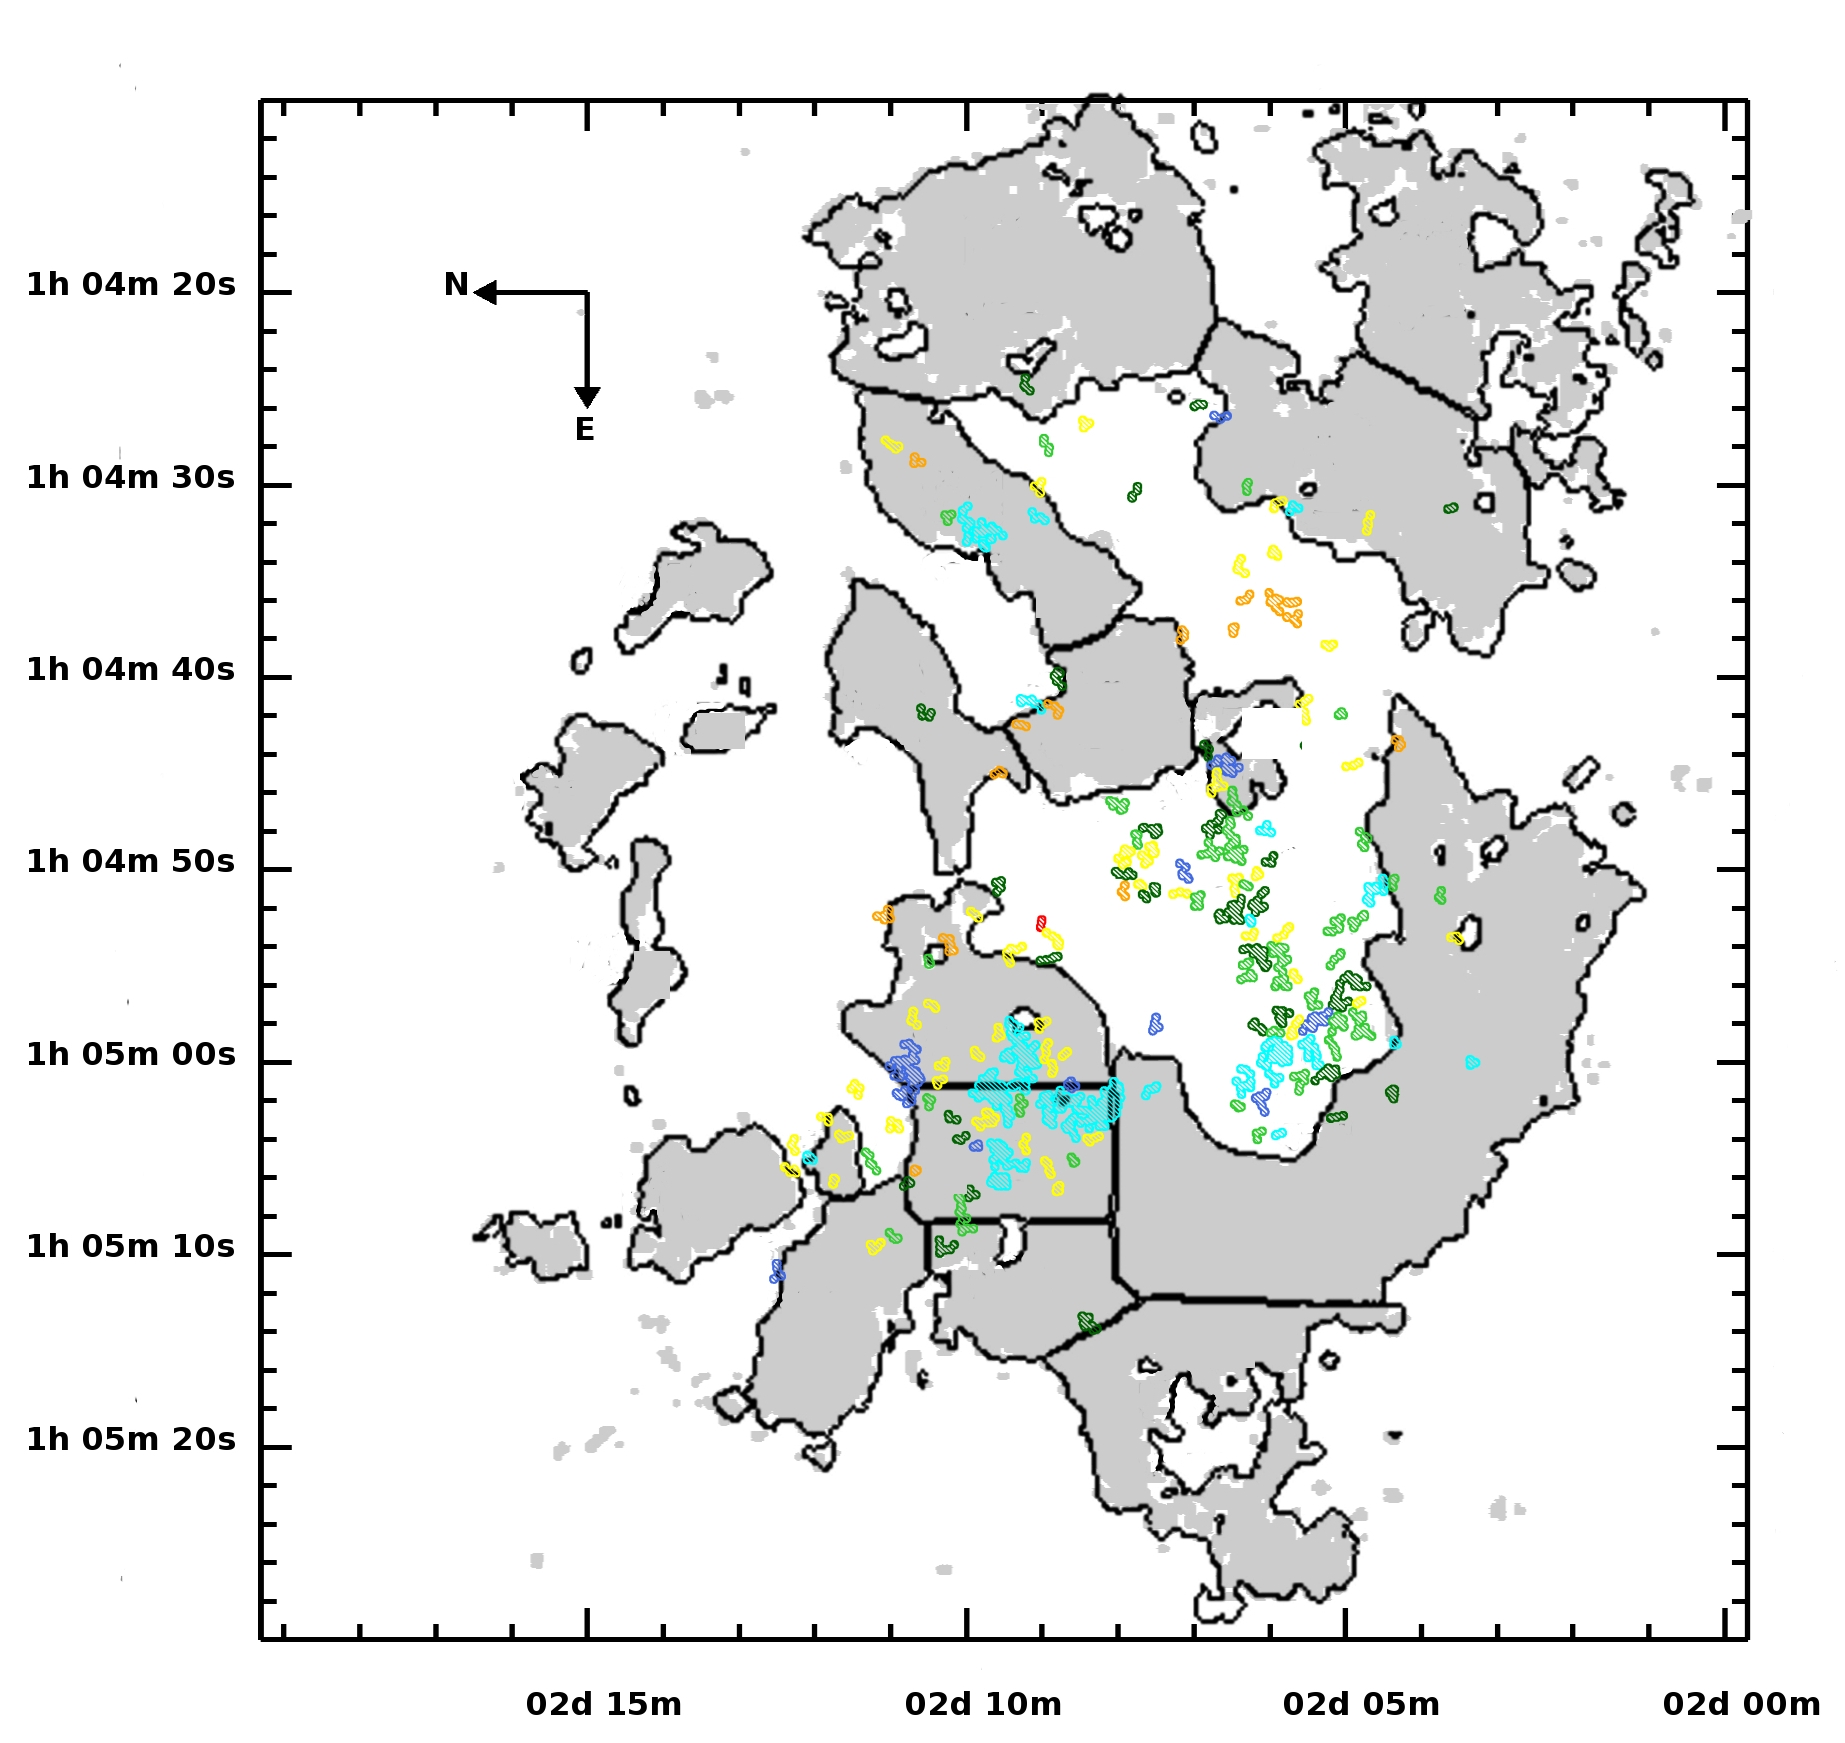
The resulting OB associations are shown in Fig. 3. They group in the NE lobe of the galaxy, where IC 1613 displays spectacular giant HII shells. We find association ages ranging from 5.9 to 7.7, usually with some spread. For each association, we provide its age as a colored contour in Fig. 3 (cyan , blue , dark green , light green , yellow , orange , red , violet ). There seems to be a galactic-scale age gradient following the NE direction, with the youngest members located in the NE lobe. This region, which also exhibits the largest age dispersion in the galaxy, is located in a density enhancement of neutral hydrogen (see Garcia et al. 2010a and Fig. 3). This fact suggests that star formation has proceeded in this region for an extended period of time, and that sequential star formation may be at work.
4 Summary and conclusions
The spectroscopic studies of OB stars in the Local Volume are now possible thanks to multi-object spectrographs on 10m-class telescopes. Such studies are driven by the need to understand the impact of metallicity on OB star evolution. It is necessary to optimize the selection of targets, since these observations are very expensive in observing time. AUTOPOP provides an optimal way of obtaining potentially very interesting candidates.
Acknowledgements
Funded by Spanish MICINN under CONSOLIDER-INGENIO 2010, program grant CSD2006-00070, and grants AYA2007-67456-C02-01 and AYA2008-06166-C03-01.
References
Bastian N., et al., 2007, MNRAS, 379, 1302
Battinelli P., 1991, A&A, 244, 69
Charbonnel C., et al., 1993, A&ASS, 101, 415
Davidson K., Kinman T.D., 1982, PASP, 94, 634
Dodorico S., Dopita M., 1983, in Supernova Remnants and their X-ray Emission, 101, 517
Dolphin, A. E., et al., 2001, ApJ, 550, 554
Elmegreen B.G., Efremov Y.N., 1998, arXiv:astro-ph/9801071
Fitzgerald M. P., 1970, A&A, 4, 234
Garcia M., Herrero A., Vicente, B., Castro, N., Corral, L. J., Rosenberg, A., Monelli, M., 2009, A&A, 502, 1015
Garcia M., et al., 2010a, A&A, in press
Garcia M., et al., 2010b, proceedings of Ultraviolet Universe 2010
Herrero A., Garcia M., et al., 2010, A&A, 513, 70
Kang Y., Bianchi L., Rey S.-C., 2009, ApJ, 703, 614
Kingsburgh R.L., Barlow M.J., 1995, A&A, 295, 171
Lejeune T., Schaerer D., 2001, A&A, 366, 538
Maíz-Apellániz J., 2004, PASP, 116, 859
Massey P., Waterhouse E., DeGioia-Eastwood K., 2000, AJ, 119, 2214
Mokiem, M. R., et al. 2007, A&A, 473, 603
Peimbert M., Bohigas J., Torres-Peimbert S., 1988, RMxAA, 16, 45
Talent, D.L., 1980, Ph.D. Thesis
Tautvaišienė G. et al., 2007, AJ, 134, 2318