Observation of Energetic Jet Production in
Collisions at TeV using the ATLAS
Experiment at the LHC
Abstract
We report the observation of energetic jet production in proton-proton collisions at TeV, based on about 1 nb-1 of integrated luminosity collected by the ATLAS detector. The algorithm is used to reconstruct jets with GeV and . Jets with up to GeV and events with dijet mass up to TeV are observed. The jet shapes and charged particle flow confirm that the observed jet signal corresponds to collimated flows of particles in the final state.
1 Introduction
The observation of energetic jets produced in collisions at TeV is reported, using about nb-1 of data collected by the ATLAS experiment. Kinematic distributions in inclusive jet and dijet production are presented, together with internal jet structure and charged particle flow in the event. No attempt is made to correct the measurements for detector effects or account for systematic uncertainties.
These measurements were performed using the ATLAS detector, which is a general purpose, hermetic detector described in detail elsewhere [1]. The ATLAS tracking system covers the pseudorapidity range , while the electromagnetic and hadronic calorimeters cover . The data are compared to PYTHIA 6.4.21 [2], which is based on leading order perturbative QCD matrix elements plus parton shower. The Monte Carlo (MC) uses a set of tuned parameters denoted as ATLAS MC09 [3] along with MRST LO∗ parton density functions [4], and the full ATLAS detector response is modeled in GEANT4 [5].
2 Event selection
The data were collected during the first LHC runs at TeV in March and April 2010. Events were triggered by requiring at least one hit from minimum bias trigger scintillators (MBTS) [6] that cover 2.09 3.84. The events are required to have a reconstructed primary vertex with a -position within 10 cm of the detector center in order to suppress beam-related backgrounds and cosmic rays. Additional quality criteria are also applied to ensure that jets are not produced by single noisy calorimeter cells or problematic detector regions [7].
3 Jet reconstruction
Jets are identified using the jet algorithm [8] with distance parameter by performing four-momentum recombination on topological clusters [9]. These clusters are seeded by calorimeter cells with above the cell energy noise. All directly neighbouring cells are added, then neighbors of neighbours are iteratively added for all cells with signals above a secondary threshold . The measured jet transverse momentum , as determined at the electromagnetic scale 111The electromagnetic scale is the appropriate scale for the reconstruction of the energy deposited by electrons or photons in the calorimeter., systematically underestimates that of the hadron-level jet due to calorimeter non-compensation and dead material. Consequently an average correction , determined as a function of and from MC simulation, is applied to obtain the corrected . No attempt is made to unfold the effects of the finite detector resolution.
Events are required to have at least one jet with (corrected) GeV and . Preliminary studies indicate that for jets with , the relative response of the calorimeter to jets in different rapidity regions is correctly modeled by MC to within . A first determination of the energy scale for jets, using in-situ isolated tracks and calorimeter measurements and test beam results, establishes an absolute jet energy scale uncertainty of about .
4 Results
4.1 Inclusive Jet Production
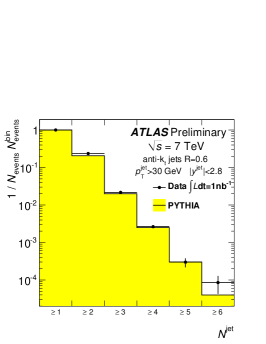
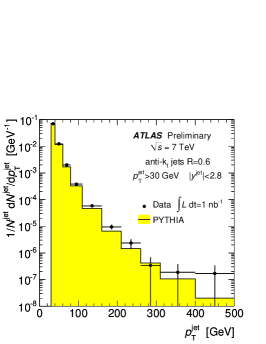
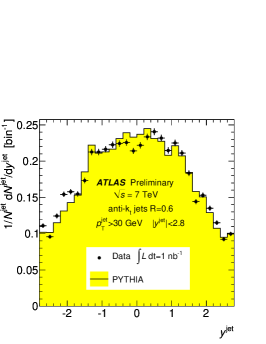
Figure 1 presents the multiplicity, transverse momentum, and rapidity distributions for all jets with GeV and . Events with six jets in the final state are observed, and jets are observed with up to 500 GeV. The MC provides a reasonable description of the distributions, but still shows some deficiencies in the observed jet rapidity distribution.
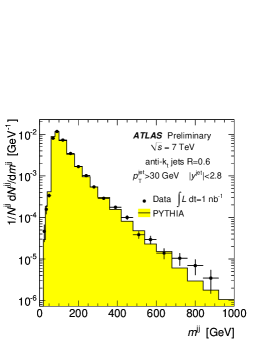
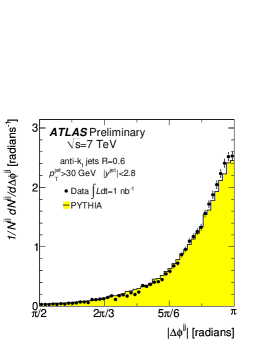
The invariant mass of the two leading jets and their azimuthal angular separation are presented in Fig. 2. The shape of the distribution at low mass reflects the limited phase space due to the thresholds applied on and . Above that, the observed spectrum decreases with increasing up to a dijet mass around 1 TeV. The observed distribution strongly peaks at , indicating a dominant back-to-back dijet configuration in the final state. The shapes of the dijet mass spectrum and distribution are described by MC simulation, though the MC underestimates the data at large .
4.2 Jet Shapes and Charged Particle Flow
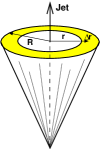
The transverse momentum distribution inside the jet and the charged particle flow around the jet, which are illustrated schematically in Fig. 3, are studied in order to test our quantitative understanding of the jet properties. The differential jet shape illustrated in Fig. 3(a) is defined as the average fraction of jet transverse momentum density within an annulus spanning around the jet axis:
| (1) |
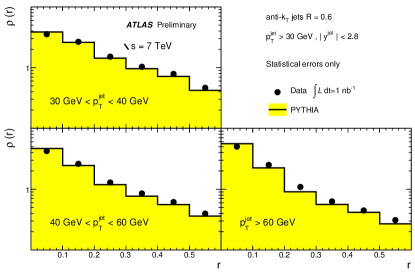
where denotes the scalar sum of the transverse momentum of the calorimeter clusters in a given annulus, is the number of jets, , and are used. The observed jet shapes are presented in Fig. 4 for jets with GeV and in different regions of jet transverse momentum. The distributions peak at low , indicating the presence of a collimated flow of particles around the jet axis. The measurements are reasonably well described by the PYTHIA MC, which tends to produce slightly narrower jets than the data.
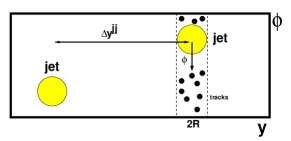
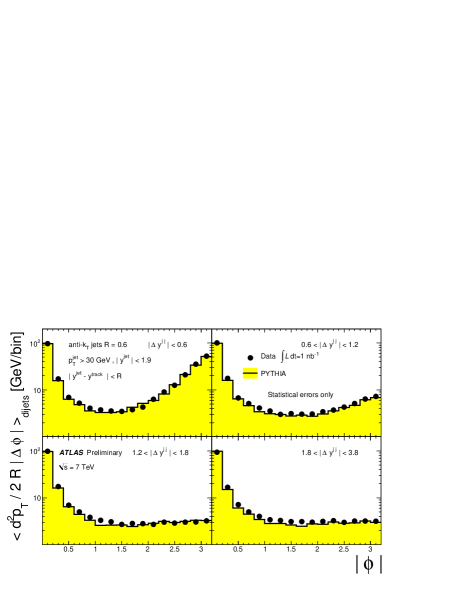
The charged particle flow around the jet provides an independent track-based technique to confirm the calorimeter-based jet shapes and to understand the final state topology. The hadronic activity out of the jet cone is studied in inclusive dijet events using tracks, which are selected as in [10] using MeV and . The average transverse momentum is measured as a function of the azimuthal distance to the jet axis as illustrated in Fig. 3(b) and is defined as:
| (2) |
where is the scalar sum of the transverse momentum of the tracks at a given distance to the jet, and bins of are used. Only tracks within the rapidity range spanned by the jet cone are included. The jet is required to have GeV and as determined by the tracking coverage of . This is performed as a function of the rapidity separation between the two leading jets . In Fig. 5, for the presence of two collimated jets of tracks at and is observed as expected. For , the jet structure for is followed by a plateau of remaining hadronic activity as increases. The PYTHIA MC provides a reasonable description of the data, but slightly underestimates the hadronic activity away from the jet direction.
5 Summary
We have reported the observation of energetic jet production in collisions at TeV, based on about 1 nb-1 of data collected by the ATLAS detector. The algorithm is used to reconstruct jets with GeV and from calorimeter energy clusters. Jets with up to GeV and events with dijet mass up to TeV are observed. The jet shapes and charged particle flow confirm that the observed jet signal corresponds to collimated flows of particles in the final state.
6 Acknowledgments
The author is grateful for support from the NSF US LHC Graduate Student Support Award.
7 Bibliography
References
- [1] ATLAS Collaboration, The ATLAS Experiment at the CERN Large Hadron Collider, JINST 3 S08003 (2008)
- [2] T. Sjöstrand et al., PYTHIA 6.4 Physics and Manual, JHEP 05, 026 (2006)
- [3] ATLAS Collaboration, ATLAS Monte Carlo tunes for MC09, ATL-PHYS-PUB-2010-002 (2010)
- [4] A. Sherstnev and R.S. Thorne, Parton distributions for LO generators, Eur. Phys. J. C 55, 553 (2008)
- [5] S. Agostinelli et al., GEANT4 – a simulation toolkit, Nucl. Instrum. Methods A 506, 250 (2003)
- [6] ATLAS Collaboration, Performance of the Minimum Bias Trigger in p-p Collisions at GeV, ATLAS-CONF-2010-025 (2010)
- [7] ATLAS Collaboration, Data-Quality Requirements and Event Cleaning for Jets and Missing Transverse Energy Reconstruction with the ATLAS Detector in Proton-Proton Collisions at a Center-of-Mass Energy of TeV, ATLAS-CONF-2010-038 (2010)
- [8] M. Cacciari, G. P. Salam and G. Soyez, The anti- jet clustering algorithm, JHEP 0804, 063 (2008)
- [9] W. Lampl et al., Calorimeter clustering algorithms: Description and performance, ATL-LARG-PUB-2008-002 (2008)
- [10] ATLAS Collaboration, Charged-particle multiplicities in pp interactions at GeV measured with the ATLAS detector at the LHC, Phys. Lett. B 688, 21 (2010)