Suppression of Faraday waves in a Bose-Einstein condensate in the presence of an optical lattice
Abstract
We study the formation of Faraday waves in an elongated Bose-Einstein condensate in presence of a one-dimensional optical lattice, where phonons are parametrically excited by modulating the radial confinement of the condensate. For very shallow optical lattices, phonons with a well-defined wave vector propagate along the condensate, as in the absence of the lattice, and we observe the formation of a Faraday pattern. By increasing the potential depth, the local sound velocity decreases and when it equals the condensate local phase velocity, the condensate becomes dynamically unstable and the parametric excitation of Faraday waves is suppressed.
pacs:
03.75.Kk,03.75.LmI Introduction
The term Faraday waves refers to a surface density modulation generated by the interference of counterpropagating phonons excited by an oscillatory motion of a nonlinear medium Faraday1831 . The formation of Faraday waves has been studied in several physical contexts Cross1993 , including convective fluids, nematic liquid crystals, nonlinear optics, biology, and, recently, in Bose-Einstein condensates (BECs) Engels2007 . In the context of ultracold gases, Faraday patterns can be excited by the modulation of the scattering length Staliunas2002 or by varying the transverse trap confinement Kagan2007 ; Engels2007 ; Nicolin2007 ; Capuzzi2008 , the main ingredient being the modulation of the nonlinear interaction. The study of the formation of spatial structures in a quantum fluid confined in a smooth potential, such as the cigar-shaped harmonic trap used in the BEC experiment Engels2007 , can give access to information about the excitation spectrum (and thus about the equation of state of the system) through the relation between the excitation frequency and the measured wave vector of the Faraday wave. This is somehow similar to Bragg spectroscopy on ultracold gases confined in an optical lattice, where the excitation spectrum is inferred by exposing the system to a periodic lattice modulation and measuring the energy absorption Stoeferle2004 ; Ozeri2005 ; Tozzo2005 ; Kollath2006 ; Fallani2007 . Proceeding along this line, one may expect to probe the spectrum of an ultracold gas, even in the presence of an optical lattice Kramer2005 , by observing the formation (or the lack of formation) of a Faraday pattern for any lattice depth provided that the system remains compressible (i.e. the lattice does not induces a superfluid-Mott transition).
In this paper we show that the presence of an optical lattice may dramatically alter the parametric excitation of Faraday waves. In particular, we show that the formation of the Faraday waves can be suppressed not only by the appearance of a gap in the spectrum of collective excitations, but also by the fact that the local flow of the condensate exceeds the Landau critical velocity Watanabe2009 . We focus our study on a cigar-shaped condensate where phonons are parametrically excited by modulating the tight radial confinement at a frequency . The parametrically excited phonons have an energy and a Faraday wavevector determined by the energy spectrum of the system. We add a one-dimensional (1D) optical lattice along the axial direction, and, by increasing the lattice potential depth , we observe the suppression of the parametric excitation of phonons with wavevector , even if is still an allowed energy of the collective modes. The sound mode at , excited by the parametric instability, is submerged by several other modes excited by the dynamical instability. This instability can be related to the previously-studied instabilities in bosonic superfluid currents moving with respect to an optical lattice potential. In these set-ups the current remains stable if the superflow momentum does not exceed half the recoil momentum Sarlo2005 ; Mun . At variance, as in our system the condensate center-of mass is at rest, the dynamical instability washing out the Faraday pattern is due to a local supersonic flow through the periodic potential induced by the continuous driving of the radial breathing mode. Indeed, we observe that the critical value at which Faraday waves are suppressed corresponds to the critical value of the local BEC flow Watanabe2009 .
The article is organized as follows. In Sec. II we introduce the nonlinear Schrödinger equations that describes the condensate in the elongated geometry. We make use of the three-dimensional (3D) Gross-Pitaevskii equation (GP) for the evaluation of the low-lying energy spectrum (Sec. III) and of a time-dependent nonpolynomial nonlinear Schrödinger equation (NPSE) to numerically study the spatial Faraday pattern formation (Sec. IV). In Sec. IV we compare the results for a cylindrical and a cigar-shaped trap and show that the suppression of the parametric excitations of Faraday waves occurs when the local condensate flow reaches the critical value associated to the Landau criterion. Our concluding remarks are given in Sec. V.
II Theoretical framework
We study a 3D Bose condensate trapped into a cigar-shaped potential, possibly with a 1D periodic potential superimposed along the axial direction. The full description of the system in the limit of zero temperature and low density is given by the 3D GP
| (1) |
with the wavefunction of the condensate, the mass of the atoms composing the condensate, the number of particles, and the interaction coupling constant with the -wave scattering length between particles. In our setup, the trapping potential is the sum of a cigar-shaped harmonic trap plus an optical potential
| (2) |
with the trapping frequency in the perpendicular direction, the trapping frequency in the longitudinal direction, and . The additional potential is either zero or equal to a periodic potential , with periodicity .
Given the above trap geometry, it has been shown in Ref. Salasnich2002 that a reliable description of the condensate dynamics is given by an effective 1D time-dependent NPSE. This equation is derived by a variational ansatz for the wavefunction
| (3) |
where the transverse wavefunction is modelled by a Gaussian function
| (4) |
with a time- and longitudinal-dependent variance . The validity of this description is based on the assumption that the transverse wavefunction is slowly varying in such a way that the radial velocity can be neglected. Furthermore, it has been shown that neglecting the transverse excitations does not affect the prediction for energy and dynamical instabilities Modugno2004 , or the onset of Faraday waves for a parametrically excited condensate Nicolin2007 . Both the longitudinal wavefunction and the variance are determined by the variational principle for the energy, and the result is that the longitudinal wavefunction is governed by the NPSE
| (5) | |||||
while the variance is algebraically determined by
| (6) |
The 3D density profile and velocity field can be obtained as
| (7) |
with the integrated 1D density. In the following we will consider the case of a radial confinement Hz and lattice spacing nm; this gives a recoil energy . The potential depth will be used as a parameter.
III The low-lying energy spectrum with periodic potential
We calculate the low-lying energy spectrum of the condensate subject to a cylindrical confinement () with periodic boundary conditions (PBC) for different lattice potential depths. Writing Eq. (1) in terms of the particle density and velocity and considering the hydrodynamic limit of the 3D GP Stringari1996 , we calculate the collective modes spectrum solving the eigenvalue equation
| (8) |
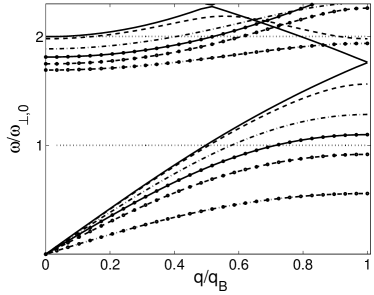
being the equilibrium density in the Thomas-Fermi approximation, and the density perturbation with zero angular momentum propagating along the axis. For that matter we discretize Eq. (8) in a rectangular domain , and impose PBC in , i.e., . Figure 1 shows the low-lying energy spectrum for the case of particles per site and several values of . As expected, by increasing the lattice depth, the lowest-energy band gets narrower and an energy gap opens at .
IV The Faraday wave excitations
In this section we present our numerical results for dynamics of the condensate in the presence of an optical lattice. To excite Faraday waves we proceed as follows: first we calculate the ground state for a static potential, setting , then we switch on the trap modulation at the frequency and amplitude . We fix and choose in order to be close enough to the natural breathing mode in absence of the lattice.
We focus on the dynamics of the density and velocity field of the atoms for increasing values of the lattice depth, and compare the case of an infinite cylinder, i.e. , and the case of a cigar-shaped BEC, for the same number of particles in the central site. The NPSE is numerically solved using a split-step method and spatial Fast Fourier transforms (FFT) in a finite domain with PBC. In our numerical calculations, we found that is enough to consider a spatial grid with 1024 points and a time step to follow the dynamics for long times up to several hundreds of the transverse frequency period.
IV.1 The infinite cylinder
To analyze the formation of a pattern on top of the time-modulated density we proceed as follows. At each time we separate the part with the spatial periodicity of the optical lattice from the total density profile. Explicitely, we write where
| (9) |
with and fitting parameters that characterize the renormalized trap, and the remaining fluctuation. The Faraday pattern will be analyzed in terms of the behaviour of this fluctuation.
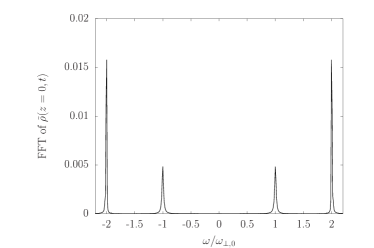
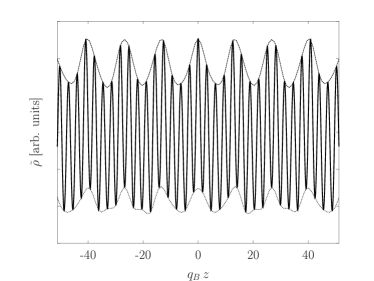
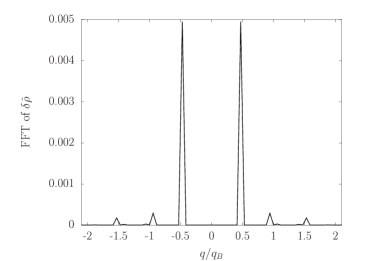
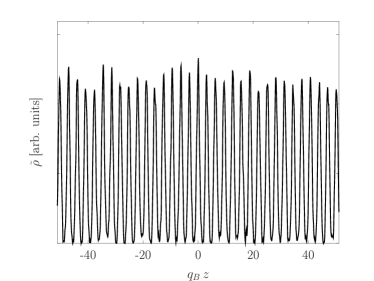
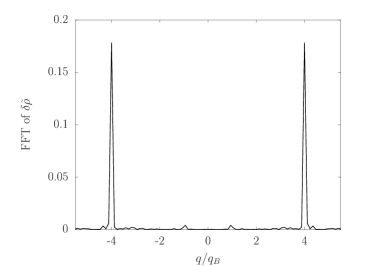
In Fig. 2 we show the Fourier transform of central density for a lattice depth . At the oscillation starts departing from a simple scaling solution and a different mode gets populated. This is seen clearly in the temporal FFT of the central density depicted in Fig. 2 where the frequency shows up. Shortly after, a well defined Faraday pattern is superimposed on the lattice. This is shown in Fig. 3 where the linear density and the spatial FFT of its fluctuation are plotted at a time . It is worthwhile noticing that in the spatial FFT of the peaks at are never present because of the choice of the fitting function in Eq. (9). The peaks in the bottom panel at are the wavevectors of the counter-propagating phonons giving rise to the Faraday pattern, as expected from Fig. 1. For longer times many more modes are populated and a pure Faraday excitation cannot be observed.
For deep lattices (), the frequency lies within the energy gap and no Faraday pattern can be formed. However, as can intersect an energy band, we may expect fluctuations associated to the wavelength of the corresponding collective excitation. In particular, at modes at are not excited anymore, while modes at are still present. In the spatial domain (see Fig. 4) two main features can be detected: i) contributions from higher Brillouin zones at , stemming from the periodicity of the GS density profile which is not contained in the weak limit ansatz for in Eq. (9); ii) a weak mode in the vicinity of , originating from the collective mode at (cf. the corresponding upper-band in the Fig. 1).
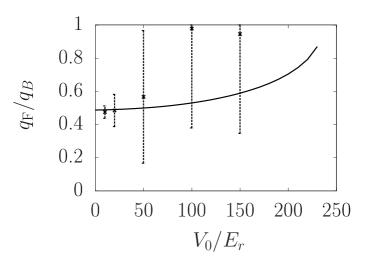
Although for intermediate values of , well before approaching the edge of the first Brillouin zone, one naturally expects to excite the pattern, we found that for , the mode at is not seen to increase substantially, and therefore it is not possible to identify a Faraday pattern. Indeed, we observe several excited wavevectors. In order to quantify the spreading in the -space as a function of we calculated the minimum of the average of , over the excitation during a given time interval. This is displayed is Fig. 5 together with its dispersion (schematized as error bars in the same figure) evaluated at the same time as . For the dispersion is of the same order of , more precisely, roughly all -vectors greater than 0.2-0.3 are excited. In Fig.5 we compare these results with the expected -value (solid line), as deduced by the low-lying energy spectrum (see Fig. 1) setting . As already anticipated, we can conclude that a clear Faraday pattern cannot be identified if , rather before the appearance of the energy gap.
IV.1.1 The role of the velocity field
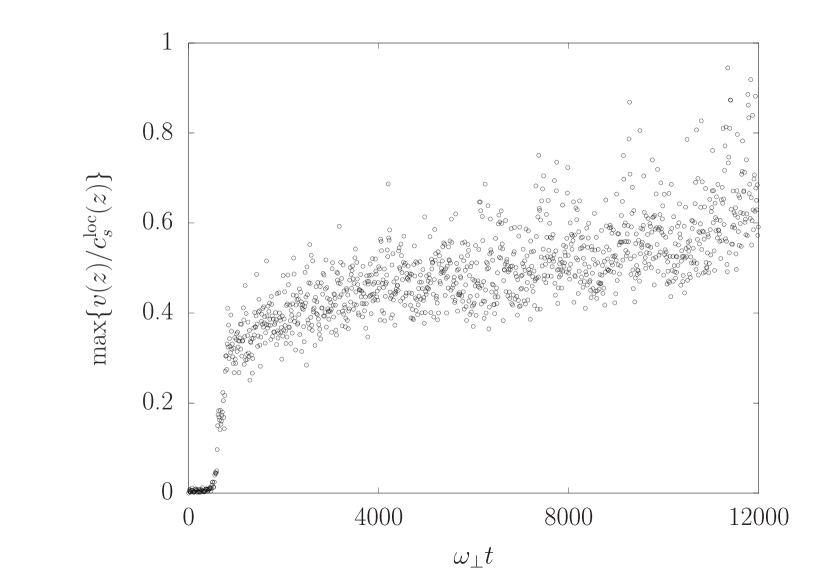
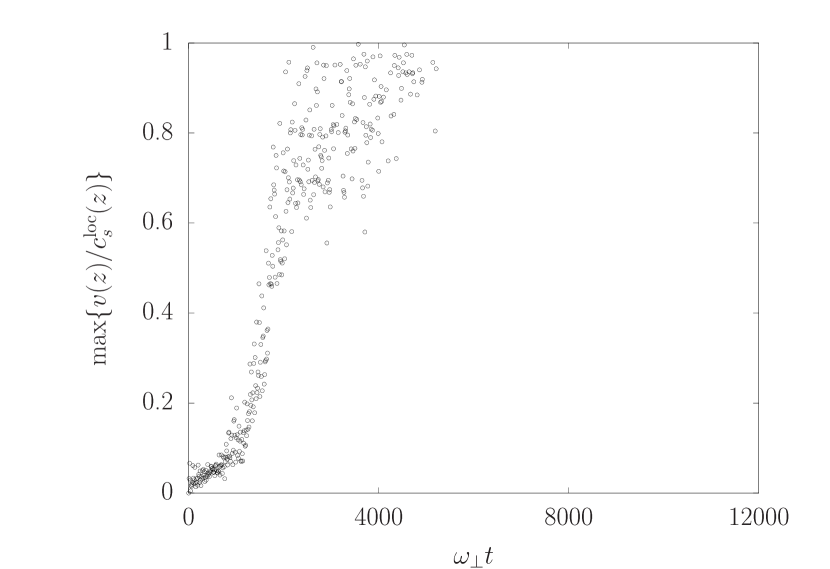
Aiming at understanding the mechanism of suppression of the Faraday wave excitation, we compare the local condensate velocity with the local sound velocity . At the maxima of the lattice potential, the central density is minimum, and we expect the ratio takes its maximum value. Figure 6 shows the behaviour of the maximum value of the ratio as a function of time, during the parametric excitation, for the case of a shallow (top panel) and of a deep (bottom panel) lattice. In the first case, where is always lower than , the increase of corresponds to the onset of the parametric excitation of Faraday waves, while in the second plot, as soon as becomes greater than the superfluid becomes unstable according to the Landau criterion, and we cannot identify a well-defined Faraday pattern but several unstable spatial modes. These findings are qualitatively reproduced if one compares the maximum local velocity to the sound velocity obtained from the slope of the dispersion relationship .
Since the velocity of the excitations are proportional to the modulation amplitude , one expects to excite the parametric instability without breaking the superfluid if is sufficiently small. However this may provoke a considerable delay for the onset of the Faraday pattern, in both numerical and real experiments. Indeed we have investigated this case for and found that for we do not observe the excitation of the Faraday mode during the modulation up to , corresponding to roughly 30s. Since the lifetime of a condensate in most experiments does not exceed a few seconds, a sizable value of , as that chosen in our first numerical study would be needed to observe the Faraday mode. In turn, this would give rise to a fast increase of the local flow velocity.
IV.2 Excitations in a confined lattice
To allow for a more direct application to current experiments carried out in optical lattices, hereafter we consider the effects of the longitudinal harmonic confinement. For that goal we take Hz and total number of atoms , parameters that ensure the same number of atoms in the central lattice site as in the cylindrical confinement.
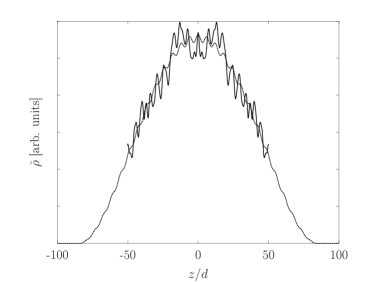
In Fig. 7 we show results for . The continuous line, that corresponds to , the factor of 5 having been chosen to zoom the density fluctuation, shows the set up of the Faraday pattern at compared to the ground state at (dashed line). The presence of the Faraday excitation can be confirmed by the inspection of the spatial FFT of the density fluctuation at . The lowest peaks correspond to (see Fig. 1), while the second main peaks correspond to , following the lattice periodicity. The broadening of the peaks with respect to the spatial FFT in the cylindrical confinement are due to the inhomogeneous density profile.

Our analysis for the case of a cigar-shaped confinement is in agreement with our study for the cylindrical trap, namely the axial confinement, in the limit where , does not affect the results shown in the previous section.
V Final remarks
The spectrum of a bosonic gas in an optical lattice strongly depends on the lattice potential depth. In the strongly correlated regime, where there are few particles per well, a deep lattice potential induces a quantum phase transition towards the incompressible Mott state. Otherwise, deep in the superfluid regime where the average well occupation is large, by increasing the lattice potential depth the Bogoliubov bands get narrower and the gaps widen out, as shown in Fig. 1. The parametric excitation of phonons and the observation of the onset of Faraday waves is expected to be possible if the excited mode is not in the Mott or Bogoliubov gaps Kramer2005 .
In this work we point out another mechanism of suppression of Faraday waves. During the parametric excitation, there is a local superfluid flow through the lattice barriers. The presence of these barriers do not affect the growth of phononic modes with a well defined wave vector while the flow velocity remains below the sound velocity Watanabe2009 . By increasing the potential depth, this condition cannot be fulfilled anymore: the density at the potential maxima decreases and thus the local sound velocity decreases too. The superfluid becomes unstable and the spectrum of the system cannot be inferred by the parametric excitation.
Acknowledgements
This work was supported by the CNRS-CONICET international cooperation grant n. 22966.
References
- (1) M. Faraday, Phil. Trans. R. Soc. London 121, 299 (1831).
- (2) For a general review, see M.C. Cross and P.C. Hohenberg, Rev. Mod. Phys. 65, 851 (1993).
- (3) P. Engels, C. Atherton, M.A. Hoefer, Phys. Rev. Lett. 98, 095301 (2007).
- (4) K. Staliunas, S. Longhi and G.J. de Valcarcel, Phys. Rev. Lett. 89, 210406 (2002).
- (5) Yu. Kagan, L.A. Manakova, Phys. Lett. A 361, 401 (2007).
- (6) A.I. Nicolin, R. Carretero-Gonzalez, and P.G. Kevrekidis, Phys. Rev. A 76, 063609 (2007).
- (7) P. Capuzzi and P. Vignolo, Phys. Rev. A 78, 043613 (2008).
- (8) T. Stoeferle et al., Phys. Rev. Lett. 92, 130403 (2004).
- (9) R. Ozeri, N. Katz, J. Steinhauer, and N. Davidson, Rev. Mod. Phys. 77, 187 (2005).
- (10) C. Tozzo et al., Phys. Rev. A 72, 023613 (2005).
- (11) C. Kollath, A. Iucci, T. Giamarchi, W. Hofstetter, U. Schollwoeck, Phys. Rev. Lett. 97, 050402 (2006).
- (12) L. Fallani et al., Phys. Rev. Lett. 98, 130404 (2007).
- (13) M. Krämer, C. Tozzo, and F. Dalfovo Phys. Rev. A 71, 061602 (2005).
- (14) G. Watanabe, F. Dalfovo, F. Piazza, L. P. Pitaevskii, and S. Stringari, Phys. Rev. A 80, 053602 (2009).
- (15) L. De Sarlo, L. Fallani, J.E. Lye, M. Modugno, R. Saers, C. Fort, and M. Inguscio, Phys. Rev. A 72, 013603 (2005).
- (16) J. Mun, P. Medley, G.K. Campbell, L.G. Marcassa, D.E. Pritchard, and W. Ketterle, Phys. Rev. Lett. 99, 150604 (2007).
- (17) L. Salasnich, A. Parola, and L. Reatto, Phys. Rev. A 65, 043614 (2002).
- (18) M. Modugno, C. Tozzo, F. Dalfovo, Phys. Rev. A 70, 043625 (2004); ibid, Phys. Rev. A 71, 019904(E) (2005).
- (19) S. Stringari, Phys. Rev. Lett. 77, 2360 (1996).