Angular Dependence of the Superconducting Transition Temperature in Ferromagnet-Superconductor-Ferromagnet Trilayers
Abstract
The superconducting transition temperature, , of a ferromagnet (F) - superconductor (S) - ferromagnet trilayer depends on the mutual orientation of the magnetic moments of the F layers. This effect has been previously observed in F/S/F systems as a difference between parallel and antiparallel configurations of the F layers. Here we report measurements of in CuNi/Nb/CuNi trilayers as a function of the angle between the magnetic moments of the CuNi ferromagnets. The observed angular dependence of is in qualitative agreement with a F/S proximity theory that accounts for the odd triplet component of the condensate predicted to arise for non-collinear orientation of the magnetic moments of the F layers.
pacs:
74.45.+c,75.70.-i,74.78.FkElectronic properties of a superconducting (S) film can be significantly altered by direct contact with a metallic ferromagnet (F) Bergeret et al. (2005); Buzdin (2005). Penetration of the superconducting condensate into a ferromagnet results in the breaking of singlet Cooper pairs by the exchange field and leads to a decrease of the superconducting transition temperature (). Recent discoveries of quantum interference effects in F/S heterostructures have shown that the F/S proximity effect is more interesting and complex than just the reduction of Jiang et al. (1995); Garifullin et al. (2002); Blum et al. (2002); Gu et al. (2002); Tagirov (1999); Leksin et al. (2010); Oh et al. (1997). Examples of non-trivial F/S proximity phenomena include (i) oscillations of with the F layer thickness () in F/S multilayers Jiang et al. (1995); Garifullin et al. (2002), (ii) oscillations of the critical current in S/F/S Josephson junctions with Blum et al. (2002) and (iii) manipulation of in F/S/F Gu et al. (2002); Tagirov (1999) and F/N/F/S Leksin et al. (2010); Oh et al. (1997) structures (N denotes a nonmagnetic metal) by switching the magnetic state of the F layers.
The superconducting condensate of a F/S system is predicted to consist of a singlet component and a triplet component with unusual symmetry Bergeret et al. (2001); Kadigrobov (2001); Bergeret et al. (2003); Fominov et al. (2003); Volkov et al. (2003); Halterman et al. (2007, 2008). The triplet part of the condensate function is expected to be -wave (i.e. even in the momentum variable). Therefore, by the Pauli exclusion principle, it must be odd in time. The -wave character of the condensate makes it robust against impurity scattering, and thus the odd triplet pairing should survive even in dirty F/S systems. If the magnetization of the ferromagnet is not spatially uniform, the triplet part of the condensate has three non-zero components corresponding to three projections, of the Cooper pair spin. The 1 components are immune to pair breaking by the exchange field, and thus can penetrate deep into the ferromagnet Bergeret et al. (2007). Recent measurements of the critical current in Josephson junctions with noncollinear magnetic barriers support the existence of this long-range odd triplet superconductivity Khaire et al. (2010).
The simplest model system for studies of the effect of spatially non-uniform magnetization on superconductivity is a F/S/F trilayer with non-collinear (neither parallel nor antiparallel) orientation of the magnetic moments of the F layers Tagirov (1999); Fominov et al. (2003). However, experimental tests of the F/S proximity effect in this system have been limited to the collinear geometry Gu et al. (2002); Potenza and Marrows (2005); Moraru et al. (2006); Zhu et al. (2009); Nowak et al. (2008). In this Letter, we describe experimental and theoretical studies of in CuNi/ Nb/ CuNi trilayers as a function of the angle between the CuNi layer magnetizations. We compare our experimental results to theories of the F/S proximity effect that take into account the odd triplet component of the condensate, and find that the clean limit of the proximity effect theory gives good qualitative description of the data.
The multilayer samples for our experiments were grown by dc magnetron sputtering in a vacuum system with a base pressure of Torr. We deposited a series of multilayers of the following composition: thermally oxidized Si substrate/ Ni80Fe20(4 nm)/ CuNi()/ Nb( 18 nm)/ CuNi()/ Ni80Fe20(4 nm)/ Ir25Mn75(10 nm)/ Al(4 nm) with ranging from 2 nm to 18 nm (see Fig. 1(a)). The ferromagnetic Ni80Fe20 layers placed next to the CuNi layers ensure uniform magnetization of the CuNi layers in our measurements Gu et al. (2002). The magnetization direction of the top F layer is pinned in the plane of the sample by exchange bias from the antiferromagnetic Ir25Mn75 layer. The CuNi alloy was grown by co-sputtering Cu and Ni targets, and the Ni concentration of 52 atomic percent was calculated from the Cu and Ni deposition rates.
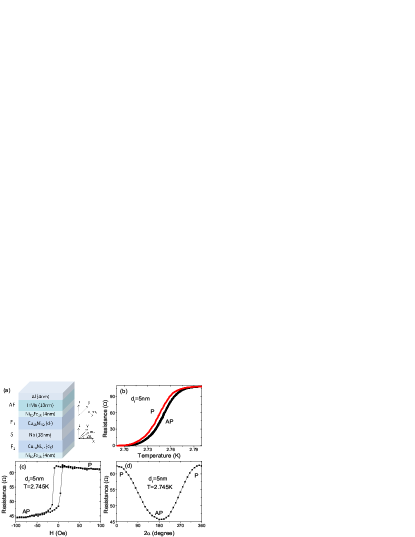
We pattern the samples into 200 m-wide Hall bars and perform four-point magnetoresistance measurements in a continuous flow 4He cryostat. Fig. 1(b) shows resistance versus temperature for the parallel (P) and antiparallel (AP) configurations of the CuNi layers for the sample with 5 nm thick CuNi. The superconducting transition temperature difference between the P and AP configurations, , is 7 mK. Fig. 1(c) shows the resistance as a function of magnetic field applied along the exchange bias direction in the middle of the superconducting transition at = 2.745 K. This figure demonstrates that a magnetic field of 100 Oe is sufficient to reverse and saturate the magnetization of the free layer and thereby create well-defined P and AP configurations. Fig. 1(d) shows resistance versus the angle between the F layer magnetizations, 2, measured at = 2.745 K. For this measurement, we stabilize the temperature in the middle of the superconducting transition to within 0.1mK, rotate the 100 Oe external magnetic field in the plane of the sample and measure the sample resistance as a function of 2.
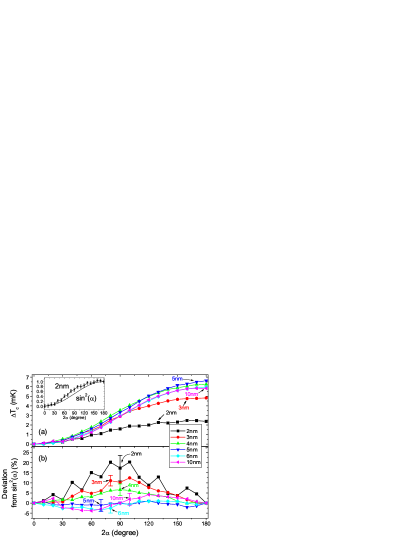
The angular dependence of is calculated from the angular dependence of the resistance, , such as that shown in Fig. 1(d) not . In order to convert the resistance data into , we use the slope of the curve, , in the middle of the superconducting transition (at = 2.745 K for the sample with 5 nm thick CuNi shown in Fig. 1(b)). The angular variation of , = , is calculated for a given as = . Fig. 2(a) shows for samples with CuNi thickness from 2 nm to 10 nm. This plot demonstrates that significantly deviates from a simple dependence given by . This is quantified in Fig. 2(b), which shows the percent deviation of the normalized angular variation of , , from . The deviation is significant for samples with 4 nm. The magnitude of the deviation reaches 20% for the = 2 nm sample.
We next discuss the comparison of our results with theory. The transition temperature can be calculated for our system, which is in the clean limit, using methods that include Halterman et al. (2007, 2008) the odd triplet correlations that are generated by the presence of magnets with non-collinear magnetizations. These methods are based on self-consistent solution of the microscopic Bogoliubov-de Gennes de Gennes (1989) equations. The matrix elements of these equations with respect to a suitable basis containing a sufficiently large number of elements, can be evaluated analytically as a function of , , and the other parameters in the problem. The eigenvalue problem for the resulting matrix is then numerically solved, using Halterman et al. (2008) a self consistent iterative process. To find , the self-consistency equation can be linearized Barsic et al. (2007) near the transition, leading to the form , where the are expansion coefficients of the position dependent pair potential Barsic et al. (2007) in the chosen basis and the are the appropriate matrix elements with respect to the same basis, as obtained from the linearization procedure. These matrix elements can be written as , where,
| (1) | ||||
| (2) |
Here , with being the usual dimensionless superconducting coupling, are unperturbed particle (hole) energies, is the total sample thickness in units of the Fermi wavelength, and denotes that the sum is cut off at energies beyond the Debye frequency. We have , , where , the axis is normal to the layers (see Fig. 1) and is unity in the superconductor and zero elsewhere. The quantity denotes the kinetic energy due to motion in the transverse direction. The and are the expansion coefficients of the quasiparticle amplitudes Barsic et al. (2007) in terms of the basis set. All energies are scaled by . All the sums and integrals in the above equations can be evaluated numerically with great precision as a function of temperature and of the other parameters in the problem. The value of is then found Barsic et al. (2007); Levin and Valls (1978); Allen and Dynes (1975) as the highest temperature for which the largest eigenvalue of the matrix is unity. This largest eigenvalue is readily found numerically.
In evaluating we have used the actual value of (18 nm), and K, where is the bulk transition temperature of the material forming the superconducting layer. The only other parameters in the problem are Halterman et al. (2008); Barsic et al. (2007) the superconducting coherence length , a parameter characterizing the magnet strength ( in the half metallic limit and for a non-magnetic metal) and the dimensionless barrier strength Halterman and Valls (2005), , characterizing interfacial scattering between the S and F layers. The intricacies of the numerics and the computing time required do not allow , , and to be used as free parameters in a best fit procedure. We have instead explored for best values within an experimentally reasonable region of parameter values. Results presented here are for nm, reasonable for a Nb film, appropriate for a relatively weak magnet, and , a barrier of moderate strength.
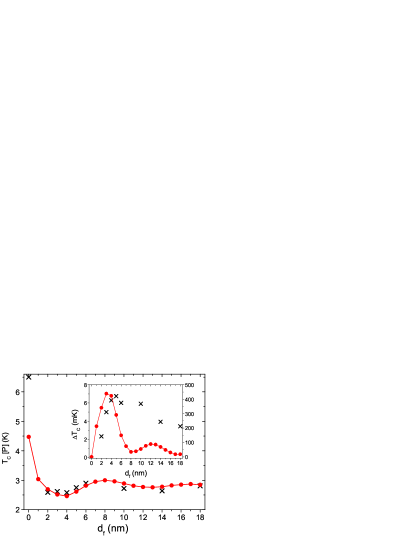
The results are shown in the next two figures. In the main plot of Fig. 3 we show the results for , the transition temperature at , versus . The experimental results show the expected Barsic et al. (2007) oscillations with , which are reproduced quite accurately and in detail by the theory. In the inset, we show the difference between the transition temperature at and at . This quantity is also plotted as a function of . Here, the general shape of the theoretical curve is qualitatively similar to the experiment, but the experimental overall scale of the phenomenon is much smaller than the theoretical one. We will return to this point below.
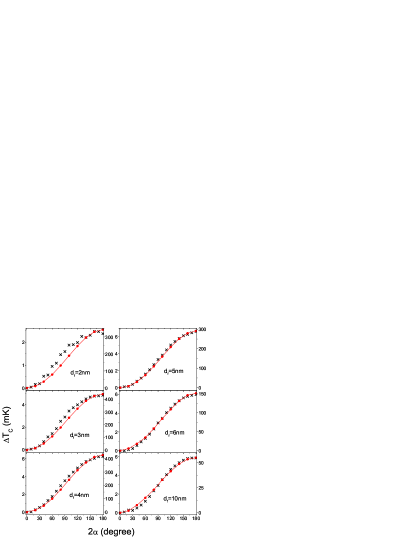
We consider next the dependence on . In the six panels of Fig. 4 we plot experimental and theoretical results for as a function of for six values of in the experimentally relevant range. The shapes of the curves are similar to the experiment, although some deviations are present for thin ( 4 nm) CuNi films. However, the discrepancy in the magnitude found above at affects, unavoidably, all the other angles.
Thus, the agreement between theory and experiment is in all aspects satisfactory except for the overall scale of the shifts, which is much too large in the theory. This is a puzzle, since for apparently much more difficult properties such as the shape of the curves in Fig. 4 and the main plot in Fig. 3, theory and experiment are in good agreement. One would think, a priori, that while the good detailed agreement in these quantities does not preclude discrepancies elsewhere, such discrepancies could not possibly be so large. We have also attempted to fit the data to the dirty limit case, using the methods of Ref. Fominov et al., 2003. In the dirty limit, the solution is mathematically much simpler and we are able to perform a best fit to the data using six fitting parameters. Despite obtaining in some cases unreasonable parameter values, the agreement with experiment for (the experimental data shown in the main plot of Fig. 3) is worse and so is the shape of the curves in the inset of Fig. 3 and in Fig. 4, particularly at smaller values of . Even then, the discrepancy as to the size of the effect remains just as large and in some cases even larger than in the clean limit calculation. So, the discrepancy can not be due to the samples being closer to the dirty limit than thought. This large discrepancy in the magnitude of between theoretical predictions and experiment has been noted before Gu et al. (2002); Potenza and Marrows (2005); Cadden-Zimansky et al. (2008) in other contexts.
It is natural to hypothesize that much larger surface scattering values, , and smaller coherence length, , leading to a diminished proximity effect, would drastically reduce . This is indeed so: we find that increasing and decreasing sufficiently leads to values of of the right order of magnitude, but then the dependence of the results on and is incorrect. A possible explanation is that something in the sample interfaces weakens the normal and Andreev scattering processes responsible for the proximity effect in such a way that only the overall scale of the amplitude of the phenomenon is changed, but we cannot speculate on what this could be.
In conclusion, we made measurements of the superconducting transition temperature in CuNi/Nb/CuNi trilayers as a function of the angle between the CuNi magnetic moments and the thickness of the CuNi layers. We found that is a monotonically increasing function of the angle between the magnetic moments of the CuNi layers. For thin ( 4 nm) CuNi layers, this function significantly deviates from a simple trigonometric function . The dependence of on the CuNi thickness and the functional form of the angular dependence of are reasonably well described by the proximity effect theory in the clean limit but the overall scale of the angular variation of given by the theory exceed the experimentally observed values by two orders of magnitude. Our measurements of the angular dependence of provide new experimental constraints on theories of the proximity effect in ferromagnet/superconductor heterostructures. This work was supported by NSF Grants DMR-0748810 and ECCS-1002358. K.H. is supported in part by ONR and by a grant of HPC resources as part of the DOD HPCMP.
References
- Bergeret et al. (2005) F. S. Bergeret, A. F. Volkov, and K. B. Efetov, Rev. Mod. Phys., 77, 1321 (2005).
- Buzdin (2005) A. I. Buzdin, Rev. Mod. Phys., 77, 935 (2005).
- Jiang et al. (1995) J. S. Jiang et al., Phys. Rev. Lett., 74, 314 (1995).
- Garifullin et al. (2002) I. A. Garifullin et al., Phys. Rev. B, 66, 020505(R) (2002).
- Blum et al. (2002) Y. Blum et al., Phys. Rev. Lett., 89, 187004 (2002).
- Gu et al. (2002) J. Y. Gu et al., Phys. Rev. Lett., 89, 267001 (2002).
- Tagirov (1999) L. R. Tagirov, Phys. Rev. Lett., 83, 2058 (1999).
- Leksin et al. (2010) P. V. Leksin et al., Appl. Phys. Lett., 97, 102505 (2010).
- Oh et al. (1997) S. Oh, D. Youm, and M. R. Beasley, Appl. Phys. Lett., 71, 2376 (1997).
- Bergeret et al. (2001) F. S. Bergeret, A. F. Volkov, and K. B. Efetov, Phys. Rev. Lett., 86, 4096 (2001).
- Kadigrobov (2001) A. Kadigrobov, Low Temp. Phys., 27, 760 (2001).
- Bergeret et al. (2003) F. S. Bergeret, A. F. Volkov, and K. B. Efetov, Phys. Rev. B, 68, 064513 (2003).
- Fominov et al. (2003) Y. Fominov, A. Golubov, and M. Kupriyanov, JETP Lett., 77, 510 (2003).
- Volkov et al. (2003) A. F. Volkov, F. S. Bergeret, and K. B. Efetov, Phys. Rev. Lett., 90, 117006 (2003).
- Halterman et al. (2007) K. Halterman, P. H. Barsic, and O. T. Valls, Phys. Rev. Lett., 99, 127002 (2007).
- Halterman et al. (2008) K. Halterman, O. T. Valls, and P. H. Barsic, Phys. Rev. B, 77, 174511 (2008).
- Bergeret et al. (2007) F. S. Bergeret, A. F. Volkov, and K. B. Efetov, Appl. Phys. A, 89, 599 (2007).
- Khaire et al. (2010) T. S. Khaire et al., Phys. Rev. Lett., 104, 137002 (2010).
- Potenza and Marrows (2005) A. Potenza and C. H. Marrows, Phys. Rev. B, 71, 180503 (2005).
- Moraru et al. (2006) I. C. Moraru, W. P. Pratt, Jr., and N. O. Birge, Phys. Rev. Lett., 96, 037004 (2006).
- Zhu et al. (2009) J. Zhu et al., Phys. Rev. Lett., 103, 027004 (2009).
- Nowak et al. (2008) G. Nowak et al., Phys. Rev. B, 78, 134520 (2008).
- (23) We assume that the pinned layer magnetization is fixed and that the free layer magnetization points in the direction of the applied field. This is a valid approximation because the external field (100 Oe) is much smaller than the exchange bias field (1 kOe) but much larger than the free layer anisotropy field (10 Oe). We verified via quantitative modeling that this approximation does not have a significant impact on the data in Fig. [2-4].
- de Gennes (1989) P. G. de Gennes, Superconductivity in Metals and Alloys (Addison-Wesley, Reading, Massachusetts, 1989).
- Barsic et al. (2007) P. H. Barsic, O. T. Valls, and K. Halterman, Phys. Rev. B, 75, 104502 (2007).
- Levin and Valls (1978) K. Levin and O. T. Valls, Phys. Rev. B, 17, 191 (1978).
- Allen and Dynes (1975) P. B. Allen and R. C. Dynes, Phys. Rev. B, 12, 905 (1975).
- Halterman and Valls (2005) K. Halterman and O. T. Valls, Phys. Rev. B, 72, 060514 (2005).
- Cadden-Zimansky et al. (2008) P. Cadden-Zimansky et al., Phys. Rev. B, 77, 184501 (2008).