Thresholds for epidemic spreading in networks
Abstract
We study the threshold of epidemic models in quenched networks with degree distribution given by a power-law. For the susceptible-infected-susceptible model the activity threshold vanishes in the large size limit on any network whose maximum degree diverges with the system size, at odds with heterogeneous mean-field (HMF) theory. The vanishing of the threshold has nothing to do with the scale-free nature of the network but stems instead from the largest hub in the system being active for any spreading rate and playing the role of a self-sustained source that spreads the infection to the rest of the system. The susceptible-infected-removed model displays instead agreement with HMF theory and a finite threshold for scale-rich networks. We conjecture that on quenched scale-rich networks the threshold of generic epidemic models is vanishing or finite depending on the presence or absence of a steady state.
pacs:
89.75.Hc, 05.70.Ln, 87.23.Ge, 89.75.DaThe heterogeneous pattern of a network can have dramatic effects on the behavior of dynamical processes running on top of it Barrat et al. (2008), in particular when the distribution of the number of contacts (the degree of an element or vertex) exhibits long tails, as expressed by a power-law degree probability with the asymptotic form Albert and Barabási (2002). An example that has attracted a great interest due to its practical real-world implications is the modeling of epidemic spreading on contact networks Keeling and Eames (2005). The simplest of these models is the SIS model Anderson and May (1992), in which each vertex (individual) can be in one of two states, either susceptible, or infected. Susceptibles become infected by contact with infected individuals, with a rate proportional to the number of infected contacts times a given spreading rate . Infected individuals on the other hand become healthy again with a rate that can be set arbitrarily equal to unity. The model allows thus individuals to contract the infection time and again, leading, in the infinite network size limit, to a sustained infected steady state for values of larger than an epidemic threshold . In the SIR model Anderson and May (1992), on the other hand, infected individuals recover (or die) and cannot change further their state. No steady state is now allowed, but a threshold still exists above which the total number of infected individuals, starting from a very small infected seed, reaches a finite fraction of the network. The analysis of these and other models Barrat et al. (2008), performed via a mean-field theory modified to take into account the heterogeneity of the network substrate Pastor-Satorras and Vespignani (2001); Dorogovtsev et al. (2008), led to the far-reaching conclusion that topological fluctuations, as measured by the second moment of the degree distribution , can have profound effects in many types of dynamics Dorogovtsev et al. (2008); Barrat et al. (2008). Thus, for example, in the SIS model, the threshold takes the values, at the mean-field level . For a long-tailed degree distribution with power law form, the second moment diverges for , and one obtains the remarkable result of a vanishing epidemic threshold in the thermodynamic limit. These results have led to the widespread belief in the distinction between scale-free networks with , where topology is highly relevant, and scale-rich networks with , where dynamical processes exhibit an essentially homogeneous mean-field behavior.
In this Letter, building on some results previously reported, we present evidence that this belief is not correct for the SIS model on quenched networks (i.e. networks whose adjacency matrix is fixed in time) and that the scale-free nature of the contact pattern has no crucial effect on the value of the epidemic threshold. We investigate the physical origin of this result, its validity for generic network structures and its consequences. On the other hand we show that for the SIR model the picture is different, a zero threshold occurring only in scale-free quenched networks.
While heterogeneous mean-field (HMF) theory is exact on annealed networks (i.e. networks whose adjacency matrix in fixed only in average Dorogovtsev et al. (2008)), results beyond HMF theory for the SIS process on quenched networks (QN) have appeared in different contexts and with various levels of rigor. Already in 2003, Wang et al. Wang et al. (2003) argued that the epidemic threshold on an arbitrary undirected graph is set by the largest eigenvalue of the adjacency matrix,
| (1) |
see also Gómez et al. (2010); Prakash et al. (2010). The relevance of Eq. (1) becomes evident when it is complemented with the results of Chung et al. Chung et al. (2003), who calculated the largest eigenvalue of the adjacency matrix for a class of finite graphs with degrees distributed according to a power-law, obtaining
| (2) |
where is the network size, is network cut-off or degree of the most connected node (averaged over many network realizations Restrepo et al. (2007)), and are constants of order 1. The cut-off is a growing function of the network size for uncorrelated scale-free networks, taking the value for and for Boguñá et al. (2004). For the ratio of the moments is finite and it is clear that the largest eigenvalue is governed by . Noticeably this remains true also for , since in that range . Only for the largest eigenvalue is set by the moments of the degree distribution. Combining Eqs. (1) and (2), the behavior of the threshold for the SIS model in a power-law distributed network is, for sufficiently large size,
| (3) |
see also Ganesh et al. (2005). Since grows as a function of for any , the consequence of Eq. (3) is remarkable: In any uncorrelated quenched random network with power-law distributed connectivities, the epidemic threshold for SIS goes to zero as the system size goes to infinity. This has nothing to do with the scale-free nature of the degree distribution: It is always true as long as the cut-off diverges. Remarkably the threshold goes to zero also for Erdös-Rényi graphs (although logarithmically slow), for which a formula similar to Eq. (2) exists Krivelevich and Sudakov (2003). Different approaches Ganesh et al. (2005); Chatterjee and Durrett (2009); Durrett (2010), have also pointed out that in the thermodynamic limit, the system is active for any . These results, however, have gone largely unnoticed within the statistical physics community.
A first issue raised by Eq. (3) concerns the fact that, as any critical point, the epidemic threshold is well defined only in the thermodynamic limit. In a finite system, the dynamics is always doomed to fall into the healthy, absorbing state, even far above the threshold, due to stochastic fluctuations. The threshold for a finite network of size must therefore be intended as the value separating the regime for which the epidemics decays exponentially fast (so that the expected survival time is of the order ) from the regime where the survival time grows exponentially with to some power, , with .
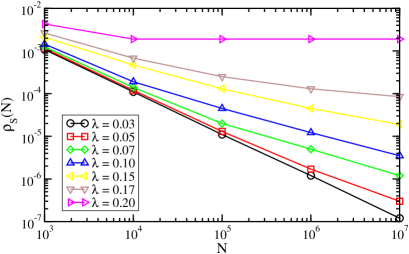
To investigate the validity of these results we have performed numerical simulations of the SIS model on quenched scale-rich networks with and minimum degree , built using the uncorrelated configuration model Catanzaro et al. (2005). In order to compare results with the predictions in Eq. (3) one must take into account that the actual maximum degree in each network realization is a random variable, with average value . In particular, in the case , one can see Kim and Motter (2007) that both the mean and the standard deviation of scale as , implying that always shows large fluctuations for different realizations of the degree sequence. Therefore, we first consider networks in which has a fixed value, equal to the mean numerically estimated for the chosen system size . In Fig. 1 we plot the density , calculated only for surviving runs, as a function of for different values of Marro and Dickman (1999). Should the transition occur at a fixed value of , would go to a constant for , decay exponentially for and as a power-law exactly at the transition. A completely different behavior is observed: for all values of , the curves are bent upward, indicating that the system is active for any . This excludes the presence of a finite threshold for diverging .
While Eq. (1) holds for SIS on any graph, Eq. (2) was instead obtained for a specific network model (intrinsically correlated for and uncorrelated for Boguñá et al. (2004)). For generic topologies, it is simple to show Restrepo et al. (2007) that is a lower bound for the largest eigenvalue of the adjacency matrix. This allows to conclude that, unless the degree distribution is strictly bounded from above, the threshold for SIS on any graph vanishes in the thermodynamic limit.
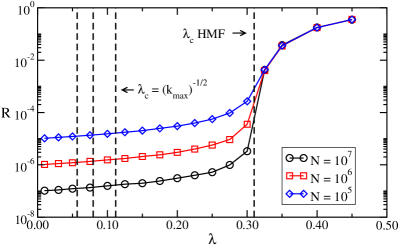
How generic are these results? Prakash et al. Prakash et al. (2010) have recently argued that Eq. (1) is valid for all epidemic processes, regardless of their particular microscopic details. To check this claim, we consider the SIR model. At the HMF level, the threshold takes the value Cohen et al. (2000); Newman (2002) and is therefore finite for scale-rich networks with . From the analysis in Eq. (3), on the other hand, it should be vanishingly small in the large network limit, according to Ref. Prakash et al. (2010). We have checked this possibility by performing numerical simulations of the SIR model on networks with and different values of , with fixed . In this case, the HMF estimated threshold takes the value , independent of the network size, while the predictions from Eq. (3) are , , and for the different network sizes considered. In Fig. 2 we report the final density of infected individuals as a function of the spreading rate , starting from a single randomly chosen infected node. The prediction of HMF theory seems in this case to be much more accurate than Eq. (3), contrary to the generic claim made in Ref. Prakash et al. (2010): The threshold remains finite in the large limit.
To understand the different behavior of the two models we look at the origin of the incorrect HMF prediction for SIS in QN. From a mathematical point of view, the HMF approach is equivalent Dorogovtsev et al. (2008) to replacing the QN with given adjacency matrix by an annealed network with an averaged adjacency matrix, Dorogovtsev et al. (2008); Boguñá et al. (2009). In the uncorrelated case this matrix reduces to , which has a unique nonzero eigenvalue . Hence the annealed network approximation destroys the detailed structure of the eigenvalue spectrum of QN and preserves the correct largest eigenvalue only for . This basic feature, and not (as suggested in Ref. Durrett (2010)) the disregard of dynamical correlations, is at root of the inaccuracy of the HMF approach. A more physical insight comes from the analysis of a star graph with one center connected to leaves of degree . In this case the largest eigenvalue of the adjacency matrix is which implies . The same result can be easily recovered by writing the rate equations for the probability () for the center (leaves) to be active, namely and . Imposing the steady state condition one finds
| (4) |
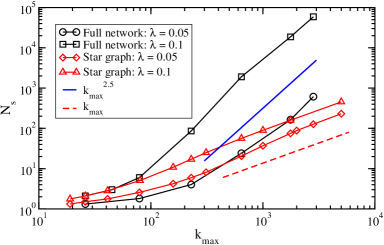
and hence the threshold condition above. The message of Eq. (4) for a generic quenched random graph is strong: Independently from all the rest of the system, for the subgraph composed by the node with degree and its neighbors is in the active state. This core of activity provides a self-sustained source of infection that, since in the full graph the neighbors of the hub are not leaves, can transfer the activity to their other neighbors and spread in this way the epidemics to a finite fraction of vertices. This is confirmed by Fig. 3, showing the number of actives nodes in surviving runs, , on a full network with and on a star graph with the same 111Analogous results are obtained for different values of (data not shown). For the values of in the full network and in the star graph are comparable: both systems are subcritical and the subgraph centered around the node with degree is where activity lingers before disappearing. For the star graph becomes active and becomes asymptotically proportional to . In the full network instead, the asymptotic behavior is , indicating that the active state is endemic: the hub spreads the activity to a finite fraction of the whole system. Reaching the the fully endemic state requires larger systems for small , but nothing changes qualitatively for any .
Understanding the behavior of SIS allows also to unravel why things go differently for SIR. In the former case, the possibility for hubs to be reinfected multiple times, which allows the presence of a steady state, boosts their impact on the dynamics. In the case of SIR, on the other hand, high-degree vertices can only be infected once and this strongly limits their role in the dynamics. Based on this observation, it is natural to conjecture that epidemic models allowing a steady state, such as SIS, will lead to a null threshold in any infinite QN, while all models without a steady-state will conform with HMF theory, with a finite threshold on scale-rich topologies.
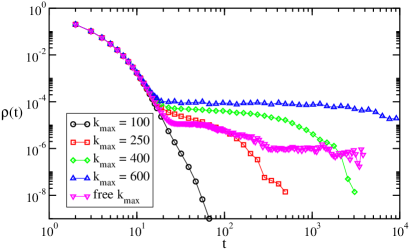
The strong effect of the hub in the dynamics raises further issues on the SIS model. While fixing the value of to its ensemble average leads to results consistent with the presence of a non-zero threshold in finite systems, as implied by Eq. (3), if this constraint is relaxed, has large sample to sample fluctuations leading to nontrivial consequences. In Fig. 4 we explore the effect of this variability by comparing simulations performed at fixed and , and different values of . The growth of the activity density for increasing indicates that the relation between the threshold (or the largest eigenvalue) and cut-off , Eq. (3), can in fact be refined, and be expressed in terms of the actual maximum degree, Kim and Motter (2007). However, the large variations of among different realizations of the network with the same and do not wash away as diverges and severely hinder the determination of the threshold in simulations with unrestricted . As mentioned before, for the standard deviation of increases as the average value Kim and Motter (2007), and there is always a large sample to sample variability. Hence an unrestricted sampling at fixed unwarrantedly averages networks with different thresholds and effective time scales, some subcritical and some supercritical, making impossible even to determine the presence of a well-defined steady state. This fact is exemplified in Fig. 4, where we plot for comparison the activity density obtained averaging over networks with a freely varying . For the situation depends on the way the network is generated, and in particular on the way the upper bound of the degree distribution grows Boguñá et al. (2009). If (uncorrelated configuration model Catanzaro et al. (2005)) or larger, the quantity becomes sharply peaked as grows Boguñá et al. (2009). If instead , as in the normal configuration model Molloy and Reed (1995), the ratio (and hence the threshold) wildly changes from realization to realization, with relative fluctuations diverging as Boguñá et al. (2009). Notice that in the intermediate region , the average value of is larger than but, since fluctuations of the latter diverge, for some network realizations the actual threshold is much smaller than the value predicted by Eq. (3). We conclude that, unless and , no average epidemic threshold can be properly defined from a numerical point of view for networks with unrestricted .
In summary, we have studied how the threshold for models of epidemic spreading on quenched scale-rich networks behaves as their size grows. The threshold for SIS model always vanishes in the thermodynamic limit, due to the role of hubs. This bears no relationship, at odds with the predictions of HMF theory, with the divergence of the second moment of the degree distribution, which is finite. For the SIR model instead the threshold vanishes only for scale-free topologies (either quenched or annealed), in agreement with HMF theory. We conjecture that these different types of behavior are generic for systems possessing (or not) a steady state. While the result of a vanishing threshold for SIS is exact on quenched networks, it is however of limited interest from an epidemiological perspective. The interaction patterns over which real diseases spread generally vary over short time scales Butts (2009), and are therefore better described by annealed topologies Dorogovtsev et al. (2008), for which HMF theory works by definition, and the threshold is finite for . From a statistical physics point of view, instead, our results open a promising path towards a better understanding of the scope and limits of HMF theory as a theoretical tool to analyze dynamics on heterogeneous networks.
Acknowledgements.
R.P.-S. acknowledges financial support from the Spanish MEC (FEDER), under projects No. FIS2007-66485-C02-01 and FIS2010-21781-C02-01; ICREA Academia, funded by the Generalitat de Catalunya; and the Junta de Andalucía, under project No. P09-FQM4682. We thank A. Vespignani and M. A. Muñoz for discussions.References
- Barrat et al. (2008) A. Barrat, M. Barthélemy, and A. Vespignani, Dynamical Processes on Complex Networks (Cambridge University Press, Cambridge, 2008).
- Albert and Barabási (2002) R. Albert and A.-L. Barabási, Rev. Mod. Phys. 74, 47 (2002).
- Keeling and Eames (2005) M. J. Keeling and K. T. D. Eames, J. R. Soc. Interface 2, 295 (2005).
- Anderson and May (1992) R. M. Anderson and R. M. May, Infectious diseases in humans (Oxford University Press, Oxford, 1992).
- Pastor-Satorras and Vespignani (2001) R. Pastor-Satorras and A. Vespignani, Phys. Rev. Lett. 86, 3200 (2001).
- Dorogovtsev et al. (2008) S. N. Dorogovtsev, A. V. Goltsev, and J. F. F. Mendes, Rev. Mod. Phys. 80, 1275 (2008).
- Wang et al. (2003) Y. Wang et al., in 22nd International Symposium on Reliable Distributed Systems (SRDS’03) (2003), pp. 25–34.
- Gómez et al. (2010) S. Gómez et al., Europhys. Lett. 89, 38009 (2010).
- Prakash et al. (2010) B. A. Prakash et al., Tech. Rep. arXiv:1004.0060 (2010).
- Chung et al. (2003) F. Chung, L. Lu, and V. Vu, Proc. Natl. Acad. Sci. USA 100, 6313 (2003).
- Restrepo et al. (2007) J. G. Restrepo, E. Ott, and B. R. Hunt, Phys. Rev. E 76, 056119 (2007).
- Boguñá et al. (2004) M. Boguñá, R. Pastor-Satorras, and A. Vespignani, Euro. Phys. J. B 38, 205 (2004).
- Ganesh et al. (2005) A. Ganesh, L. Massoulié, and D. Towsley, in IEEE INFOCOM (2005), pp. 1455–1466.
- Krivelevich and Sudakov (2003) M. Krivelevich and B. Sudakov, Combinatorics, Probability and Computing 12, 61 (2003).
- Chatterjee and Durrett (2009) S. Chatterjee and R. Durrett, Annals of Probability 37, 2332 (2009).
- Durrett (2010) R. Durrett, Proc. Natl. Acad. Sci. USA 107, 4491 (2010).
- Catanzaro et al. (2005) M. Catanzaro, M. Boguñá, and R. Pastor-Satorras, Phys. Rev. E 71, 027103 (2005).
- Kim and Motter (2007) D.-H. Kim and A. Motter, Phys. Rev. Lett. 98, 248701 (2007).
- Marro and Dickman (1999) J. Marro and R. Dickman, Nonequilibrium phase transitions in lattice models (Cambridge University Press, Cambridge, 1999).
- Cohen et al. (2000) R. Cohen et al., Phys. Rev. Lett. 85, 4626 (2000).
- Newman (2002) M. E. J. Newman, Phys. Rev. E 66, 016128 (2002).
- Boguñá et al. (2009) M. Boguñá, C. Castellano, and R. Pastor-Satorras, Phys. Rev. E 79, 036110 (2009).
- Molloy and Reed (1995) M. Molloy and B. Reed, Random Struct. Algorithms 6, 161 (1995).
- Butts (2009) C. T. Butts, Science 325, 414 (2009).