The Spitzer Survey of Stellar Structure in Galaxies (SG)
Abstract
The Spitzer Survey of Stellar Structure in Galaxies (SG) is an Exploration Science Legacy Program approved for the Spitzer post-cryogenic mission. It is a volume-, magnitude-, and size-limited (d40 Mpc, b 30, m15.5, D1) survey of 2,331 galaxies using the Infrared Array Camera (IRAC) at 3.6 and 4.5m. Each galaxy is observed for 240 s and mapped to 1.5D. The final mosaicked images have a typical 1 rms noise level of 0.0072 and 0.0093 MJy sr at 3.6 and 4.5m, respectively. Our azimuthally-averaged surface brightness profile typically traces isophotes at 27 mag arcsec, equivalent to a stellar mass surface density of 1 pc. SG thus provides an unprecedented data set for the study of the distribution of mass and stellar structures in the local Universe. This large, unbiased and extremely deep sample of all Hubble types from dwarfs to spirals to ellipticals will allow for detailed structural studies, not only as a function of stellar mass, but also as a function of the local environment. The data from this survey will serve as a vital testbed for cosmological simulations predicting the stellar mass properties of present-day galaxies. This paper introduces the survey, describes the sample selection, the significance of the 3.6 and 4.5m bands for this study, and the data collection & survey strategy. We describe the SG data analysis pipeline and present measurements for a first set of galaxies, observed in both the cryogenic and warm mission phase of Spitzer. For every galaxy we tabulate the galaxy diameter, position angle, axial ratio, inclination at = 25.5 and 26.5 mag arcsec (equivalent to =27.2 and 28.2 mag arcsec, respectively). These measurements will form the initial SG catalog of galaxy properties. We also measure the total magnitude and the azimuthally-averaged radial profiles of ellipticity, position angle, surface brightness and color. Finally, we deconstruct each galaxy using GALFIT into its main constituent stellar components: the bulge/spheroid, disk, bar, and nuclear point source, where necessary. Together these data products will provide a comprehensive and definitive catalog of stellar structures, mass and properties of galaxies in the nearby Universe and enable a variety of scientific investigations, some of which are highlighted in this introductory SG survey paper.
Subject headings:
galaxies: evolution — galaxies: formation — galaxies:structure1. Introduction
Understanding the distribution of stars within a galaxy is akin to the study of the endoskeleton of a body; embedded within the galaxy is the fossil record of the assembly history and evolutionary processes of cosmic time. The first step in unraveling this history is to obtain a complete census of the stellar structures in galaxies in the local volume. This is the primary motivation for the Spitzer Survey of Stellar Structures in Galaxies (SG). SG is a volume-limited (d 40 Mpc), size-limited (D1) and apparent B-band brightness (corrected for inclination, galactic extinction and K-correction) limited (m15.5) survey of 2,331 nearby galaxies at 3.6 and 4.5m with the Infrared Array Camera (IRAC) (Fazio et al., 2004) on the Spitzer Space Telescope (SSC) (Werner et al., 2004).
Over the last 70 years, numerous surveys have sought to create baseline data sets for nearby galaxies with as few as tens of galaxies (ANGST: Dalcanton et al. 2009; SINGS, Kennicutt et al. 2003) to tens of thousands of galaxies (e.g., RC3, de Vaucouleurs et al. 1991). While these surveys was designed specifically for particular scientific goals, none of them provides an accurate inventory of the stellar mass and the stellar structures in nearby galaxies. The main reason is that infrared surveys, where light from the old stellar population is better measured due to reduced dust extinction and contamination from star formation, are extremely difficult to conduct from the ground. The largest ground-based infrared surveys (e.g., 2MASS, Skrutskie et al. 2006; DENIS, Epchtein et al. 1994; Paturel et al. 2003) are rather shallow in depth, and as a result, studies of nearby galaxies have been restricted to high surface brightness inner disks. In contrast, deeper infrared surveys (e.g., OSUBGS, Eskridge et al. 2002, NIRSOS, Laurikainen et al. 2010) have imaged only a few hundred galaxies. SG is specifically designed to provide over an order of magnitude improvement in the sample size and several magnitudes deeper data than existing surveys.
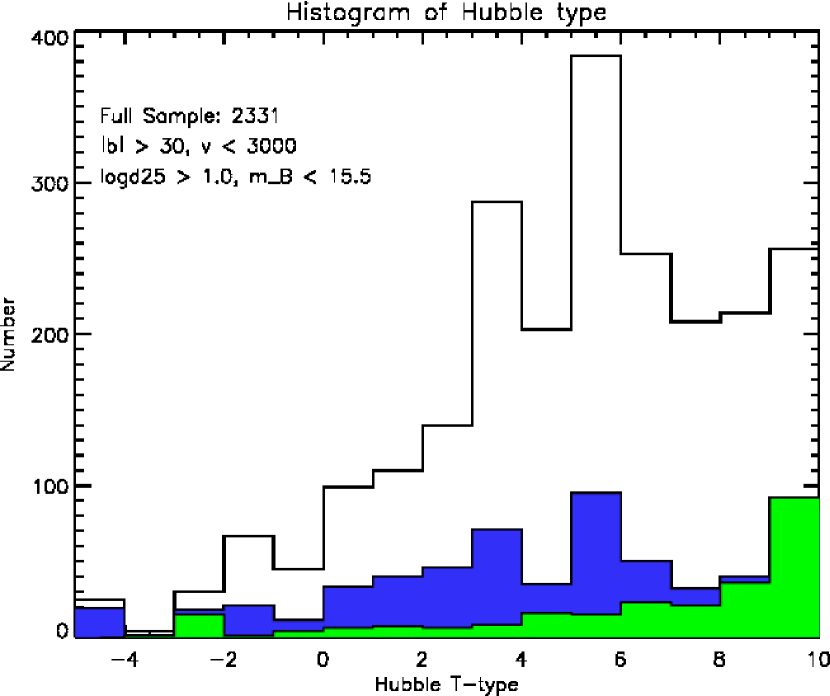
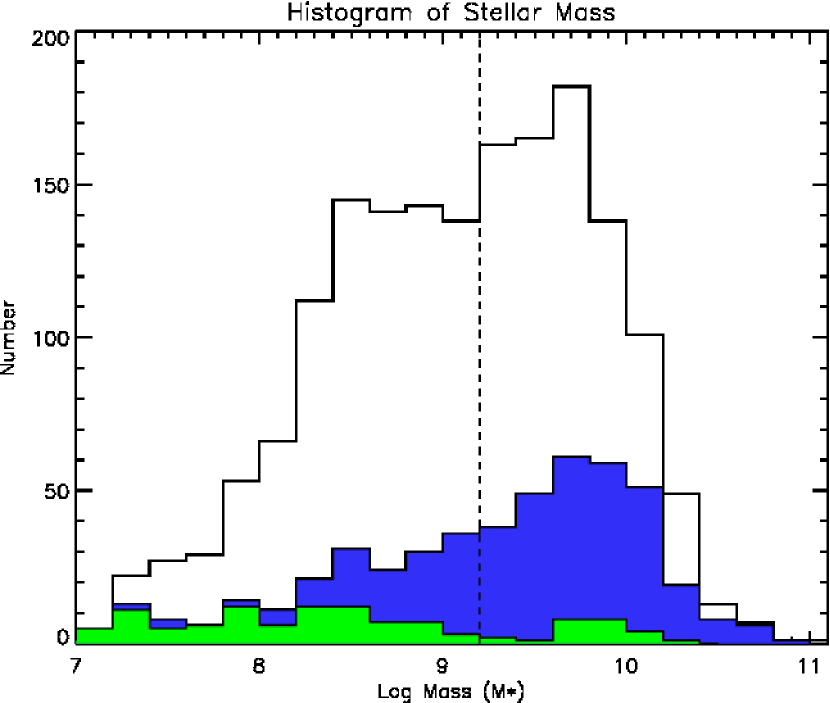
SG builds upon the two previous Spitzer Legacy surveys of nearby galaxies: SINGS (Kennicutt et al., 2003) and the Local Volume Legacy Survey (LVL) (Lee et al., 2008). SINGS was designed to probe star formation, dust and polycyclic aromatic hydrocarbon (PAH) emission in all representative environments within galaxies in a sample of 75 objects. The LVL survey was designed to study spatially-resolved star formation and the red stellar population within galaxies in a local volume of 11 Mpc. The local volume limits the 258 LVL galaxies to consist mostly of dwarf, irregular and late type systems (see green histogram in Fig. 1). The remainder of the Spitzer archive from the cryogenic mission is inadequate for the science goals outlined here because it lacks sufficient numbers of galaxies of all stellar masses, particularly at M 10 , Hubble types and environments. As shown in Figures 1 and 2, SG explores the full range of stellar structures in a representative and large sample of galaxies of all types, masses and in diverse environments. SG is designed to provide the ultimate baseline data set for the study of stellar structures and mass in nearby galaxies.
In this paper we introduce SG, describe the data collection and analysis strategy and briefly describe the variety of scientific investigations possible with these data. All SG galaxies are processed through a uniform pipeline to create the deepest and largest mid-infrared image catalog of nearby galaxies to date. For every galaxy we measure the magnitude and surface brightness and tabulate the galaxy diameter, position angle, axial ratio, and inclination at (AB) = 25.5 and 26.5 mag arcsec. We also compute the azimuthally-averaged radial profiles of ellipticity, position angle, surface brightness and color. This fundamental catalog of galaxy properties will allow us to classify their morphology based on their stellar structures – a preliminary study is presented in Buta et al. (2010). In the long term, the main goal of the SG project is to obtain a detailed understanding of the properties of the different stellar structures, their formation and evolutionary paths and their role in the broader picture of galaxy evolution. This will be done by decomposing every galaxy into its constituent structural components (e.g., bulge/spheroid, bar, disk, nuclear point source) using GALFIT (Peng et al., 2002, 2010).
A number of scientific studies are already under way by the SG team. These include a study of outer disks to determine the variety and frequency of different disk profile(s), truncations or thresholds and their relationship to the build up of galaxy disks, a study of shells and debris around galaxies and their relationship to central star formation or AGN activity, an analysis of the structural properties of bulges/spheroids (classical, disky, boxy/peanut-shaped), determination of the bar fraction and bar properties in relationship to the host galaxies and environment, an analysis of the stellar arm-interarm variations in spirals, an investigation of the underlying old stellar population in rings and a search for fossil rings, an analysis of the old stellar content of dwarf galaxies and its implication for their formation history, etc. Longer term studies include star formation history and assembly of galaxies using GALEX and H data, the Tully–Fisher relationship using existing HI data (e.g., ALFALFA, Giovanelli et al. 2005, HIPASS, Barnes et al. 2001), and testing of new mid-infrared diagnostics of AGN. We describe these studies in more detail in §6. Ultimately, SG will lead to numerous other studies of astrophysical phenomena in the nearby Universe and provide a key anchoring data set for studies of galaxy evolution.
2. The Spitzer 3.6 and 4.5m Bands: Best Tracers of Stellar Mass
The 3.6 and 4.5m IRAC bands on Spitzer are ideal tracers of the stellar mass distribution in galaxies because they image the Rayleigh–Jeans limit of the blackbody emission for stars with T 2000 K. Moreover, the mid-infrared [3.6]–[4.5] color in nearby galaxies is nearly constant with radius, and independent of the age of the stellar population and its mass function (Pahre et al., 2004). Analysis of the tilt in the fundamental plane for ellipticals shows that the Spitzer IRAC bands are better tracers of the stellar mass than even K-band emission, which is more sensitive to variations in the underlying stellar population; the IRAC data are more uniform and therefore are the best and perhaps most direct tracers of stellar mass (Jun & Im, 2008). Additionally, on Spitzer these bands are so sensitive that SG will image to extremely low stellar mass surface densities ( 1pc).
There are minor contaminants to the old stellar population light in the 3.6 and 4.5m IRAC bands. In the 3.6m band, there is a very weak 3.3m PAH feature, which contributes negligibly to the overall emission in the band ( 2% as the equivalent width is 0.02m, Tokunaga et al. 1991). Hot dust (T500K) from very small grains can contribute light to both bands with a higher contribution in the 4.5m band, but this condition occurs only near active galactic nuclei or extreme starbursts. By examining the colors of the galaxies, we should be able to use the two IRAC bands to remove the effects of the 3.3m PAH or hot dust emission. Another important advantage of having 2 bands is that by co-adding them, we can further improve the signal to noise and push the study to even fainter regions of the galaxies. In both bands, the contamination from young red supergiants is also very low. From previous studies, it is known that in the near-infrared, the overall contamination from young red supergiants to a galaxy is only 3% but in regions of star formation, the contribution may be as high as 25% (Rhoads, 1998). These regions, however, are easily identifiable and can be flagged. At the IRAC wavelengths, the fractional contribution from star-forming regions is expected to be the same (or lower) because these wavebands are at longer wavelengths on the Rayleigh–Jeans tail of the spectral energy distribution. At these wavelengths, there is lower dust extinction (Draine & Lee, 1984) and no other significant emission sources. Thus, with the extremely low surface brightness limits, SG offers a unique and virtually dust-free view of the distribution of mass in stellar structure in the nearby Universe.
Although ground-based near-infrared observations can offer higher angular resolution than Spitzer, the main obstacle for ground-based observations is the very high and variable sky brightness (typically 13.4 mag arcsec). The surface brightness level in the IRAC data is over 10 magnitudes below the typical sky brightness level. To get to this level from the ground, one would need to characterize the sky brightness, the flat field and instrumental variations to better than 0.0009%. This is currently not possible with any existing (or planned) near-infrared survey. Surveys like UKIDSS LAS or VISTA VHS are planning to reach a depth of 18.4 (21.2 in AB) mag arcsec in the K band, which translates to 30 pc (even with the brighter stellar emission at K band), whereas SG reaches 2 pc . It is the stability of the background that is the biggest advantage for space-based observations.
3. Sample Selection
We chose all galaxies with radial velocity V 3000 km/s (corresponding to a distance d 40 Mpc for a Hubble constant of 75 km/s/Mpc), total corrected blue magnitude m 15.5, blue light isophotal angular diameter D 1.0 arcmin at galactic latitude b 30 using HyperLEDA (Paturel et al., 2003). The choice of V does limit the sample to galaxies with a radio-derived (e.g., HI) radial velocities in HyperLEDA, and as a result misses some galaxies for which only optically-derived radial velocities exists; currently, a sample chosen with V instead of V would contain 2997 galaxies. A comparison of the galaxy properties of the two samples shows that the SG sample misses galaxies that are small, relatively faint and early-type (gas-poor) systems from the volume surveyed.
We also note that our sample was defined using HyperLEDA in September 2007 - since then 98 more galaxies have been added to the HyperLEDA data base that meet the SG criteria described above and we expect that some more may be added as better data become available. Given the limited lifetime of Spitzer, we are unable to go back and acquire data on these additional galaxies but we expect that the few percent additional galaxies will not strongly influence the core characteristics of the sample, except for the bias against early-type galaxies as noted above.
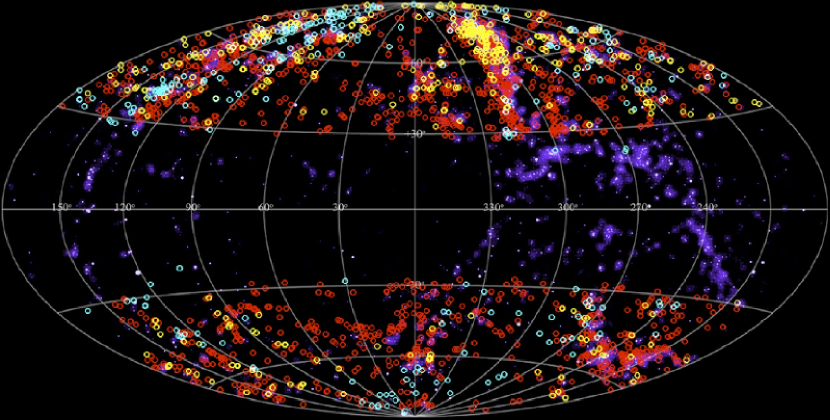
The choice of a 40 Mpc volume is arbitrary – it was chosen to be large enough to provide a statistically significant number of galaxies of all types and to be representative of a large range of the local large scale structure environment (as shown in Fig. 2). Our experience with previous surveys of galaxy properties (e.g., Sheth et al. 2008) has shown that a few thousand galaxies are needed to accurately measure and account for completeness effects in mass, color and size selection of galaxy samples for robust investigations of relationships between galactic structure and host galaxy properties. The size cut, log D 1.0, was made to ensure that galaxies were large enough for a detailed study of their internal structure (at 40 Mpc, 111.6 kpc). The apparent size and apparent magnitude cut were chosen to match the RC3 limits. The galactic latitude cut, b 30, was used to minimize the unresolved Galactic light contribution from the Milky Way disk. The full sample of 2,331 SG galaxies is listed in Table 1. In Figure 1, we show the distribution of SG galaxies as a function of Hubble type and stellar mass, along with the existing distribution of the LVL galaxies (green) and GO/GTO galaxies (blue) including the SINGS galaxies. There are some noteworthy sub-samples within SG . There are 188 early-type galaxies (ellipticals and lenticulars), 206 dwarf galaxies (defined as M -17), of which 135 are DDO dwarfs and 465 edge-on ( 75) systems. Also over 800 of the SG galaxies are mapped beyond a diameter of 3D. These sub-samples provide the deepest, largest and most homogeneous samples for a multitude of galaxy evolutionary studies, some of which are described in §6.
3.1. Archival / Cryogenic Spitzer Data
Of the 2,331 galaxies in the SG sample, 597 had some existing data at 3.6 and 4.5m from the Spitzer cryogenic mission. 125 of these are part of the LVL survey and 56 are from the SINGS survey, both of which used the same observing strategy (§4) we employ for SG . Almost all of the archival maps have at least 240 s of integration time per pixel and are sufficiently deep. The only exceptions are NGC 5457 (96s), NGC 0470, NGC 0474 (150s), and NGC 5218, NGC 5216, and NGC 5576 (192s).
In terms of area, 82 of the archival galaxies were mapped between 1.0 and 1.5D, and 43 others were mapped to 1.0 D. While outer disk science for these 125 galaxies would benefit from an extended map, they represent only a small fraction of the total sample, and the repetition of observations would have yielded only an incremental scientific return. Therefore, we decided not to repeat observations of any of the archival galaxies. We also decided not to map the SMC and the LMC, which meet our selection criteria but are very large and are being observed as part of other GO programs. M33, the other commonly studied Local Group galaxy was observed during the cryogenic mission and is included in the archival part of our sample. All other galaxies that were found via the HyperLEDA data base search in 2007 September are observed (see note earlier about the modest additions to the HyperLEDA database in the last three years). Although we do not repeat observations of any of the archival galaxies, we are processing all galaxies in the SG sample, except the SMC and LMC, through the same SG reduction and analysis pipelines described in §5.
4. Spitzer Post-Cryogenic Mission Observations Strategy
The 1,734 SG galaxies being observed in the post-cryogenic mission are mapped using either a small dithered map or a mosaicked observation with both IRAC channels. All galaxies are observed with a total on-source integration time of 240 s which leads to an rms noise of (1) 0.0072 and 0.0093 MJy sr at 3.6 and 4.5m, respectively. This translates to a typical surface brightness sensitivity of 27 mag arcsec or a stellar surface density of 1.13 pc (assuming a solar M = 3.33, Worthey 1994; M/L=1, Heraudeau & Simien 1997) .
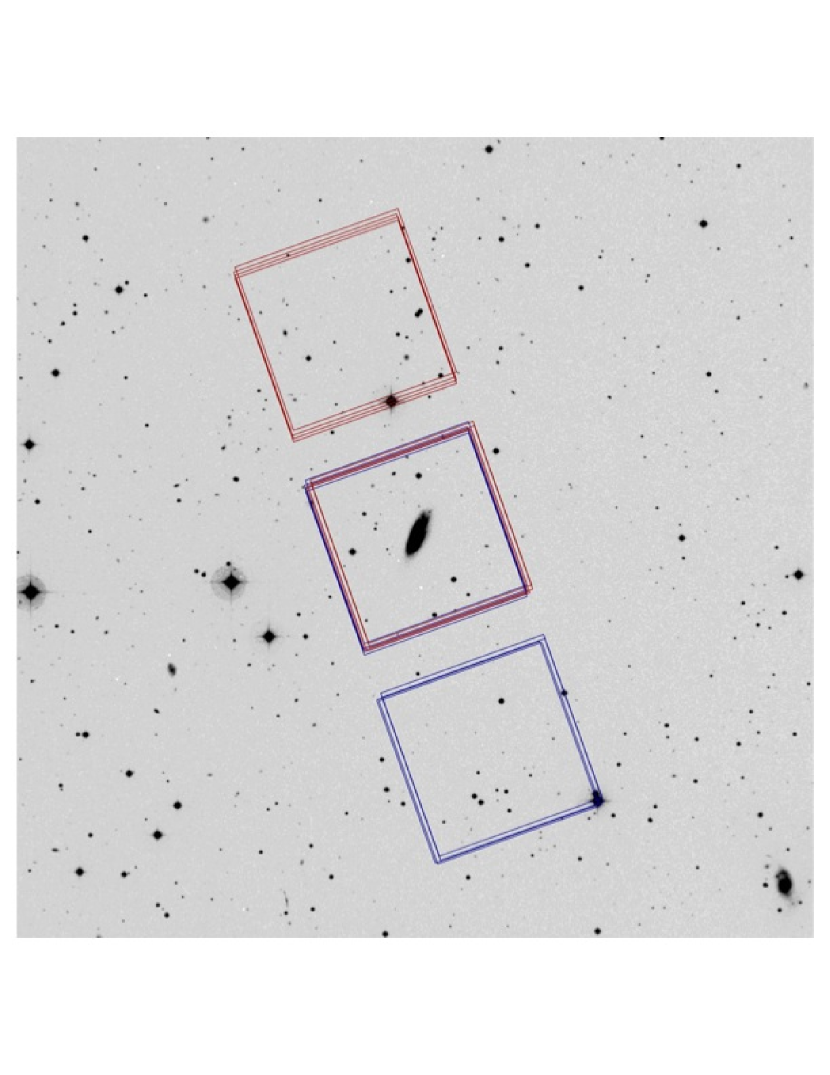
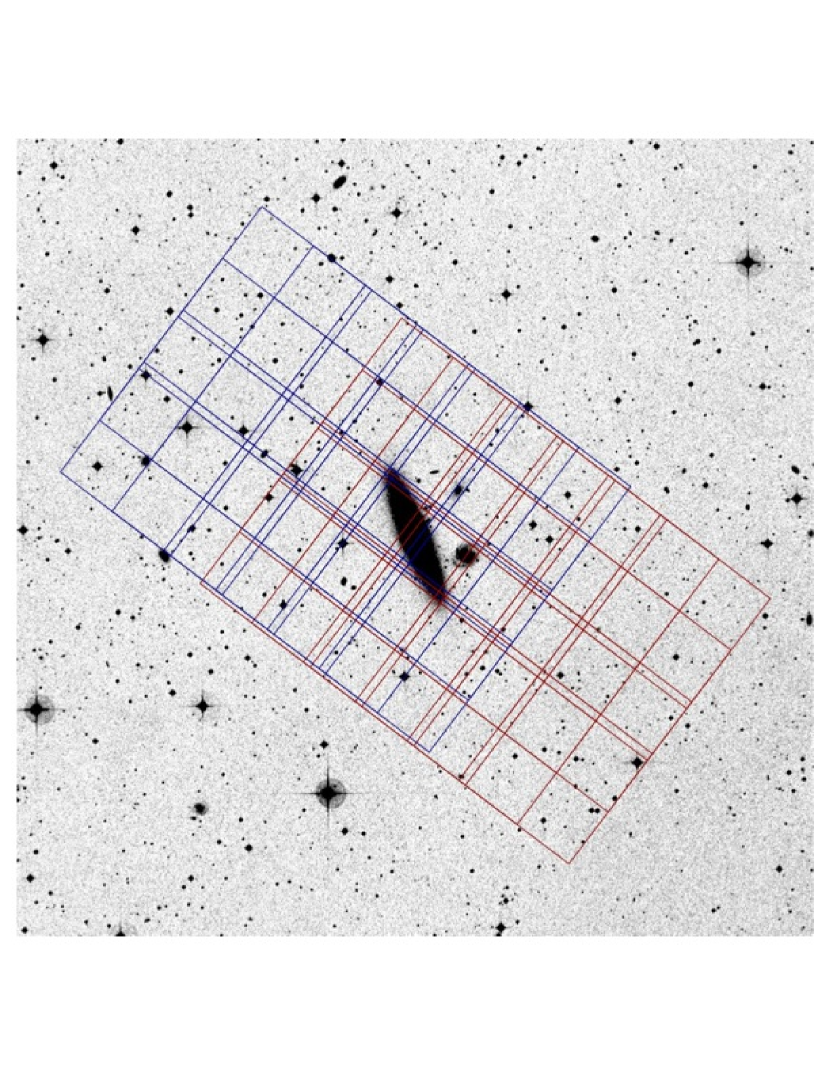
1560 of the new observations are of galaxies with D 3.3. We can map these galaxies to 1.5D with a single pointing because the Spitzer field of view is 5. Hence all of these galaxies are mapped using a standard cycling small dither pattern with 4 exposures of 30s each in two separate Astronomical Observation Requests (AORs). Each pair of AORs is separated by at least 30 days to allow for sufficient rotation of the telescope so that the galaxy is imaged at two distinct orientations. Two AORs allow us to better remove cosmic rays, and the redundant information gathered by the two visits allows us to characterize and remove image artifacts (e.g., muxbleed, column pulldown, etc (see the IRAC Instrument Handbook111 See http://ssc.spitzer.caltech.edu/irac/iracinstrumenthandbook/) and possible asteroids. Drizzling the data from the two visits also allows us to achieve sub-pixel sampling with which we can reconstruct images with better fidelity than would be possible from a single visit. We also note that since both the 3.6 and 4.5m arrays collect data simultaneously, their offset placement in the Spitzer focal plane means that an additional flanking map is made adjacent to the galaxy in each of the two channels (in some cases, the flanking field from each of the AORs may not overlap exactly due to the telescope rotation, but this does not affect the observations of the main galaxy). An example of a typical dithering AOR is shown in the left panel in Figure 3.
One of the considerations in designing these AORs was the effect of saturation from bright stars on the chip and the scattered light from bright stars falling in one of the three scattering zones surrounding the arrays222A description of this problem is given in the IRAC instrument handbook at: .http://ssc.spitzer.caltech.edu/irac/iracinstrumenthandbook/. Stars brighter than 5th magnitude can leave a latent charge on the chip. Stars brighter than 11th magnitude in the scattering zones may scatter light into the main field of view of the IRAC chips. To mitigate these cases, we used the Spitzer Observing Tool (SPOT333http://ssc.spitzer.caltech.edu/warmmission/propkit/spot/) to examine every galaxy with a star, m 8 (stars fainter than m = 8 do not contribute significantly to the background) within an area of 300, covering the IRAC field of view and scattering zones adequately, for all possible visibility windows through 2011. In a majority of these cases, no modifications of AORs were needed because the offending star(s) fell out of the chip or the scattering zones. In the remaining cases, we constructed AORs with timing constraints, slightly offset pointings or used medium dithers or mosaics to reduce the effect of the bright stars.
For galaxies with D 3.3, we mosaic them in array coordinates with offsets of 146.6 with 30s integrations at each location to create a map 1.5D. This leads to a map with each pixel observed four times at all wavelengths in the core of the map. In addition, on each side of the galaxy there will be a region where each pixel is observed twice but only in one of the two channels. Like the dithered AORs, each mosaic is observed twice but with only a follow-on constraint so that each mosaic overlaps the other closely. An example of this type of an AOR is shown in the right panel of Figure 3.
Although larger mosaics could be made, our experience with SINGS data showed that the dominant noise term comes from variations of the background (Regan & Teuben, 2004; Regan et al., 2006). The best background for a galaxy includes sufficient sky not far from the area of interest. Our map sizes are thus fine-tuned to achieve the best possible signal-to-noise for all galaxies.
5. The SG Pipeline
The SG pipeline is divided into four distinct parts, which we refer to as Pipelines 1, 2, 3 and 4. Pipeline 1 takes the raw basic calibrated data (BCD) fits files and converts them to science-ready data. Pipeline 2 creates a mask for the foreground and background objects for each of the individual galaxies. Pipeline 3 measures the standard global galaxy properties such as size, axial ratio, magnitude, color, etc. and computes the radial profiles of the standard properties. Pipeline 4 deconstructs each galaxy into its major structural components. Each of these is described in detail here.
5.1. SG Pipeline 1
The purpose of pipeline 1 (P1) is to create science-ready mosaics from the two visits of each target. To do this P1 performs two major steps. First, it matches the background level in the individual images to account for drifts in the zero point of the amplifiers. Second, it creates the final mosaic using the Drizzle package of IRAF444IRAF is distributed by the National Optical Astronomy Observatories, which are operated by the Association of Universities for Research in Astronomy, Inc., under cooperative agreement with the National Science Foundation..
To match the background levels in the individual images we find the regions of overlap between all pairs of overlapping images. Typically we require that the overlap region contain 20000 pixels. For all of the new post-cryogenic mission observations (and archival observations that used the same observing strategies), such an overlap is always available. However, when reducing other archival data with less overlap between the frames, we reduce the number of pixels in the overlap region to as low as 5000 pixels – this still provides an adequate number of pixels for estimating the background.
Within these regions we determine the brightness level of the 20th percentile pixel. We use the 20th percentile brightness level to better avoid detector artifacts such as muxbleed which can affect even the median. By using the 20th percentile brightness level we have a better chance of using the true sky level. We then perform a least square solution using the brightness differences between all the pairs of overlapping images, minimizing the residual background difference. Since we use the difference, we need to use the background level in the first image to set the zero point of the solution. We then make corrected images by adding the solved-for corrections and use these images in the formation of the final mosaic. We create the final mosaic following the standard prescription of the STSDAS DITHER package. This method removes the cosmic rays by first forming a mosaic from a median combination of the images and then comparing the individual images to the median mosaic and flagging any cosmic rays. The final mosaic is formed by drizzling the individual images. The resulting mosaic has a pixel scale of 0.75 and we correct for the change in pixel size to keep the units of MJy sr.
The relative astrometry of the mosaicked images is excellent because the Spitzer pipeline already incorporates the 2MASS positions to update its astrometry for each of the basic calibrated data frames. The SG pipeline therefore does not require the type of cross-correlation that was needed previously for the SINGS pipeline to align overlapping fields. The relative astrometric accuracy is 01.
The point spread function for IRAC is asymmetric and depends on the spacecraft orientation angle. Pipeline 1 images are produced by combining two different visits to the galaxy and therefore we estimate the PSF by combining stars in the foreground and background for six typical SG galaxies to create a ”super”-PSF which has a typical FWHM of 17 and 16 at 3.6m and 4.5m respectively. For the most distant galaxies in our survey at a distance of 40Mpc, this resolution corresponds to a linear scale of 300pc. At the median distance of the galaxies in this survey at 21.6 Mpc, this corresponds to a linear scale of 170pc.
5.2. SG Pipeline 2
After the science-ready images are produced by the SG pipeline, we generate masks for point sources using SExtractor (Bertin & Arnouts, 1996) for both channels. Each mask is checked by eye and iterated to identify any point source otherwise missed by SExtractor. We also unmask any region of the galaxy that may be have been incorrectly identified by SExtractor. The images with their corresponding masks are then run through the third part of the SG pipeline (Pipeline 3, P3 hereafter).
5.3. SG Pipeline 3
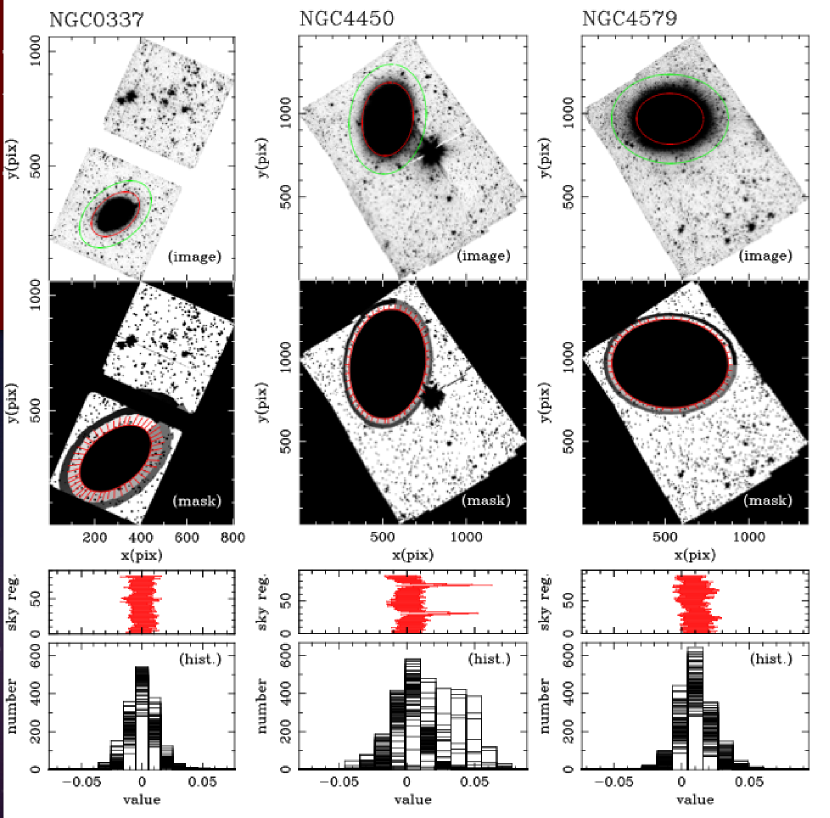
The first step in P3 is to determine the local sky level around each galaxy. We want to be sufficiently far from the galaxy to ensure that there is no contamination from the galaxy but not so far that the background is not truly local. We do this by computing the median sky value in two concentric elliptical annuli centered at the position of the galaxy. Typically we start the inner annulus at a distance of 1.5D. This annulus is divided in azimuth into 45 regions (or sky boxes). Each of these regions is then grown outwards until it encompasses a total of 4000 non-masked pixels555For archival galaxies that fill the mosaicked frame, this requirement is reduced to 1000 non-masked pixels., as shown in Figure 4. The second annulus begins at the end of the first annulus and the same process is repeated. We compare the measured sky values in the two annuli for any radial gradients which might be indicative of light contamination from the galaxy. If we find that there is contamination, then we move the inner radius outwards and repeat the process until we are assured that we are sampling the local sky.
In our analysis so far, the inner radius of the inner annulus has varied between 1.2 and 2D. In all cases for the warm mission data and a majority of the archival data, it has been sufficent to set the inner radius of the annulus to either 1.5 or 2 D. However in a few cases where the archival data are shallow and the galaxy is relatively blue, we moved the inner radius to 1.2 D to be immediately outside the galaxy to get as accurate a measurement possible for the local sky level. Automating this procedure is non-trivial because variations at these faint levels (27 (AB) mag arcsec) can be from a lopsided galaxy, debris or tidal structures, or variation in the background. Therefore we examine every galaxy by eye to ensure that contamination from the galaxy light to the measurement of the sky background is as low as possible and move the radii outwards as needed.
The sky background computation method for three of the galaxies in the SG sample (NGC 0337, NGC 4450, NGC 4579) is shown in Figure 4. In the central column of this figure, we show an example case for NGC 4450 where the median sky in some of the boxes is affected by the bleeding of flux from a (masked) but saturated nearby bright field star. In such cases we ignore the affected pixels or move the annuli further out to get the best estimate for the background. Finally, we use the standard deviation obtained from the 90 sky boxes with the average standard deviation within each box to estimate the contribution of the low-frequency flat-fielding errors and possible additions to the total error budget in the background determination.
The typical sky brightness level is fainter than 26 (AB) mag arcsec at 3.6 and 4.5 . The Poisson noise from the galaxy dominates the total error budget in the central regions, while errors in the sky background are the main source of uncertainty in the outer parts. Large-scale background errors can be particularly significant in galaxies with large apparent sizes. However, in the fainter outer parts, the noise is significantly reduced from azimuthally averaging over a large number of pixels in the outer galaxy – we are therefore able to measure the galaxy profiles well below the typical sky brightness. The typical S/N for a SG galaxy at the canonical = 26.5 (AB) mag arcsec is 3.
The images resulting from Pipeline 1 are calibrated in units of MJy sr. The conversion from MJy sr to AB magnitudes is such that the zero-point to convert fluxes in Jy to magnitudes does not vary with wavelength (Oke, 1974):
| (1) |
From this definition one can derive the corresponding expression for surface brightness:
| (2) |
5.3.1 P3: Measuring the Galaxy Host Properties
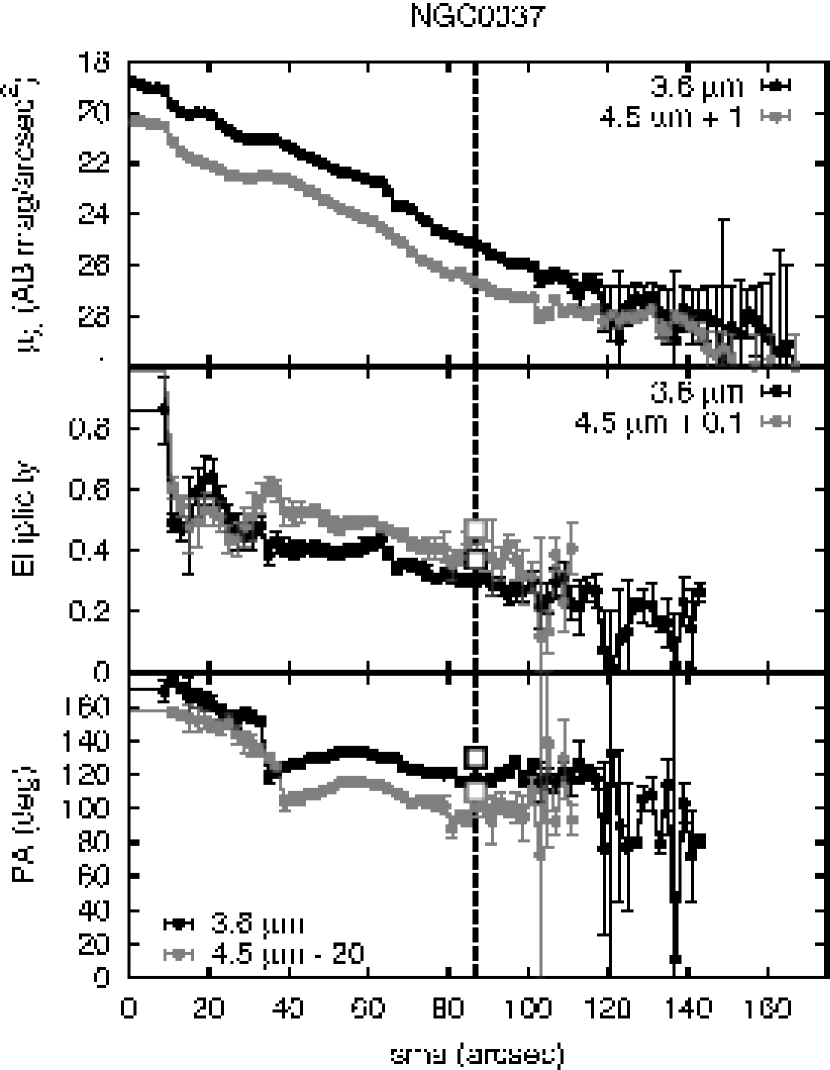
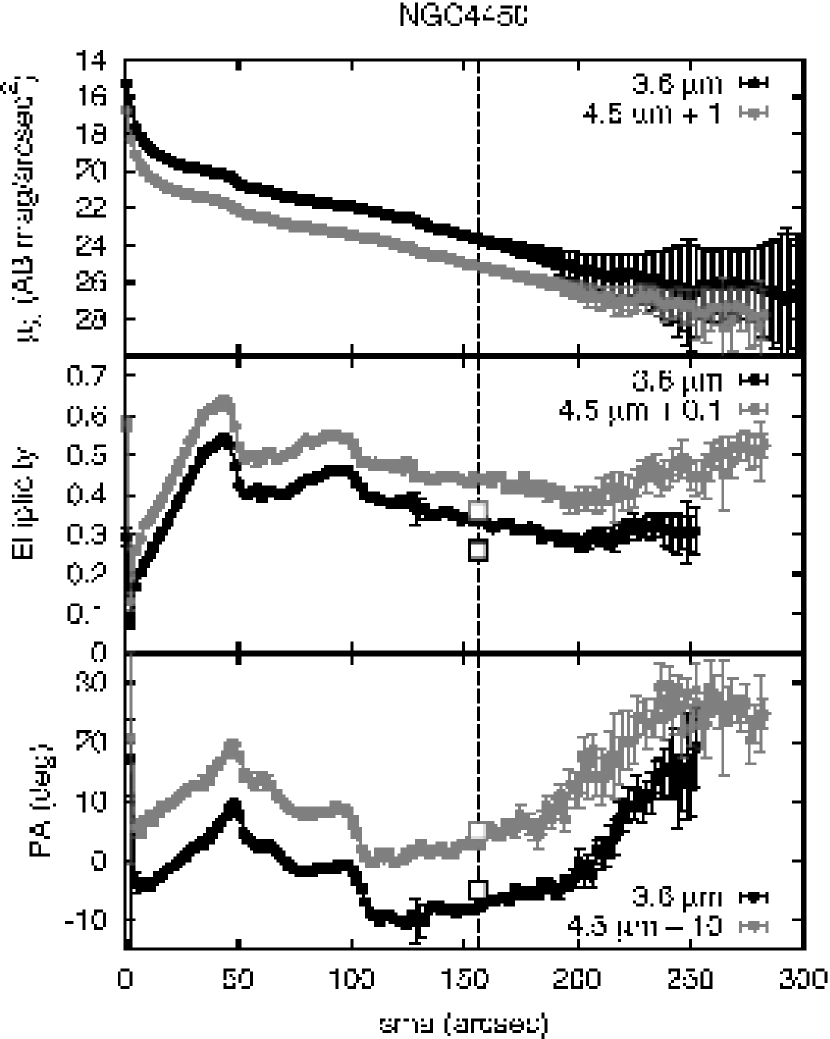
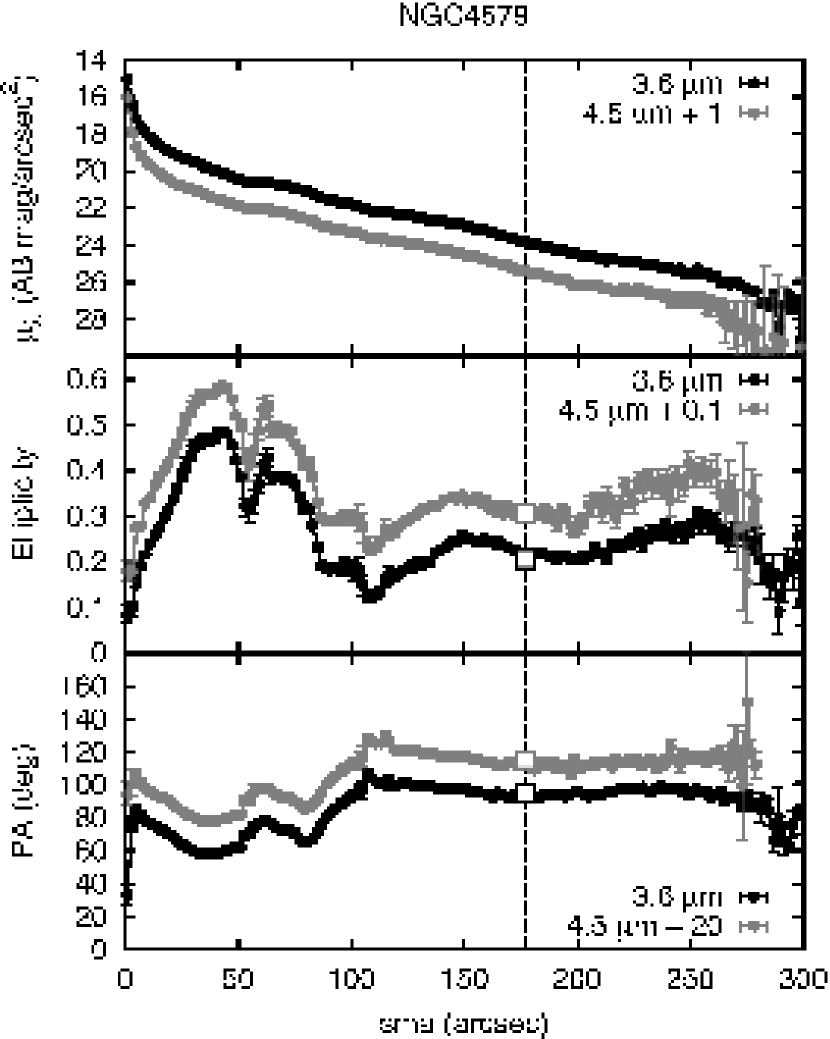
After the sky level has been properly measured, we use the IRAF routine ellipse to determine the radial profiles of intensity, surface brightness, ellipticity and position angle for all galaxies in both bands. The center is determined using imcenter and kept fixed during the fit, whereas the ellipticity and position angle are left as free parameters. We generate profiles with two different radial resolutions, by incrementing the semi-major axis in and at each step, respectively. The latter profiles have a coarser resolution and a better S/N ratio - these are used to measure the RC3-like parameters. The low- and high-frequency sky background errors described above, together with the Poisson noise of the source along each isophote, are considered together in the final error budget of the surface photometry at each radius (see Gil de Paz et al. 2005; Muñoz-Mateos et al. 2009). The errors in the position angle and ellipticity at each radius are computed by the ellipse task from the rms of the pixel values along each fitted isophote. The corresponding errors for the values of these geometrical parameters at 25.5 and 26.5 (AB) mag arcsec are interpolated between the corresponding adjacent values. The error in the semi-major axis is computed from the change in the radius affected by moving the surface brightness profile by the measured errors and an additional 10% error added in quadrature to the measured errors. The 10% error is an estimate of the aperture correction uncertainty as estimated by the Spitzer Science Center instrument team. We compute the error in the semi-major axis for each galaxy. Sample results for NGC 0337 and NGC 4579 are noted below. For NGC 4450, the scattered light from a background star strongly affects the computation of the surface brightness error and therefore the error in the semi-major axis that is unrealistic. In such cases, the error in the semi-major axis can be assumed to be the median semi-major axis error in the SG sample. The maximum error in the determination of the semi-major axis is 6, the step size of the coarse resolution fitting procedure. In Figures 5, 6 and 7 we show three sample sets of profiles for three galaxies in the sample: NGC 0337 (SBd), NGC 4450 (SAab) and NGC 4579 (SABb). The basic RC3-like galaxy properties (semi-major axis, axial ratio and position angle) are tabulated at the levels of 25.5 and 26.5 (AB) mag arcsec in both the 3.6m and the 4.5m images, and are quoted in Table LABEL:RC3_tab.
Along with the surface photometry we also measure the curve of growth (e.g., Muñoz-Mateos et al. 2009; Gil de Paz et al. 2007) with the integrated flux up to each radius. By fitting the accumulated magnitude as a function of the magnitude gradient at each point we obtain the asymptotic magnitude as the y-intercept of that fit (see Gil de Paz et al. 2007). Once the total magnitude is known, it is straightforward to locate the radii containing a given percentage of the total galaxy luminosity, from which concentration indices can be determined. In Table LABEL:mag_tab we quote the asymptotic magnitudes of the three sample galaxies considered here, together with the (de Vaucouleurs et al., 1977) and (Kent, 1985) concentration indices.
5.4. SG Pipeline 4
In Pipeline 4, we decompose the two-dimensional stellar distribution in each galaxy into different sub-components using the version 3 of GALFIT (Peng et al., 2002, 2010). GALFIT is a parametric fitting algorithm that offers a large flexibility on the fitted models; the optimal solution for the model parameters is found with the Levenberg-Marquardt algorithm, performing non-linear least-squares minimization of the difference between observed and model images. For our pipeline, we could have also used BUDDA (Gadotti, 2008) and BDBAR (Laurikainen et al., 2005). We tested all three algorithms using a set of galaxy images and verified that GALFIT produces the same results as BUDDA and BDBAR if the three codes are run with the same set of input images, models and initial parameters. We chose GALFIT because it is currently the most sophisticated algorithm, and also well known by a large portion of the astronomical community. Other studies in which software was developed for similar purposes include Simard (1998); Pignatelli et al. (2006); Méndez-Abreu et al. (2008).
To simplify the use of GALFIT for a large number of cases, a set of new IDL-based tools have been created (“GALFIDL”). They include automatic creation of the input files for decompositions, containing reasonable first guesses for the initial parameters based on P3 products, as well as routines for running and visualizing the decompositions. GALFIDL will be available to the community concurrently with the publication of the data and the GALFIT analyses; an overview of these procedures is already available at http://cc.oulu.fi/hsalo/galfidl.html.
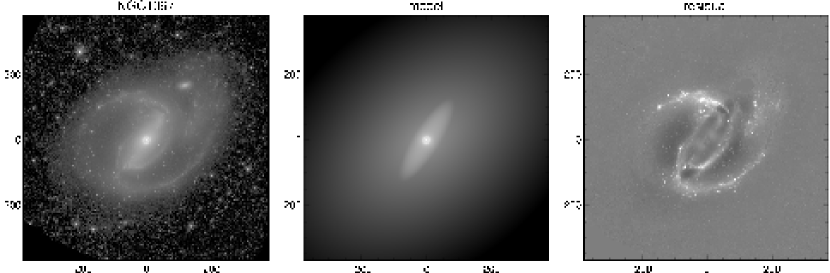
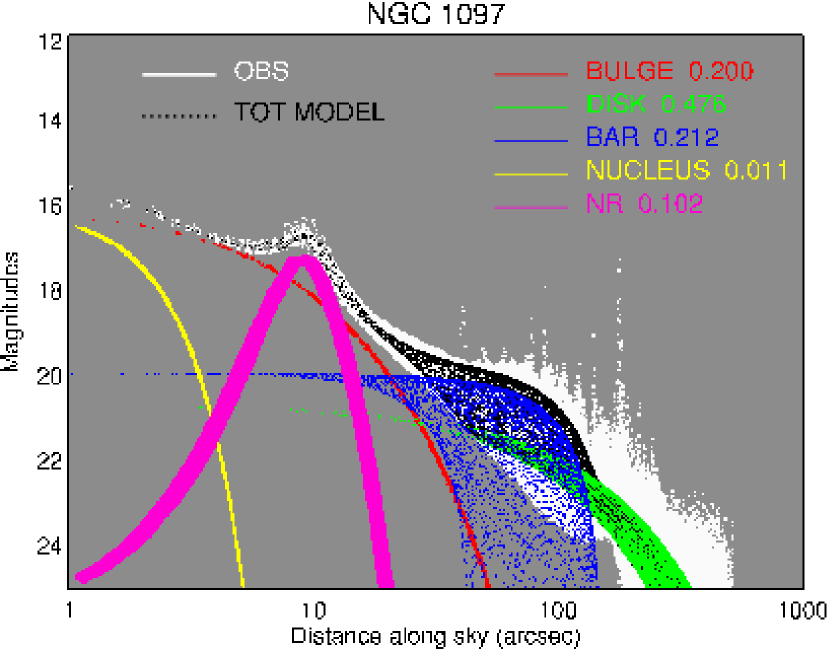
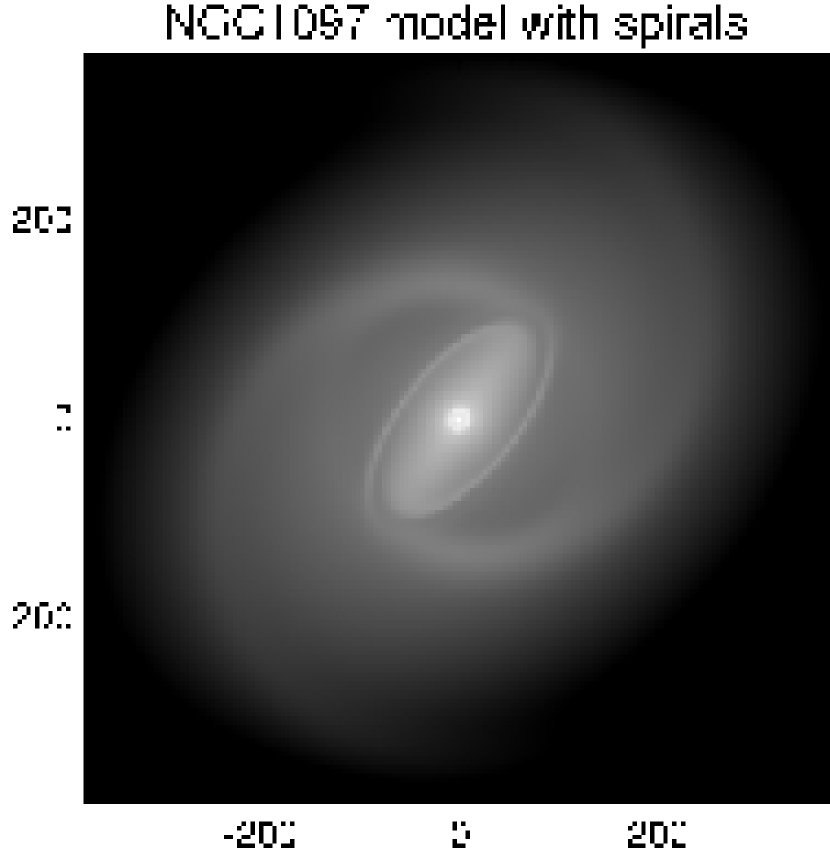
As a standard part of the pipeline analysis, decompositions include bulges and disks, and, if appropriate, bars, nuclear components, and in some cases multiple exponential disks. Taking into account that decompositions, particularly at high redshift, are often made in a more simple manner, we also compute the 2-component bulge/disk decompositions, and 1-component Sérsic function fits. A decomposition for NGC 1097 is shown in Figs. 8 and 9: the 5-component model includes an exponential disk, a Sérsic function for the bulge, and a Ferrers function for the bar. The galaxy has an extremely prominent nuclear ring, which is fit using a Gaussian function, and a nuclear point source using the corresponding PSF. Without deep, almost dust-free observations, like those in SG , the measurement of bulge structural parameters, like shape, size and profile, might in some cases be compromised if the quantification of underlying structures, such as the disks, bars and rings is inaccurate. GALFIT3.0 allows for even more sophisticated decompositions, which will be made for selected sub-samples of SG galaxies. For example, it is possible to add more components, or one may want to fit the spiral arms, of which an example is shown in Fig. 10.
6. Science Investigations
In this section we highlight some preliminary results from a number of science investigations that are and will be carried out by the SG team. We also discuss possible studies that will be enabled by the SG dataset.
6.1. The Faint Outskirts of Galaxies
A major area of study for SG is a quantitative analysis of stellar structures in the faint outer regions of galaxies where the stellar surface density we trace is extremely low and comparable or lower than the atomic gas reservoir. Already, deep optical studies have shown that, in a majority of spiral galaxies, the outer disks exhibit a secondary, exponential component. Stellar disks appear to extend beyond 1.5 D (e.g., Pohlen & Trujillo (2006); Erwin et al. (2008)) with truncated or anti-truncated profiles. GALEX (Martin et al., 2005) has found extended UV (XUV) disks even farther out, where it was assumed only H i gas existed (e.g., Gil de Paz et al. (2005); Thilker et al. (2005, 2007); Muñoz-Mateos et al. (2007); Zaritsky & Christlein (2007). Not only is SG significantly deeper than the previous optical data, but it also traces the stellar profiles into the H i disk of the galaxy – in over 800 SG galaxies, we image an area 3D.
Another observation that has been much debated is the break between the inner and outer exponentials profiles (e.g., Bakos et al. 2008; Azzollini et al. 2008). With SG we are measuring the break radius and comparing it to the disk size and mass. The SG catalog of these breaks will provide strong quantitative constraints for galaxy evolutionary models. In particular, this catalog will be key to quantify the possible role of radial stellar migration in shaping the outskirts of disks (Roškar et al., 2008; Sánchez-Blázquez et al., 2009).
In elliptical galaxies, deep optical observations have revealed the presence of faint tidal tail and shell like structures (e.g., Bennert et al. (2008); Canalizo et al. (2007). SG contains 188 ellipticals and lenticulars – with this set and the SG depth we are quantifying the frequency and mass of shells and other debris features in the outskirts of ellipticals and lenticulars.
6.2. Bulges: Classical, Disk-like, Boxy/Peanut
Bulges are an inhomogeneous class of objects and different types have been proposed in the literature (Kormendy & Kennicutt, 2004; Athanassoula, 2005). Kormendy & Kennicutt (2004) distinguishes bulges from pseudo-bulges, while Athanassoula (2005) distinguishes three categories: classical bulges, boxy/peanut bulges, which are a part of a bar, and disk-like bulges, formed out of disk material. Several studies have analyzed their observational properties and compared them with N-body models (e.g. Kuijken & Merrifield, 1995; Carollo et al., 1997; Bureau & Freeman, 1999; Erwin et al., 2003; Bureau & Athanassoula, 2005; Fisher, 2006; Drory & Fisher, 2007; Fisher & Drory, 2008; Gadotti, 2009). Even in lenticular galaxies there seems to be evidence for disk-like bulges, based on structural decompositions (e.g., Laurikainen et al. 2005, 2007; Gadotti 2008; Graham & Worley 2008) and kinematics (e.g., Peletier et al. 2007; Falcón-Barroso et al. 2006). But until now few studies have analyzed the structural properties of bulges in a large number of galaxies; none have done it in a sample as large and deep as SG . Moreover, SG encompasses a range of large scale structures, allowing us to examine the environmental influences on the formation of bulges. This may have important implications since massive bulges are expected to form from mergers.
From a preliminary analysis of the SG data, Buta et al. (2010) are finding that many late type ellipticals in the RC3 have disks, and thus should instead be classified as S0s, consistent with other deep near-infrared studies (Laurikainen et al., 2010). With the SG data we will examine how common the disk structure is in all types of ellipticals.
Finally, the extremely deep data from SG allows us to best determine the structural properties of the bulge component – in shallower data, estimates of shape, size and profile are uncertain when measurements of underlying components such as disks, bars and rings are imprecise. As described in §5.4, the SG project is carrying out detailed decomposition of all the galaxies, and expects to compile the most detailed data base of bulges of all kinds. The combined advantages of the SG data (deep and insensitive to dust attenuation) and the uniform reduction pipeline (careful and detailed structural analysis) will allow for a suitable examination of galaxies with composite bulges, i.e., galaxies hosting more than one bulge category (e.g., Erwin et al. 2003; Barentine & Kormendy 2009; Nowak et al. 2010). The spatial resolution of our survey is adequate for resolving typical bulges (our resolution is 100 pc at the median distance of the survey volume) but is inadequate for precise measurements of the bulge structure from the inability to resolve compact nuclear structures which are often present at the centers of galaxies. These unresolved point sources affect the values of Sersic parameters, which on average are overestimated in ground-based optical images compared to HST studies (e.g., Carollo et al. 1997; Balcells et al. 2003). We also expect that the reduced dust extinction may reveal triaxial structures in bulges, and thus allow us to probe beyond the standard symmetric Sérsic fits.
6.3. Bars
Stellar bars are dynamically important structures in galaxies. A bar-induced gas flow leads to a number of evolutionary effects from the triggering of circumnuclear starbursts to the build-up of bulges (Scoville & Hersh 1979; Simkin et al. 1980; Zaritsky & Lo 1986; Athanassoula 1992; Friedli & Benz 1993; Martin & Roy 1994; Friedli & Benz 1995; Sakamoto et al. 1999; Sheth et al. 2000, 2002, 2005). The cosmological redshift evolution of the bar fraction is also an important signpost of the growth and dynamic maturity of galaxies (e.g., Abraham et al. 1999; Sheth et al. 2003; Jogee et al. 2004; Elmegreen et al. 2004; Sheth et al. 2008). Whereas the previous smaller and shallower studies gave mixed results for the change in the bar fraction with redshift, Sheth et al. (2008) show that not only does the overall bar fraction in disk galaxies decline significantly over the last seven billion years, but also that the decline depends on the galaxy type. They show that the formation and evolution of bars is strongly correlated with the host galaxy mass, bulge-dominance and presumably their dark matter halo. The SG data is critical to establish the precise local frequency of bars and its variation with galaxy type. It also provides a measurement of the light fraction in the bar component (e.g., Durbala et al. 2008; Gadotti 2008; Weinzirl et al. 2009) and accurate measures of properties such as the bar length, shape and ellipticity (e.g., Menéndez-Delmestre et al. 2007; Erwin 2005; Gadotti 2010). Several techniques may be used to derive bar strengths, based on calculating bar torques (Laurikainen & Salo, 2002; Buta et al., 2003), and estimating the bar-spiral arm contrast (Elmegreen & Elmegreen, 1985). Analysis of the relative Fourier intensity profiles of bars is compared with models of the evolution of barred galaxies (e.g., Athanassoula & Misiriotis 2002; Debattista et al. 2004) to constrain the history of their evolution and interaction with their dark matter halo (Athanassoula, 2003).
Another study of interest is the presence of secondary or nuclear bars which may be responsible for feeding the central black holes and/or stellar clusters (Shlosman et al., 1990). The SG observations, unaffected by the high and patchy extinction often present in galactic centers, allow us to detect all nuclear bars with sizes of r 500 pc (our resolution, 2 200 pc at the median distance of SG ) in galaxies of all types.
6.4. Galactic Rings
Outer rings are large, optically low surface brightness features that dominate the outer disks of some early-type barred and weakly-barred galaxies (see review by Buta & Combes (1996). The properties of the rings constrain their formation epoch, the dynamical time-scale at their respective radii, and the evolution of the bar pattern speed (e.g., Athanassoula (2003). Finding outer rings around unbarred galaxies is also of great interest, because it would suggest that some unbarred galaxies may in fact be highly evolved former barred galaxies. Whereas ground-based near-IR imaging is rarely deep enough to detect outer rings reliably to study their stellar populations, colors, and other characteristics, the SG data will not only allow us to detect many new outer rings, but also to make a complete census of these features in normal galaxies and to measure their stellar mass, shape, width and ellipticity. Likewise, SG provides an unprecedented view of circumnuclear and inner rings, which are typically found in barred spirals. These rings should have a broad, underlying older stellar population background as they evolve, and it is this type of feature we will see in the SG data.
6.5. Spiral Arms
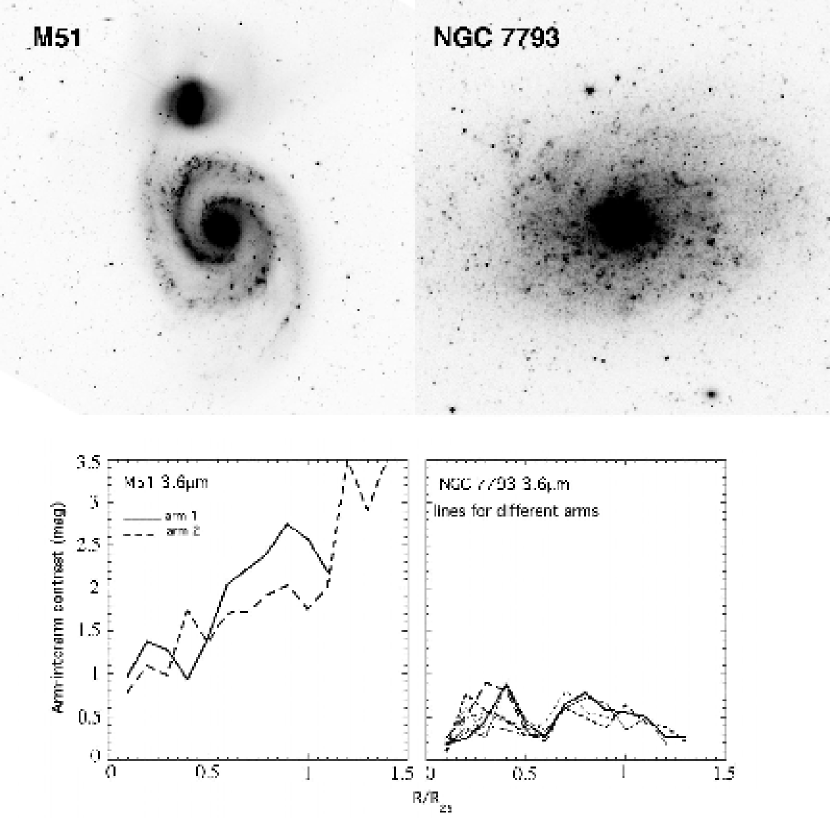
A systematic study of spiral arm amplitudes as a function of radius at 3.6 and 4.5m, free of confusing effects from dust extinction, promises to initiate a new set of spiral arm studies. Although the discrepancies in the classical density wave model were solved with the swing amplification theory (Toomre, 1981), there has been very little testing of this theory with observations. Modal studies by Bertin et al. (1989a, b) predict that there should be amplitude variations along the arms from resonances between inward and outward moving spiral waves and the precise amplitude variations have been modeled (Elmegreen & Elmegreen, 1984; Elmegreen et al., 1989; Elmegreen & Thomasson, 1993; Regan & Elmegreen, 1997). Most recently, a new theory has been proposed for the formation of rings and spiral arms which argues in favor of chaotic orbits, confined by invariant manifolds emanating from the L1 & L2 Lagrangian points of a bar (Romero-Gómez et al., 2007). Several comparisons between the results of this theory and observations have been carried out successfully (Athanassoula et al., 2009b, a) and several more will be possible with the SG database. SG will cover the full range of galaxies with varying spiral arm strengths and galactic structures. In Figure 11, we show a preliminary result of the type of analysis that is possible with the SG data. In this figure we show the arm-interarm contrast measured from the 3.6m SG images for NGC 7793, a flocculent galaxy, in contrast with M51, a grand design spiral galaxy (see a model for amplitude variation of M51 in Salo & Laurikainen 2000a). The contrasts are measured beyond R, further than in previous optical studies. The spiral structure traced in the 3.6 m band is different in detail from the optical images, but still shows weak arms in NGC 7793 and increasingly stronger arms in M51. We will carry out a detailed analysis of spiral arm amplitudes and variations and compare the observational data to the models.
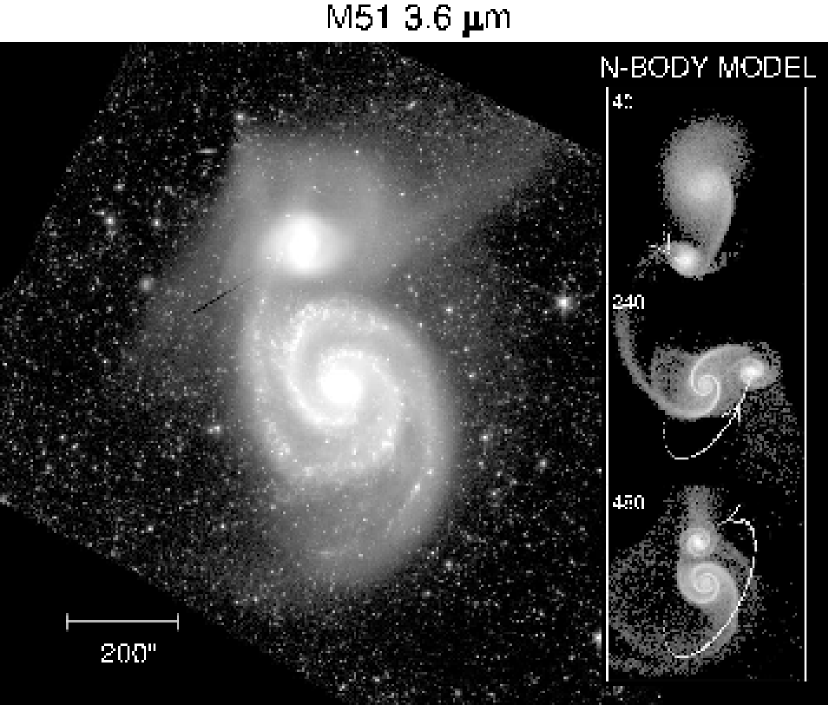
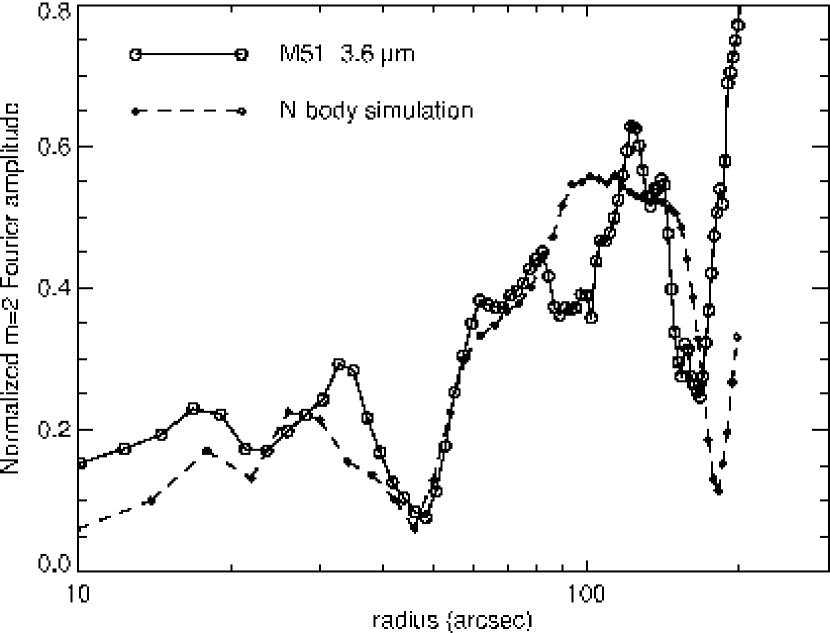
For the NGC 5194 (M51) system, there may well be a connection between the spiral structure and the presence of the companion (NGC 5195). Indeed, detailed HI observations by Rots et al. (1990) show the presence of a long tail, which emanates from the west side of the galaxy, running south of the spiral arm visible in the SG image, and turning up towards the north further eastwards. The HI kinematics are very difficult to model with an interaction involving a single passage, but Salo & Laurikainen (2000a, b) propose a model with a second passage (Figure 12), which gives a better fit to some of the aspects of the observations. The inner spiral structure in the main spiral is then amplified by the action of the companion, and wave interference causes amplitude modulations, which are well reproduced in the SG observations (Figure 13). This shows the interest of the SG data for detailed modeling of the dynamics of individual galaxies.
6.6. Early Type Galaxies & Dwarfs
SG contains 188 galaxies of T-type 0 and therefore constitutes one of the largest and most homogeneous mid-infrared data sets for early type galaxies. The shapes of ellipticals and lenticulars may reflect different evolutionary paths, with wet mergers leading to disky shapes and dry mergers leading to boxy profiles (Naab et al., 2006; Pasquali et al., 2007; Kang et al., 2007). In addition, Kormendy et al. (2009) shows that deep imaging can reveal departures from the Sérsic profiles in elliptical galaxies, which are diagnostics of their formation. They found a dichotomy in which ellipticals that have cuspy cores at their inner radii can be separated from those which show an excess of light at the center. The SG data offer us a unique opportunity to revisit the frequency of the different shapes and profiles as a function of stellar mass and environment, free of dust obscuration effects.
Although dwarfs are the most abundant type of galaxy in the Universe, their low surface brightnesses of typically 22 mag arcsec have restricted detailed observations of these stellar systems. In particular, the characterization of the underlying stellar structure in these faint galaxies still remains largely unexplored. Using an absolute magnitude criterion of , we have identified a preliminary sample of 206 dwarf galaxies in SG . The sample includes 87 late-type DDO dwarfs previously unobserved with Spitzer, to complement the 48 which have been observed. The SG dwarfs therefore constitute a representative sample of nearby dwarf galaxies in which to study the properties of the underlying stellar component.
Dwarf galaxies in SG allow for a detailed analysis of the underlying stellar disk in both the 3.6 and 4.5m data. By deriving the radial scale lengths for these galaxies, more insight can be gained into the evolutionary link between dwarfs and their giant counterparts. At the same time, the relatively large sample of dwarfs in SG gives a unique opportunity to look at how these parameters may vary with environment. We can also derive stellar masses for the dwarfs which will be used to assess their stellar mass to dark-matter ratio and will likely provide crucial evidence to the longstanding debate of whether these galaxies are truly dark-matter dominated systems (see e.g., Strigari et al. 2008).
In addition to these areas, there are at least three other main areas of astrophysics that these data will address uniquely: the reported absence of bulges in some disk galaxies, the vertical stellar structure, and the Tully-Fisher relationship. There is also likely to be significant amounts of spin-off science for SG with its large and accurate inventory of mass and galactic structure in the nearby Universe, e.g., relationship between the Tully-Fisher relationship and properties of the fundamental plane (e.g., Zaritsky et al. 2008), dust heating in outer disks, the interaction / merger fraction from a study of the debris around these galaxies, and diagnosis of AGN activity from tracing hot dust very close to the AGN from the [3.6]-[4.5] color.
7. Data Release and Team Policy
The SG team is committed to releasing all of the reduced data upon publication of the entire SG datasets from each of the pipelines. We expect the science-ready images from pipeline 1, the masks from pipeline 2, the galaxy properties and profiles from pipeline 3 and the input and output files from Pipeline 4 (including the mask, sigma images, images without NaN values and the GALFIT input and output parameter files) to be released on a staggered schedule using NED or IRSA for long term use by the community. Currently the products of each of the pipeline are expected to be released in the supplement issue of the journals upon verification of their quality which will be on-going and occur as part of the various scientific investigations conducted by the team. We expect that some of the data and pipeline may need to be refined or enhanced in the future. As the data are still being acquired (data acquisition is expected to be complete in 2011) and analyzed, our earliest release date for the the science-ready images (P1 products) for the entire SG data is not expected at least until 2012, and the supplement papers for the products from the other pipelines are expected to follow within a year after the Pipeline 1 supplement paper. In the meanwhile, to allow for maximum use of the data for science by the larger community, the collaboration has agreed on an open-door policy whereby any member of the astronomical community may join the team temporarily as a guest and pursue any type of science. The use of the data, publication policies and authorship on papers are clearly defined in our policy statement available here: http://www.cv.nrao.edu/ksheth/ s4g/S4G_policy_v6.pdf. This statement is adopted by the SG team and all of its guests. Interested members of the astronomical community are invited to read the policy and contact the PI or an SG member to discuss the possibilities of joining the team.
The noteworthy point of this policy is that our team has agreed to avoid carving out large science categories or areas to encourage the maximum use of the data within the team, and within the larger community, for any science that may be possible with these data. Our philosophy is that if multiple people are interested in a topic but want to work in separate teams then we will encourage both teams to collaborate and address the scientific problems in independent but parallel investigations.
8. Summary
SG will provide the deepest, largest, and most homogenous data set of nearby galaxies at 3.6 and 4.5m. The spatial resolution will be unmatched at these wavelengths, 2, which is ideal for comparisons to ground based optical and near-IR observations, as well as MeerKAT, eVLA, ALMA and other future large radio array surveys. The sample of 2,331 galaxies includes most morphological types and masses. The images will give an unparalleled view of stellar mass distributions and faint peripheral structures. All of the galaxies, as well as many additional galaxies from the Spitzer archives, will be reduced in the same way, giving data products that span the full range from science-ready images to measurements of global galaxy properties and individual components. SG is designed to be a useful reference for many years to come. It will contain the best available mid-infrared data for individual galaxies and be among the most complete surveys for statistical studies. It will be useful to study the origin and evolution of galaxies and their dynamical components, and to supplement observations of nearby galaxies at other wavelengths.
9. Acknowledgements
References
- Abraham et al. (1999) Abraham, R. G., Merrifield, M. R., Ellis, R. S., Tanvir, N. R., & Brinchmann, J. 1999, MNRAS, 308, 569
- Athanassoula (1992) Athanassoula, E. 1992, MNRAS, 259, 345
- Athanassoula (2003) —. 2003, MNRAS, 341, 1179
- Athanassoula (2005) —. 2005, MNRAS, 358, 1477
- Athanassoula & Misiriotis (2002) Athanassoula, E., & Misiriotis, A. 2002, MNRAS, 330, 35
- Athanassoula et al. (2009a) Athanassoula, E., Romero-Gómez, M., Bosma, A., & Masdemont, J. J. 2009a, MNRAS, 400, 1706
- Athanassoula et al. (2009b) Athanassoula, E., Romero-Gómez, M., & Masdemont, J. J. 2009b, MNRAS, 394, 67
- Azzollini et al. (2008) Azzollini, R., Trujillo, I., & Beckman, J. E. 2008, ApJ, 684, 1026
- Bakos et al. (2008) Bakos, J., Trujillo, I., & Pohlen, M. 2008, ApJ, 683, L103
- Balcells et al. (2003) Balcells, M., Graham, A. W., Domínguez-Palmero, L., & Peletier, R. F. 2003, ApJ, 582, L79
- Barentine & Kormendy (2009) Barentine, J. C., & Kormendy, J. 2009, ArXiv e-prints
- Barnes et al. (2001) Barnes, D. G., et al. 2001, MNRAS, 322, 486
- Bell et al. (2003) Bell, E. F., McIntosh, D. H., Katz, N., & Weinberg, M. D. 2003, ApJS, 149, 289
- Bennert et al. (2008) Bennert, N., Canalizo, G., Jungwiert, B., Stockton, A., Schweizer, F., Peng, C. Y., & Lacy, M. 2008, ApJ, 677, 846
- Bertin & Arnouts (1996) Bertin, E., & Arnouts, S. 1996, A&AS, 117, 393
- Bertin et al. (1989a) Bertin, G., Lin, C. C., Lowe, S. A., & Thurstans, R. P. 1989a, ApJ, 338, 78
- Bertin et al. (1989b) —. 1989b, ApJ, 338, 104
- Bureau & Athanassoula (2005) Bureau, M., & Athanassoula, E. 2005, ApJ, 626, 159
- Bureau & Freeman (1999) Bureau, M., & Freeman, K. C. 1999, AJ, 118, 126
- Buta et al. (2003) Buta, R., Block, D. L., & Knapen, J. H. 2003, AJ, 126, 1148
- Buta & Combes (1996) Buta, R., & Combes, F. 1996, Fundamentals of Cosmic Physics, 17, 95
- Buta et al. (2010) Buta, R. J., et al. 2010, ApJ, submitted
- Canalizo et al. (2007) Canalizo, G., Bennert, N., Jungwiert, B., Stockton, A., Schweizer, F., Lacy, M., & Peng, C. 2007, ApJ, 669, 801
- Carollo et al. (1997) Carollo, C. M., Stiavelli, M., de Zeeuw, P. T., & Mack, J. 1997, AJ, 114, 2366
- Dalcanton et al. (2009) Dalcanton, J. J., et al. 2009, ApJS, 183, 67
- de Vaucouleurs et al. (1977) de Vaucouleurs, G., Corwin, Jr., H. G., & Bollinger, G. 1977, ApJS, 33, 229
- de Vaucouleurs et al. (1991) de Vaucouleurs, G., de Vaucouleurs, A., Corwin, Jr., H. G., Buta, R. J., Paturel, G., & Fouque, P. 1991, Third Reference Catalogue of Bright Galaxies, ed. de Vaucouleurs, G., de Vaucouleurs, A., Corwin, H. G., Jr., Buta, R. J., Paturel, G., & Fouque, P.
- Debattista et al. (2004) Debattista, V. P., Carollo, C. M., Mayer, L., & Moore, B. 2004, ApJ, 604, L93
- Draine & Lee (1984) Draine, B. T., & Lee, H. M. 1984, ApJ, 285, 89
- Drory & Fisher (2007) Drory, N., & Fisher, D. B. 2007, ApJ, 664, 640
- Durbala et al. (2008) Durbala, A., Sulentic, J. W., Buta, R., & Verdes-Montenegro, L. 2008, ArXiv e-prints, 0807.2216
- Elmegreen & Elmegreen (1985) Elmegreen, B. G., & Elmegreen, D. M. 1985, ApJ, 288, 438
- Elmegreen et al. (2004) Elmegreen, B. G., Elmegreen, D. M., & Hirst, A. C. 2004, ApJ, 612, 191
- Elmegreen et al. (1989) Elmegreen, B. G., Seiden, P. E., & Elmegreen, D. M. 1989, ApJ, 343, 602
- Elmegreen & Thomasson (1993) Elmegreen, B. G., & Thomasson, M. 1993, A&A, 272, 37
- Elmegreen & Elmegreen (1984) Elmegreen, D. M., & Elmegreen, B. G. 1984, ApJS, 54, 127
- Epchtein et al. (1994) Epchtein, N., et al. 1994, Ap&SS, 217, 3
- Erwin (2005) Erwin, P. 2005, MNRAS, 364, 283
- Erwin et al. (2003) Erwin, P., Beltrán, J. C. V., Graham, A. W., & Beckman, J. E. 2003, ApJ, 597, 929
- Erwin et al. (2008) Erwin, P., Pohlen, M., & Beckman, J. E. 2008, AJ, 135, 20
- Eskridge et al. (2002) Eskridge, P. B., et al. 2002, ApJS, 143, 73
- Falcón-Barroso et al. (2006) Falcón-Barroso, J., et al. 2006, New Astronomy Review, 49, 515
- Fazio et al. (2004) Fazio, G. G., et al. 2004, ApJS, 154, 10
- Fisher (2006) Fisher, D. B. 2006, ApJ, 642, L17
- Fisher & Drory (2008) Fisher, D. B., & Drory, N. 2008, AJ, 136, 773
- Friedli & Benz (1993) Friedli, D., & Benz, W. 1993, A&A, 268, 65
- Friedli & Benz (1995) —. 1995, A&A, 301, 649
- Gadotti (2008) Gadotti, D. A. 2008, MNRAS, 384, 420
- Gadotti (2009) —. 2009, MNRAS, 393, 1531
- Gadotti (2010) —. 2010, ArXiv e-prints
- Gil de Paz et al. (2005) Gil de Paz, A., et al. 2005, ApJ, 627, L29
- Gil de Paz et al. (2007) —. 2007, ApJS, 173, 185
- Giovanelli et al. (2005) Giovanelli, R., et al. 2005, AJ, 130, 2598
- Graham & Worley (2008) Graham, A. W., & Worley, C. C. 2008, MNRAS, 388, 1708
- Heraudeau & Simien (1997) Heraudeau, P., & Simien, F. 1997, A&A, 326, 897
- Jarrett (2004) Jarrett, T. 2004, Publications of the Astronomical Society of Australia, 21, 396
- Jogee et al. (2004) Jogee, S., et al. 2004, ApJ, 615, L105
- Jun & Im (2008) Jun, H. D., & Im, M. 2008, ApJ, 678, L97
- Kang et al. (2007) Kang, X., van den Bosch, F. C., & Pasquali, A. 2007, MNRAS, 381, 389
- Kennicutt et al. (2003) Kennicutt, Jr., R. C., et al. 2003, PASP, 115, 928
- Kent (1985) Kent, S. M. 1985, ApJS, 59, 115
- Kormendy et al. (2009) Kormendy, J., Fisher, D. B., Cornell, M. E., & Bender, R. 2009, ApJS, 182, 216
- Kormendy & Kennicutt (2004) Kormendy, J., & Kennicutt, Jr., R. C. 2004, ARA&A, 42, 603
- Kuijken & Merrifield (1995) Kuijken, K., & Merrifield, M. R. 1995, ApJ, 443, L13
- Laurikainen & Salo (2002) Laurikainen, E., & Salo, H. 2002, MNRAS, 337, 1118
- Laurikainen et al. (2005) Laurikainen, E., Salo, H., & Buta, R. 2005, MNRAS, 362, 1319
- Laurikainen et al. (2007) Laurikainen, E., Salo, H., Buta, R., & Knapen, J. H. 2007, MNRAS, 381, 401
- Laurikainen et al. (2009) —. 2009, ApJ, 692, L34
- Laurikainen et al. (2010) Laurikainen, E., Salo, H., Buta, R., Knapen, J. H., & Comerón, S. 2010, MNRAS, 405, 1089
- Lee et al. (2008) Lee, J. C., et al. 2008, in Astronomical Society of the Pacific Conference Series, Vol. 396, Astronomical Society of the Pacific Conference Series, ed. J. G. Funes & E. M. Corsini, 151–+
- Martin et al. (2005) Martin, D. C., et al. 2005, ApJ, 619, L1
- Martin & Roy (1994) Martin, P., & Roy, J.-R. 1994, ApJ, 424, 599
- Méndez-Abreu et al. (2008) Méndez-Abreu, J., Aguerri, J. A. L., Corsini, E. M., & Simonneau, E. 2008, A&A, 478, 353
- Menéndez-Delmestre et al. (2007) Menéndez-Delmestre, K., Sheth, K., Schinnerer, E., Jarrett, T. H., & Scoville, N. Z. 2007, ApJ, 657, 790
- Muñoz-Mateos et al. (2007) Muñoz-Mateos, J. C., Gil de Paz, A., Boissier, S., Zamorano, J., Jarrett, T., Gallego, J., & Madore, B. F. 2007, ApJ, 658, 1006
- Muñoz-Mateos et al. (2009) Muñoz-Mateos, J. C., et al. 2009, ApJ, 703, 1569
- Naab et al. (2006) Naab, T., Khochfar, S., & Burkert, A. 2006, ApJ, 636, L81
- Nowak et al. (2010) Nowak, N., Thomas, J., Erwin, P., Saglia, R. P., Bender, R., & Davies, R. I. 2010, MNRAS, 106
- Oke (1974) Oke, J. B. 1974, ApJS, 27, 21
- Pahre et al. (2004) Pahre, M. A., Ashby, M. L. N., Fazio, G. G., & Willner, S. P. 2004, ApJS, 154, 235
- Pasquali et al. (2007) Pasquali, A., van den Bosch, F. C., & Rix, H. 2007, ApJ, 664, 738
- Paturel et al. (2003) Paturel, G., Petit, C., Rousseau, J., & Vauglin, I. 2003, VizieR Online Data Catalog, 340, 50001
- Peletier et al. (2007) Peletier, R. F., et al. 2007, New Astronomy Review, 51, 29
- Peng et al. (2002) Peng, C. Y., Ho, L. C., Impey, C. D., & Rix, H. 2002, AJ, 124, 266
- Peng et al. (2010) —. 2010, AJ, 139, 2097
- Pignatelli et al. (2006) Pignatelli, E., Fasano, G., & Cassata, P. 2006, A&A, 446, 373
- Pohlen & Trujillo (2006) Pohlen, M., & Trujillo, I. 2006, A&A, 454, 759
- Regan & Elmegreen (1997) Regan, M. W., & Elmegreen, D. M. 1997, AJ, 114, 965
- Regan & Teuben (2004) Regan, M. W., & Teuben, P. J. 2004, ApJ, 600, 595
- Regan et al. (2006) Regan, M. W., et al. 2006, ApJ, 652, 1112
- Rhoads (1998) Rhoads, J. E. 1998, AJ, 115, 472
- Romero-Gómez et al. (2007) Romero-Gómez, M., Athanassoula, E., Masdemont, J. J., & García-Gómez, C. 2007, A&A, 472, 63
- Rots et al. (1990) Rots, A. H., Bosma, A., van der Hulst, J. M., Athanassoula, E., & Crane, P. C. 1990, AJ, 100, 387
- Roškar et al. (2008) Roškar, R., Debattista, V. P., Stinson, G. S., Quinn, T. R., Kaufmann, T., & Wadsley, J. 2008, ApJ, 675, L65
- Sakamoto et al. (1999) Sakamoto, K., Okumura, S. K., Ishizuki, S., & Scoville, N. Z. 1999, ApJ, 525, 691
- Salo & Laurikainen (2000a) Salo, H., & Laurikainen, E. 2000a, MNRAS, 319, 377
- Salo & Laurikainen (2000b) —. 2000b, MNRAS, 319, 393
- Sánchez-Blázquez et al. (2009) Sánchez-Blázquez, P., Courty, S., Gibson, B. K., & Brook, C. B. 2009, MNRAS, 398, 591
- Scoville & Hersh (1979) Scoville, N. Z., & Hersh, K. 1979, ApJ, 229, 578
- Sheth et al. (2003) Sheth, K., Regan, M. W., Scoville, N. Z., & Strubbe, L. E. 2003, ApJ, 592, L13
- Sheth et al. (2000) Sheth, K., Regan, M. W., Vogel, S. N., & Teuben, P. J. 2000, ApJ, 532, 221
- Sheth et al. (2002) Sheth, K., Vogel, S. N., Regan, M. W., Teuben, P. J., Harris, A. I., & Thornley, M. D. 2002, AJ, 124, 2581
- Sheth et al. (2005) Sheth, K., Vogel, S. N., Regan, M. W., Thornley, M. D., & Teuben, P. J. 2005, ApJ, 632, 217
- Sheth et al. (2008) Sheth, K., et al. 2008, ApJ, 675, 1141
- Shlosman et al. (1990) Shlosman, I., Begelman, M. C., & Frank, J. 1990, Nature, 345, 679
- Simard (1998) Simard, L. 1998, in Astronomical Society of the Pacific Conference Series, Vol. 145, Astronomical Data Analysis Software and Systems VII, ed. R. Albrecht, R. N. Hook, & H. A. Bushouse, 108–+
- Simkin et al. (1980) Simkin, S. M., Su, H. J., & Schwarz, M. P. 1980, ApJ, 237, 404
- Skrutskie et al. (2006) Skrutskie, M. F., et al. 2006, AJ, 131, 1163
- Strigari et al. (2008) Strigari, L. E., Bullock, J. S., Kaplinghat, M., Simon, J. D., Geha, M., Willman, B., & Walker, M. G. 2008, Nature, 454, 1096
- Thilker et al. (2005) Thilker, D. A., et al. 2005, ApJ, 619, L79
- Thilker et al. (2007) —. 2007, ApJS, 173, 538
- Tokunaga et al. (1991) Tokunaga, A. T., Sellgren, K., Smith, R. G., Nagata, T., Sakata, A., & Nakada, Y. 1991, ApJ, 380, 452
- Toomre (1981) Toomre, A. 1981, in Structure and Evolution of Normal Galaxies, ed. S. M. Fall & D. Lynden-Bell, 111–136
- Weinzirl et al. (2009) Weinzirl, T., Jogee, S., Khochfar, S., Burkert, A., & Kormendy, J. 2009, ApJ, 696, 411
- Werner et al. (2004) Werner, M. W., et al. 2004, ApJS, 154, 1
- Worthey (1994) Worthey, G. 1994, ApJS, 95, 107
- Zaritsky & Christlein (2007) Zaritsky, D., & Christlein, D. 2007, AJ, 134, 135
- Zaritsky & Lo (1986) Zaritsky, D., & Lo, K. Y. 1986, ApJ, 303, 66
- Zaritsky et al. (1993) Zaritsky, D., Rix, H., & Rieke, M. 1993, Nature, 364, 313
- Zaritsky et al. (2008) Zaritsky, D., Zabludoff, A. I., & Gonzalez, A. H. 2008, ApJ, 682, 68
| Galaxy | RA (J2000) | DEC (J2000) | T | M | Log(D) | m |
|---|---|---|---|---|---|---|
| UGC12893 | 0.00784 | 17.21952 | 8.4 | -15.97 | 1.06 | 15.14 |
| PGC000143 | 0.03292 | -15.46140 | 9.9 | -15.83 | 2.04 | 10.00 |
| ESO012-014 | 0.04511 | -80.34825 | 9.0 | -18.17 | 1.18 | 13.72 |
| NGC7814 | 0.05418 | 16.14554 | 2.0 | -20.04 | 1.64 | 10.96 |
| UGC00017 | 0.06198 | 15.21822 | 9.0 | -16.02 | 1.39 | 14.60 |
| NGC7817 | 0.06635 | 20.75182 | 4.1 | -21.11 | 1.52 | 11.56 |
| ESO409-015 | 0.09223 | -28.09915 | 6.2 | -15.16 | 1.02 | 14.43 |
| ESO293-034 | 0.10559 | -41.49592 | 6.0 | -18.68 | 1.40 | 12.67 |
| NGC0007 | 0.13916 | -29.91678 | 4.9 | -18.22 | 1.39 | 13.18 |
| NGC0014 | 0.14618 | 15.81659 | 9.8 | -18.25 | 1.18 | 12.35 |
| IC1532 | 0.16464 | -64.37161 | 4.0 | -17.89 | 1.26 | 13.86 |
| … | … | … | … | … | … | … |
| … | … | … | … | … | … | … |
| NGC7798 | 23.99042 | 20.74986 | 4.1 | -20.20 | 1.20 | 12.56 |
| NGC7800 | 23.99354 | 14.80723 | 9.7 | -19.45 | 1.24 | 12.61 |
Note. — All properties obtained from the HyperLEDA database (http://leda.univ-lyon1.fr/) (Paturel et al., 2003)
Note. — RA and DEC are decimal hours and degrees in J2000; T is the morphological type code (-5:E, -3:E-S0, 0: S0a, 3:Sb, 7:Sd, 10:Irr); M is the absolute B-magnitude; and ) Log D is the apparent major axis diameter at 25 mag arcsec . D25 is in units of 0.1 arcminutes; m is the total apparent corrected B-magnitude, corrected for inclination, galactic extinction and K-correction. A value of -99 indicates that the the value was missing from the HyperLEDA database
Note. — The full table is available in the electronic version of the journal.