Interaction of Atomic and Molecular Hydrogen with Tholin Surfaces at Low Temperatures
Abstract
We study the interaction of atomic and molecular hydrogen with a surface of tholin, a man-made polymer considered to be an analogue of aerosol particles present in Titan’s atmosphere, using thermal programmed desorption at low temperatures below K. The results are fitted and analyzed using a fine-grained rate equation model that describes the diffusion, reaction and desorption processes. We obtain the energy barriers for diffusion and desorption of atomic and molecular hydrogen. These barriers are found to be in the range of to meV, indicating that atom / molecule-surface interactions in this temperature range are dominated by weak adsorption forces. The implications of these results for the understanding of the atmospheric chemistry of Titan are discussed.
Syracuse University]Physics Department, Syracuse University, Syracuse, New York 13244 The Hebrew University]Racah Institute of Physics, The Hebrew University, Jerusalem 91904, Israel Harvard-Smithsonian Center]Harvard-Smithsonian Center for Astrophysics, Cambridge, Massachusetts 02138 The Hebrew University]Racah Institute of Physics, The Hebrew University, Jerusalem 91904, Israel
1 Introduction
In the last decade, the study of the interaction of hydrogen with surfaces at low temperatures has become a topic of interest in fields as different as hydrogen storage 1 and interstellar chemistry, where molecular hydrogen forms on the surfaces of dust grains 2, 3. In the latter field, there are several laboratories studying the mechanisms of reaction of molecular hydrogen in various space-like environments. Most laboratory research on the formation of molecular hydrogen on dust grain analogues, such as silicates 4, 5, 6, amorphous carbon 7, and ices 8, 9, 10, has shown that this process proceeds by the Langmuir-Hinshelwood (LH) mechanism 11 and is governed by weak adsorption forces. In the case of formation of H2 at higher temperatures ( K), it was found 12 that D atoms sent onto a hydrogen-loaded amorphous carbon surface abstract H atoms to form HD. On tholins, an analogue of aerosol particles in Titan’s atmosphere, it was claimed that at high temperatures (above K) molecular hydrogen is formed via the Eley-Rideal (ER) abstraction mechanism 13.
Titan’s atmosphere is composed mostly of diatomic nitrogen () and methane 14. The dissociation of methane and nitrogen in the upper atmosphere creates radicals that eventually aggregate in macroscopic particles that form the well-known brownish haze that surrounds Titan. Information on this haze is limited because of the difficulty of obtaining data from ground observatories or space probes that would reveal its chemical structure 15. Over the years, starting with the seminal work of Sagan and Khare 16, analogues of those particles, called tholins, have been produced and characterized in many laboratories 17, 18, 19, and they were found to reproduce the optical signature of Titan’s haze. Although preparation methods vary, there has been a convergence about the basic properties of these analogues 20. They have a general formula CxHyNz and consist of a disordered chain of highly unsaturated polymers. Functional groups have been identified20. For our investigation, we are interested in the addition or removal of hydrogen via the hydrogenation and abstraction of CC and CN double and triple bonds 13.
The abundant presence of unsaturated hydrocarbons is an indirect verification of the lack of abundant atomic hydrogen in the stratosphere and mesosphere where a wealth of organics are detected 21. To resolve this discrepancy, it was suggested that hydrogen, which is produced in the dissociation of CH4, might recombine to form molecular hydrogen that then escapes into space 22. The formation of molecular hydrogen in Titan’s atmosphere follows the same constraints as the formation of H2 in the interstellar medium 23. The binary association of hydrogen atoms puts the protomolecule in a dissociated state that can make slow spin-forbidden transitions to the ground state, and the protomolecule promptly dissociates. It takes a third particle participating in the reaction to absorb the excess energy. In Titan’s atmosphere, however, the density of hydrogen atoms and the total density are still too small (cf. 6) to allow a third atom to play this role. But formation of H2 taking place on the surface of a third body can be efficient 24. In the case of Titan, the third body is an aerosol particle. This view is, however, not universally shared. For example, a competing mechanism was proposed 22, in which H2 is catalyzed by C4H2 which is one of the most abundant hydrocarbon molecules in Titan’s atmosphere. However, it was found that this scheme is inconsistent with other observations of abundance of C2- and C3- containing hydrocarbons 21.
In a recent experiment 13, the formation of HD molecules was studied by sending D atoms onto tholins. The desorption of the reaction product, HD, from the tholin surface was detected by a quadrupole mass spectrometer, while the change to the surface resulting from the interaction with D atoms was detected via infrared (IR) spectrometry in a separate experiment in another apparatus. The sample temperature was in a range appropriate for actual aerosol particles, K, but experiments were also performed at a higher temperature of K.
The formation of HD was attributed to the Eley-Rideal reaction scheme, sometimes called “prompt reaction model” 25 in the astrophysics literature. In this model, the atom coming from the gas phase interacts directly with an atom on the surface without first becoming accommodated to it. Alternatively, the gas-phase particle might exchange only part of its energy and move at super-thermal energy across the surface. This is called the hot-atom mechanism 26.
Most of the surface-catalyzed reactions known in the surface chemistry literature can be described by the familiar LH model. The ER reaction or the hot-atom mechanism have been positively identified only in the 1990’s, and mostly on H-plated single crystal metal surfaces 27, 28, H-plated silicon 29, H-plated graphite 30 and H-loaded amorphous carbon 12. There are two major signatures to look for in order to identify the ER reaction model: the detection of super-thermal energy in the HD leaving the surface, and the time dependence of the HD yield during irradiation of the surface with D atoms. Such irradiation depletes the surface of H atoms by their reaction with incoming D atoms, and hence the measured HD yield decreases exponentially with the irradiation time.
When the tholin sample was first exposed to D atoms, a small increase in the HD signal was measured 13, but there was little change in the HD signal over time. A similar observation was made for the formation of HD from the interaction of D with hydrogen-loaded amorphous carbon at room temperature 12. In this experiment, the cross section for the reaction between an adsorbed H atom and an incoming D atom was obtained from IR data, and was found to be almost two orders of magnitude smaller than the one measured for the interaction of energetic H atoms on a graphite surface 30. The weak time dependence of the HD signal was attributed to this very small value of the cross section 12. Alternatively, we could interpret this result as caused by a small probability of reaction when a D atom hits an H atom that is on the surface.
In this paper we report on a study of the formation of molecular hydrogen (specifically, HD and D2) on tholins at lower temperatures, below K. At these low temperatures the diffusion and desorption processes are slower and the residence times of the weakly adsorbed atoms and molecules on the surface are longer. This leads to reduced noise levels and enables us to determine whether the LH or the abstraction mechanism are operative. We obtain activation energies for the diffusion and desorption of hydrogen atoms (H and D without distinction) and molecules (HD and D2) on or from the surface. To this end, we use thermal desorption spectroscopy coupled with an analysis using rate equation models. This work builds on methodologies developed in previous studies of the formation of molecular hydrogen on analogues of interstellar dust particles, such as silicates 5, 31, 6, carbonaceous materials 32, and ices 33, 8, 34.
The Paper is organized as follows. In 2 we describe the experimental setup and the type of measurements performed. 3 presents the results of these measurements. We then explain in detail the rate equation model (4) that we employ. The experimental data is analyzed using this model in 5, which contains our main results on the energy landscape. We discuss applications of our results in 6, before concluding with our Summary (7).
2 Experimental Methods
2.1 Apparatus
The apparatus used for these experiments is the same as the one employed to study the formation of molecular hydrogen on interstellar dust grain analogues 35. It consists of two atom beam lines and a sample / detector chamber. In the beam lines, hydrogen and deuterium gas is dissociated by two radio frequency sources. The beam in each line is formed in three differentially pumped stages and is highly collimated. A metrological laser coaxial with the line is used to align the beam such that the two beams strike the same spot on the sample. The partial pressure in the third stage is in the Torr range, and this stage is separated from the ultra-high vacuum chamber by a mm collimator. The main chamber has a base pressure in the low to mid Torr range. The detector, a high performance Hiden triple pass quadrupole mass spectrometer, is mounted on a rotatable flange, and is configured so it can measure both the flux coming from the sample and the one from the beams; different masses can be probed simultaneously. The sample is mounted on a cold finger, surrounded by a cold copper shield to improve cooling. In the experiments reported here, the cold finger was cooled with liquid helium and the desired sample temperature was obtained using a cartridge heater (Lakeshore). The temperature was measured with a calibrated silicon diode (Lakeshore).
We use beam lines since they allow to control the kinematic conditions of irradiation of the sample to very good extent. Through differential pumping and the use of a mechanical chopper, low doses of H and D can be sent. Although the flux is understandably orders of magnitude higher than in actual space conditions, it is much less than traditionally achieved in laboratory experiments (cf. LABEL:sec:findflux,sec:applications). The reason for having two lines is that even if we use a very effective dissociation source (), a small fraction of D2 is transmitted on towards the sample. Deuterium is used instead of hydrogen because it is easier to detect HD as the product of reaction than H2, which is the main residual gas in a well-baked ultra-high vacuum stainless steel chamber.
Additionally, the apparatus was instrumented with an IR spectrometer (Nicolet FT-IR 6300) in the reflection-absorption infrared spectroscopy (RAIRS) configuration in order to study in-situ surface modifications. The IR light from the source is sent into the apparatus via a differentially pumped MgF window. The beam strikes the sample at glancing incidence () and is then collected by a liquid nitrogen cooled mercury cadmium telluride detector placed outside the vacuum chamber. This arrangement grants high sensitivity and allows to perform the IR measurements without breaking the vacuum.
The sample was prepared by Prof. Mark Smith’s laboratory (University of Arizona). The tholin films were deposited on a gold plated copper disc of inch diameter and mm thickness. The films are thick ( nm) and were produced over 4 days in a kV AC discharge in Methane and N2 at Torr and at K. Preparation and characterization methods of tholins made by arc discharge—as the ones used here—have been described before 36, 37. This preparation method yields tholins that are similar but not identical to the ones prepared at lower pressure. However, the higher pressure is necessary to obtain a film thick enough for use in these experiments. More details and comparisons can be found in the recent literature 20, 37, 36, 15. Characterization using Fourier-transform ion cyclotron mass spectrometry is available as well 38. A Fourier transform infrared (FTIR) spectrum of the sample prior to exposure to hydrogen is shown in 1.

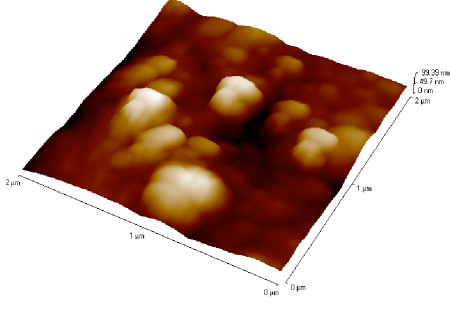
Each sample was sent in a sealed pouch and was mounted on the sample holder while working under a flow of dry nitrogen. The vacuum chamber was pressurized with dry nitrogen gas before the insertion of the sample holder. Several samples were used in the experiments; for cleaning purposes, while in vacuum, the samples were taken to K. One of them was also analyzed using an Atomic Force Microscope (AFM) (KLA-Tecnor P16+). 2 shows that on a m linear scale, there is a height-to-height variation of nm.
2.2 Experimental Procedures
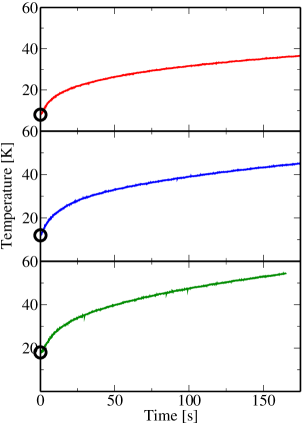
In temperature programmed desorption (TPD) experiments, the surface is first exposed to beams of atoms or molecules, at a fixed sample temperature and for a set amount of time. The sample temperature is then ramped up and the products desorbing from the surface are detected in real time. In the experiments presented here, we start the heating at a rate of about Ks that decreases to Ks eventually. During the experiment the amount of gas particles detected within a small (and constant) time interval is recorded. Simultaneously, we measure the sample temperature (see 3 for an example). To be able to compare several desorption measurements, we need to convert the rate to the detection “rate” with respect to temperature . In practice, we first fit a function to the temperature ramp ( corresponds to the start of heating). From this we determine , unaffected by noise in the original measurement. We then obtain
| (1) |
In the rate equation simulation we use a similar procedure. After every time step of the Runge-Kutta procedure we calculate the temperature change during that step, according to the fit for . From this we directly obtain the value of in the simulation.
The shape and the position of peaks in provide information on the kinetics and energetics of the reactions, as illustrated below. In the experiment performed using simultaneous H and D beams, one probes the amount of HD formed on the surface. HD can form on the surface either rapidly (compared to laboratory time scales) due to fast diffusion, essentially while the sample is still being irradiated with H and D, or it can form during the heat pulse when the H and D atoms that became adsorbed on the surface during the irradiation phase become mobile, encounter each other and form HD.
The fluxes of the beams are measured using the rotatable quadrupole mass spectrometer without exposing the samples to the beams. The detector is placed between the beam lines (which are apart) and the signals are recorded in real time. The measured effective beam density reaching the surface (after chopping) is cm-2 s-1. The effective flux to the surface is estimated as follows. We assume a density sitescm2 of adsorption sites on the tholin surface. This is a reasonable value based on data for other materials such as silicates 5. We thus obtain an effective flux of monolayers (ML)s.
3 Experimental Results
3.1 Eley-Rideal Prompt Reaction
In the “prompt reaction” scheme, a D atom abstracts a hydrogen atom on the surface, forming an HD molecule which leaves the surface. Such reaction has been observed in H-plated metals and graphite and on H-loaded amorphous carbon. The typical cross section is expected to be of the order of a few Å2 28, 29, 30. However, as already mentioned in the Introduction, a much smaller value of Å2 was found on H-loaded amorphous carbon 12. During the irradiation phase, the detector is positioned to measure any HD coming off the surface. For irradiation of H and D on tholin samples at low temperature, we find this contribution indistinguishable from the background. We thus conclude that the prompt reaction mechanism is inefficient under the physical conditions used here.
3.2 Langmuir-Hinshelwood Reaction
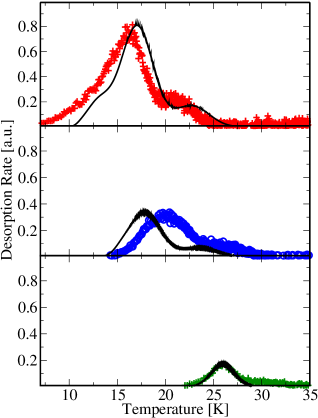
These experiments are similar in methodology to the ones we carried out on interstellar dust grain analogues 35, 6. In 4 we present the desorption rate of HD molecules vs. temperature, after irradiation of HD molecules on the surface at surface temperatures of K, K and K. The irradiation time was s at K, while for the higher temperatures the sample was irradiated for s. The peak positions of a trace can be related to the activation energy of desorption 39. The trace obtained after irradiation at K consists of two peaks—a large peak at low temperature and a small peak at a somewhat higher temperature. This indicates that there are at least two types of adsorption sites for HD molecules on the tholin surface. The relative areas below the two peaks suggest that there is a large number of shallow binding sites and a much smaller number of deep binding sites. The trace obtained after irradiation at K exhibits a similar shape; however, its peak heights are decreased and its low-temperature edge is shifted to higher temperatures. This can be explained by the fact that at a surface temperature of K those molecules adsorbed in shallow sites may quickly desorb already during irradiation. This effect is even more pronounced in the case of irradiation at K, where the low-temperature peak has completely vanished.
A similar set of TPD traces for D2 molecules is shown in 5. Irradiation temperatures and times are as for the HD case. Everything we said about the traces for HD molecules applies here as well, but the peaks of traces of D2 desorption are shifted to higher temperature with respect to the peaks of HD. This is due to the isotope effect. If we take the trapping potential to be a harmonic oscillator with an (unknown) “spring” constant , then the lowest energy level for a molecule of mass in this potential is . The higher atomic mass of D2 molecules therefore leads to a lower ground state energy, which in turn leads to a larger activation energy for desorption.
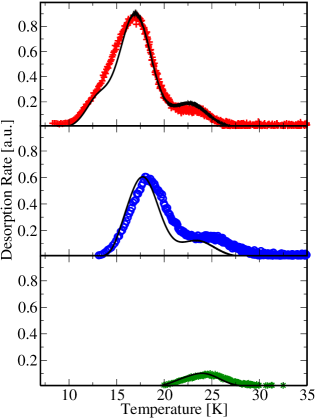
As previously found in the analysis of HD and D2 formation on amorphous silicates at different temperatures 6, there is a common trailing edge in the three traces. This corroborates our fundamental assumption that the frequency and magnitude of certain energy barriers are properties of the surface morphology, and as such do not depend on the surface temperature during irradiation. An analysis of the shapes of these traces provides information on the distribution of binding energies, as we will show below.
LABEL:fig:H-D-at,fig:D-at show TPD curves after irradiation with H and D atoms and detecting HD, and with only D atoms and detecting D2, respectively. The irradiation time is s throughout, and irradiation temperatures are K, K and K. In both cases, for HD as well as for D2 detection, we observe that the traces have shapes very similar to their corresponding counterpart obtained from irradiation with molecules (LABEL:fig:HD-mol,fig:D2-mol). Depending on the irradiation temperature, however, peaks of the TPD curves obtained by the association of atoms are shifted to higher temperatures relative to the ones obtained after irradiation with molecules. We observe this shift for both HD and D2 formation for the intermediate irradiation temperature of K. We cannot explain this feature easily, and will return to this in our analysis in 5. For the case of HD, a comparison between molecule and atomic irradiation is shown in 8. Note that the shift between the bottom panels of LABEL:fig:HD-mol,fig:H-D-at, and of LABEL:fig:D2-mol,fig:D-at, respectively, first and foremost reflects the fact that atomic irradiation was done at K, while molecular irradiation was done at K. Performing both types of experiment after irradiation at K, we still found a shift (not shown), but of significantly smaller size ( K) than for the comparison at K.
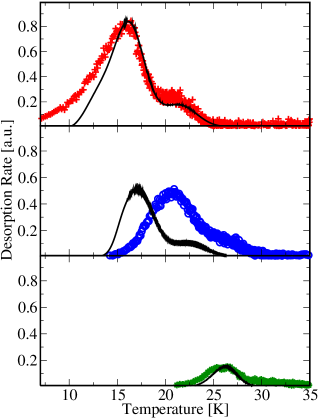
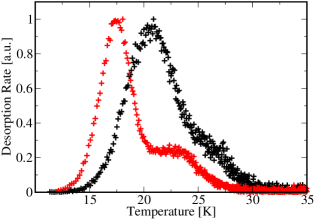
The diminishing intensity of the signal with increasing irradiation temperature indicates that the processes involved in the formation of HD from H and D atoms are governed by weak physical adsorption forces, implying lower sticking probability of H and D at higher sample temperature. The widths of the traces are larger than the ones expected if there were only a single activation energy for desorption. Rather, similarly to what we detected in the formation of HD on amorphous silicates 6 but to a lesser degree, there is a range of activation energies.
We further note that the trailing edges of traces obtained after irradiation at different temperatures do not coincide for atomic irradiation, in contrast to what we found for molecular irradiation. This implies that the process of molecular formation (whether during irradiation or during the subsequent heating) affects the distribution of molecules to the different types of adsorption sites, in a way that depends on the surface temperature.
4 Rate Equation Model
In all TPD curves considered here we observe that most of the hydrogen is desorbed well before K. We therefore conclude that the particles are trapped in physisorption potentials and are only weakly adsorbed. We also assume that the mechanism of formation of H2 (or HD or D2) is the LH scheme, as there is no evidence of prompt reaction.
The analysis of TPD experiments usually starts with the Polanyi-Wigner expression for the desorption rate,
| (2) |
In this expression, is the total number of atoms on the surface, is the order of desorption, and is the vibration frequency of the particle in the potential well where it is bound, also referred to as the attempt frequency. The effective activation energy is denoted by , and is the time-dependent surface temperature. One important assumption we make here is that all the surface properties, such as the attempt frequency and the energy barriers, are independent of temperature and population. This assumption is justified due to the low coverage of the surfaces during a TPD experiment ( ML), but it might be violated at high coverages 40. Analyses of TPD experiments using rate equations have been reported previously 32, 41, 34. Here we introduce two models for describing the TPD experiments (for molecule as well as for atomic irradiation), a complete model accounting for all possible processes in the system, and a reduced one. We show that the reduced model gives good results in fitting the experimental data.
4.1 Complete Model for Irradiation with Molecules
We first introduce the model for molecules only. It will be modified below to deal with atoms and their reactions. Molecules of a given species are sent onto the surface, and if they impinge onto an empty adsorption site, they stick to it with a certain probability. The rate at which particles stick to the (empty) surface is the effective flux (in MLs). Afterwards they may hop from a site to any of the neighboring sites, and may also desorb. Throughout we assume the rates for both processes to be thermally activated, with a common fixed attempt frequency (taken standardly to be s-1). The hopping rate is given by
| (3) |
where is the activation energy for diffusion, and is the time-dependent temperature of the surface during the TPD experiment. The activation energy in general depends on the particle species and the type of site it is located at, both of which will later appear as indices on as well as on . Similarly, the desorption rate reads
| (4) |
where is the activation energy for desorption, which can also depend on the site type and the species. As the surface temperature increases, both the hopping rate and the desorption rate rapidly increase.
We now make several assumptions. First, we assume a given density of adsorption sites on the surface, each containing at most one molecule. We recognize that for the diffusion and desorption of H2 (HD and D2) molecules the surface is not homogeneous. We model this by using several types of sites, distinguished by Greek indices in our notation. Each type has its own average energy barrier for diffusion, , and for desorption, . Additionally, the energies for specific sites of type are distributed according to a normal distribution around the average energy. The standard deviation of this normal distribution is labeled . In order to retain detailed balance we set , where is an overall constant. An analogous relation holds for the desorption and diffusion barrier of each individual site, hence both energy distributions have the same standard deviation . Each type of sites constitutes a fraction of the entire surface such that .
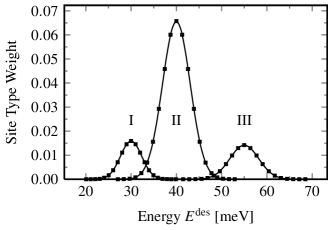
In a rate equation model, we cannot employ a continuous distribution of energies, and neither can we model a particular realization of surface site energies. (Note that a continuous distribution of binding energies can be obtained by direct inversion of TPD traces 10, 42, 43, but this method does not include the possibility of simultaneous recombination processes.) We approximate the distribution of binding energies of a certain site type around the mean value by using different binding energies as samples for each type. The energy values are equidistantly spaced between and . The fraction of sites at any given sample energy is chosen proportional to the value of the normal probability distribution function with mean and standard deviation at that energy. This sampling of energies is schematically depicted in 9.
The individual sample will be denoted by a Latin index, e.g., , and the weights of sites of the sample energies add up to the total fraction of the ‘fundamental’ site type, , hence again. For the rate equation model, we effectively just have a large number of different site types, and we do not need to distinguish what basic type of site they belong to. Hence, we shall still speak of different ‘types’ of sites also for the different .
Let be the coverage of molecules on the surface (in ML) and that part of the total surface coverage which is trapped in sites of type . Then and . The set of rate equations for our model reads
| (5) |
The first term on the right hand side of 5 covers the incoming flux of molecules. The value of the effective flux is found as described in 2.2. This term also accounts for LH rejection, such that all molecules impinging on top of a site already occupied are rejected. The second term describes the diffusion of molecules, arriving from other sites . Likewise, the third term is the loss of molecules by diffusion from sites of type to sites of any other type . The hopping rate on sites of type is determined by the activation energy for diffusion on such sites, . The last term models desorption of molecules, with a desorption rate determined by , the activation energy for desorption from a site of type . The rate at which molecules are detected during the experiment is therefore proportional to the total desorption rate
| (6) |
This model accounts for all possible processes of motion of molecules: molecules can diffuse from any site type to any other site type and they can desorb.
To obtain the energy barriers for molecule diffusion and desorption, we examined the TPD curves of experiments in which molecular HD or D2 were deposited on the surface during the irradiation phase and were later desorbed from the surface as the temperature increased (see LABEL:fig:HD-mol,fig:D2-mol). These curves show a broad distribution of temperatures at which molecules desorb from the surface, and two or three desorption peaks within this range. We therefore use three average activation energy barriers, each with an additional normal distribution of the energy (totaling sample energies ). The fraction (of sites of type ) found here is kept constant for all fits and experiments, see 5 for the results.
4.2 Complete Model for Irradiation with Atoms
We will now modify the model to describe the following situation. H atoms (precisely, H and D, or only D) are sent onto the surface and stick to empty sites with a certain effective flux. Atoms explore the surface just like molecules, and they can desorb as well. Additionally, when two atoms meet, they form a molecule.
To keep the number of parameters small, we do not distinguish between H and D atoms in our model, both species implicitly sharing the activation energies for desorption and diffusion. Experimentally, however, the isotope effect is observed and yields different energies for HD vs. DD experiments. The implications of this approximation have been examined 31. The activation energies of desorption and diffusion of D atoms were raised by about (this is comparable to the isotope effect measured in H and D scattering experiments from a graphite surface 44). The TPD traces hardly changed because they mainly depend on the energetics of the most mobile species.
All assumptions detailed in the molecule model will remain in effect, including the uniform standard attempt frequency. Each adsorption site can now hold either an H or a D atom, or an HD or D2 molecule. To simplify equations we assume that molecules and atoms on the surface do not encounter each other while hopping; this is justified due to the low coverage during TPD experiments. In contrast to the situation for molecules, we further assume that all sites are identical both for hopping and desorbing of atoms, hence the energy barriers and are uniform all over the surface. Here and in the following, all quantities will get an extra index for the atom or molecule species. However, by our above comment, we do not distinguish between H and D, so that all atoms are labeled H, and all molecules H2.
We denote by the coverage of H atoms on the surface (in ML) and by that part of the total surface coverage of H2 molecules (in ML) which is trapped in sites of type . Consequently, and . The new set of rate equations is now given by
| (7a) | ||||
| (7b) | ||||
The first term on the right hand side of 7a describes the incoming flux of atoms, including LH rejection. is the effective flux as explained before, only for atoms. The second term describes the desorption of atoms. The desorption rate is governed by as specified above. The last term in 7a is the recombination term, i.e., the rate of molecule formation on the surface. Here the hopping rate is determined by . 7b is the set of equations describing the dynamics of the molecules on the surface. The first term in 7b consists of two factors. The second factor, is the rate of molecule production as given by 7a; we assume that all molecules remain on the surface once they are formed, as observed experimentally. The first factor of this term distributes the molecules between the different types of sites according to the distribution of free sites among them. The remaining terms of 7b have been explained above in the molecular model. The only difference is in the notation, since all quantities now carry the additional species label.
4.3 Reduced Models
The complete model for irradiation with molecules successfully fits the TPD experiments (not shown), but the best fits are obtained for energy barriers for the diffusion of molecules which are much larger than the barriers for desorption. This means that the process of molecular diffusion on the surface can be neglected in all models.
Neglecting the two corresponding terms (diffusion of molecules to and from sites of type ) in the model of molecules only, 5, we obtain the simple model
| (8) |
For irradiation with atoms instead, Eqs. (\plainrefratefull), the reduced model takes the form
| (9a) | ||||
| (9b) | ||||
As we show in the next section, these reduced models provide good fits to the experimental data. We use these models to obtain our results on activation energies and to produce the fits seen in Figures \plainreffig:HD-mol to \plainreffig:D-at.
5 Analysis of Experimental Data
We now use the rate equations presented above to obtain the parameters that describe the dynamics of atoms and molecules on the tholin surface. The appropriate set of rate equations, i.e., Eqs. (\plainrefratefullmol), (\plainrefratefull), (\plainrefratesimmol) or (\plainrefratesim), respectively, is numerically integrated using a Runge-Kutta stepper. The result of that integration is a TPD curve that is then compared with the experimental one. The parameters are iteratively adjusted to obtain the best agreement.
5.1 Irradiation with Molecules
The TPD curves of HD and D2 molecules (LABEL:fig:HD-mol,fig:D2-mol) on tholin surfaces show a very broad distribution with two distinctive peaks, or one large peak and a shoulder at higher temperatures. The large low-temperature peak is most accurately described as two overlapping peaks, so that the entire curve is best described assuming desorption of molecules from three different types of sites, each with normally-distributed activation energies.
The fitting curves for HD and D2 irradiation at surface temperatures of K, K and K are presented in LABEL:fig:HD-mol,fig:D2-mol. The activation energies we find for desorption of molecules are given in 1. Recall that diffusion of molecules has been found to be negligible in our fitting procedure.
| Fraction of sites | ||||||
| 0.13 | 0.71 | 0.16 | ||||
| MeanmeV, standard deviationmeV | ||||||
| Molecule | ||||||
| HD | 30 | 3.3 | 40 | 4.3 | 55 | 4.5 |
| D2 | 30 | 3.3 | 42 | 4.3 | 58 | 4.5 |
The shift of the energy barriers from HD molecules to slightly higher values for D2 molecules can be understood in light of their different atomic mass as discussed above. The fact that the leading edge of the K curves is not reproduced well by the fit is probably due to the fact that the model does not include very shallow sites. Though one can add more site types to account for these features, this increases the computational cost and introduces additional fitting parameters, reducing the conclusiveness of our results. The essential properties of the surface can be captured by the three energies found here.
5.2 Irradiation with Atoms
TPD curves of tholin surfaces irradiated with H and D atoms (HD) or D atoms (DD) at several temperatures are presented in LABEL:fig:H-D-at,fig:D-at, respectively. In these experiments atoms are deposited on the surface, where they diffuse and recombine. The resulting molecules stay on the surface—according to what is observed experimentally—and desorb later during the TPD. The only parameters that need to be fitted to these experiments are the energy barriers for diffusion and desorption of atoms, and .
The experiments presented here were performed at three different irradiation temperatures, K, K and K. We observe that the desorption peaks of the K experiments with atoms correspond to the desorption peaks of the experiments with molecules. Therefore, atoms have to become sufficiently mobile to form molecules already during the early stages of the TPD experiment. An acceptable fit of the TPD data is obtained only if the energy barrier for diffusion of atoms is at most meV. The corresponding energy barrier for desorption of atoms is then found as meV.
As seen in LABEL:fig:H-D-at,fig:D-at, the model correctly reproduces the general tendency of the traces to shift to higher temperatures if the irradiation temperature is increased. For irradiation at K, however, it lags behind the experimental data by K, and the predicted peak position still closely resembles the one found for irradiation with molecules. When atoms are irradiated at a surface temperature of K, the fit is very good again.
Our comments at the end of 3 might suggest that the shift in TPD traces could be better reproduced by a model with several types of sites for atoms (corresponding to the types for molecules). Molecules produced on a certain type of site could then add specifically to this type’s population, and their distribution (affected by atomic processes) might become more complex. We checked that such a model increases computational challenges, without improving the fits to experimental data.
6 Discussion
The formation of molecular hydrogen in space environments is of interest to several research fields: to astrophysicists studying star formation, since H2 facilitates the cooling of a gravitationally collapsing cloud by absorbing UV light and re-radiating it in the IR (where the cloud is transparent); to astrochemists, because H2 intervenes in most schemes of formation of other molecules in space; and to planetary scientists interested in the chemistry of atmospheres of bodies such as Titan. While the first experimental studies of H2 formation were geared towards the measurement of the efficiency of the reaction 4, it was soon realized that one needed to understand the elementary steps of atom and molecule adsorption, diffusion on and desorption from heterogeneous surfaces. In the case of H interaction with tholins, experiments at higher temperatures imply that the formation of HD is governed by the abstraction of surface-bound H with D coming from the gas phase, and using IR spectroscopy it was noticed that incoming D atoms saturate some of the carbon-carbon, carbon-nitrogen, or nitrogen-nitrogen bonds of the tholin 13. Our experiments of H and D interaction with tholin surfaces are performed at a lower temperature and show that the interaction is dominated by weak adsorption forces, and that the production of HD is consistent with the LH reaction mechanism. There are changes in the bonds of H and D with the surface, see 10, due to partial saturation of CH bonds with H and D atoms, but, if there is abstraction of H, this process is overwhelmed by the HD, H2 and D2 formation according to the processes described above. A detailed study of the changes of the IR features and IR and TPD results with samples at higher temperature will be presented elsewhere. In the meantime, we can only speculate on how our results and Sekine et al.’s 13 can be reconciled.
Aside from possible differences in the reactivity of samples, it is possible that thermal energy atoms striking the surface at low temperature experience the weak long-ranged physisorption interaction, while other channels become available at higher surface temperature. In other words, H atoms might sample a precursor state. Examples of this behavior exist, such as H adsorption on Si 45.
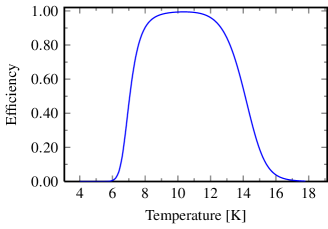
As an example of the application of our findings for the energy barriers of hydrogen on tholins, we show the implied results for the efficiency of H2 formation on the surface of tholins in an environment resembling Titan’s atmosphere. At a relevant height of about km, we use a gas phase temperature of K. The average thermal velocity of hydrogen atoms at this temperature is cms, and we take a density of cm-3 in the gas phase 21. For the density sitescm2 assumed in 2.2 we obtain a flux per site MLs. The factor in the last relation results from the ratio between the (geometrical) cross section and the surface area of a sphere.
We calculate the efficiency using the analytic solution of the steady-state rate equation, 9a with , which provides accurate results for sufficiently large grains. 11 shows that a high efficiency window is found between K and K. At temperatures below that window, diffusion of atoms from one site to the other is so slow that they are nearly immobile, and therefore the LH kinetics largely prevents sticking of impinging atoms. On the other hand at temperatures higher than K, the residence time of H atoms is very short, they do not encounter each other on the surface before they desorb, and the efficiency drops as well. For temperatures higher than this, other mechanisms might take over in which one of the partners is held on the surface by stronger adsorption forces.
Preliminary analysis of data taken at higher sample temperature ( K) shows that the HD formation rate is dramatically curtailed. The quantification of the formation of HD at these higher sample temperatures is ongoing.
7 Summary
We have studied the interaction of atomic and molecular hydrogen with tholin surfaces, using TPD experiments at low temperatures. Employing a fine-grained rate equation model to fit TPD traces, we have obtained energy barriers for the diffusion and desorption of both atomic as well as molecular hydrogen. The analysis shows that there are three types of sites for molecules, and each type is associated with a distribution of the energy barriers that can be fitted by a normal distribution. In contrast, there are no indications for a broad distribution of energy barriers for the atoms, and the data can be fitted using a single barrier. All barriers are below meV, with the implication that the interactions with the surface are only governed by weak adsorption forces. The temperature window of efficient formation of molecular hydrogen depends on the diffusion and desorption barriers of the atoms, and not on the interaction of the molecules with the surface.
We are grateful to Prof. Mark Smith of the University of Arizona for providing the samples and to Dr. Imanaka (University of Arizona) for discussions. We thank the US-Israel Binational Science Foundation for support. G.V. was supported by NSF Grant AST-0507405.
References
- Schlapbach and Züttel 2001 Schlapbach, L.; Züttel, A. Nature 2001, 414, 353–358
- Combes and Pineau des Forets 2000 Molecular Hydrogen in Space; Combes, F., Pineau des Forets, G., Eds.; Cambridge University Press: Cambridge, 2000
- Williams et al. 2007 Williams, D. A.; Brown, W. A.; Price, S. D.; Rawlings, J. M. C.; Viti, S. Astron. & Geophys. 2007, 48, 1.25–1.34
- Pirronello et al. 1997 Pirronello, V.; Liu, C.; Shen, L.; Vidali, G. Astrophys. J. Lett. 1997, 475, L69–72
- Perets et al. 2007 Perets, H. B.; Lederhendler, A.; Biham, O.; Vidali, G.; Li, L.; Swords, S.; Congiu, E.; Roser, J.; Manicò, G.; Brucato, J. R.; Pirronello, V. Astrophys. J. Lett. 2007, 661, L163–166
- Vidali et al. 2009 Vidali, G.; Li, L.; Roser, J. E.; Badman, R. Adv. Space. Res. 2009, 43, 1291–1298
- Pirronello et al. 1999 Pirronello, V.; Liu, C.; Roser, J. E.; Vidali, G. Astron. Astrophys. 1999, 344, 681–686
- Roser et al. 2003 Roser, J. E.; Swords, S.; Vidali, G. Astrophys. J. Lett. 2003, 596, L55–58
- Hornekær et al. 2003 Hornekær, L.; Baurichter, A.; Petrunin, V. V.; Field, D.; Luntz, A. C. Science 2003, 302, 1943–1946
- Amiaud et al. 2006 Amiaud, L.; Fillion, J. H.; Baouche, S.; Dulieu, F.; Momeni, A.; Lemaire, J. L. J. Chem. Phys. 2006, 124, 094702
- Langmuir 1918 Langmuir, I. J. Am. Chem. Soc. 1918, 40, 1361–1403
- Mennella 2008 Mennella, V. Astrophys. J. Lett. 2008, 684, L25–28
- Sekine et al. 2008 Sekine, Y.; Imanaka, H.; Matsui, T.; Khare, B. N.; Bakes, E. L. O.; McKay, C. P.; Sugita, S. Icarus 2008, 194, 186–200
- McKay et al. 2001 McKay, C. P.; Coustenis, A.; Samuelson, R. E.; Lemmon, M. T.; Lorenz, R. D.; Cabane, M.; Rannou, P.; Drossart, P. Planet. and Space Sci. 2001, 49, 79–99
- Szopa et al. 2006 Szopa, C.; Cernogora, G.; Boufendi, L.; Correia, J. J.; Coll, P. Planetary and Space Science 2006, 54, 394–404
- Khare et al. 1984 Khare, B. N.; Sagan, C.; Thompson, W. R.; Arakawa, E. T.; Suits, F.; Callcott, T. A.; Williams, M. W.; Shrader, S.; Ogino, H.; Willingham, T. O.; Nagy, B. Advances in Space Research 1984, 4, 59–68
- Sagan and Khare 1979 Sagan, S.; Khare, B. N. Nature 1979, 277, 102–107
- Coll et al. 1999 Coll, P.; Coscia, D.; Smith, N.; Gazeau, M.-C.; Ramírez, S. I.; Cernogora, G.; Israël, G.; Raulin, F. Planet. and Space Sci. 1999, 47, 1331–1340
- Imanaka et al. 2004 Imanaka, H.; Khare, B. N.; Elsila, J. E.; Bakes, E. L. O.; McKay, C. P.; Cruikshank, D. P.; Sugita, S.; Matsui, T.; Zare, R. N. Icarus 2004, 168, 344–366
- Quirico et al. 2008 Quirico, E.; Montagnac, G.; Lees, V.; McMillan, P. F.; Szopa, C.; Cernogora, G.; Rouzaud, J.-N.; Simon, P.; Bernard, J.-M.; Coll, P.; Fray, N.; Minard, R. D.; Raulin, F.; Reynard, B.; Schmitt, B. Icarus 2008, 198, 218–231
- Lebonnois et al. 2003 Lebonnois, S.; Bakes, E. L. O.; McKay, C. P. Icarus 2003, 161, 474–485
- Young et al. 1984 Young, Y. L.; Allen, M.; Pinto, J. P. Astrophys. J. Suppl. 1984, 55, 465
- Duley and Williams 1984 Duley, W. W.; Williams, D. A. Interstellar Chemistry; Academic Press, 1984
- Bakes et al. 2003 Bakes, E. L. O.; Lebonnois, S.; Bauschlicher, C. W., Jr.; McKay, C. P. Icarus 2003, 161, 468–473
- Duley 1996 Duley, W. W. Mon. Not. Roy. Astron. Soc. 1996, 279, 591–594
- Harris and Kasemo 1981 Harris, J.; Kasemo, B. Surf. Sci. 1981, 105, L281–287
- Rettner 1994 Rettner, C. T. J. Chem. Phys. 1994, 101, 1529–1546
- Eilmsteiner et al. 1996 Eilmsteiner, G.; Walkner, W.; Winkler, A. Surf. Sci. 1996, 352–354, 263–267
- Khan et al. 2007 Khan, A. R.; Takeo, A.; Ueno, S.; Inanaga, S.; Yamauchi, T.; Narita, Y.; Tsurumaki, H.; Namiki, A. Surf. Sci. 2007, 601, 1635–1641
- Zecho et al. 2002 Zecho, T.; Güttler, A.; Sha, X.; Jackson, B.; Küppers, J. J. Chem. Phys. 2002, 117, 8486
- Vidali et al. 2007 Vidali, G.; Pirronello, V.; Li, L.; Roser, J.; Manicó, G.; Congiu, E.; Mehl, H.; Lederhendler, A.; Perets, H. B.; Brucato, J. R.; Biham, O. J. Phys. Chem. A 2007, 111, 12611–12619
- Katz et al. 1999 Katz, N.; Furman, I.; Biham, O.; Pirronello, V.; Vidali, G. Astrophys. J. 1999, 522, 305–312
- Manicò et al. 2001 Manicò, G.; Ragunì, G.; Pirronello, V.; Roser, J. E.; Vidali, G. Astrophys. J. Lett. 2001, 548, L253–256
- Perets et al. 2005 Perets, H. B.; Biham, O.; Manicó, G.; Pirronello, V.; Roser, J.; Swords, S.; Vidali, G. Astrophys. J. 2005, 627, 850–860
- Vidali et al. 2005 Vidali, G.; Roser, J.; Manicó, G.; Pirronello, V.; Perets, H. B.; Biham, O. J. Phys.: Conf. Ser. 2005, 6, 36–58
- Neish et al. 2010 Neish, C. D.; Somogyi, Á.; Smith, M. A. Astrobiol. 2010, 10, 337–347
- Neish et al. 2009 Neish, C. D.; Somogyi, Á.; Lunine, J. I.; Smith, M. A. Icarus 2009, 201, 412–421
- Sarker et al. 2003 Sarker, N.; Somogyi, A.; Lunine, J. I.; Smith, M. A. Astrobiol. 2003, 3, 719–726
- Yates 1985 Yates, J. T. In Methods of Experimental Physics, Solid State Physics: Surfaces; Academic Press: New York, 1985; Vol. 22, p 425
- Barton et al. 1978 Barton, S. S.; Harrison, B. H.; Dollimore, J. J. Phys. Chem. 1978, 82, 290–294
- Cazaux and Tielens 2004 Cazaux, S.; Tielens, A. G. G. M. Astrophys. J. 2004, 604, 222–237
- Barrie 2008 Barrie, P. J. Phys. Chem. Chem. Phys. 2008, 10, 1688–1696
- Vidali and Li 2010 Vidali, G.; Li, L. J. Phys.: Condens. Matter 2010, 22, 304012
- Ghio et al. 1980 Ghio, E.; Mattera, L.; Salvo, C.; Tommasini, F.; Valbusa, U. J. Chem. Phys. 1980, 73, 556–561
- Tok et al. 2003 Tok, E. S.; Engstrom, J. R.; Kang, H. C. J. Chem. Phys. 2003, 118, 3294–3299