Quarantine generated phase transition in epidemic spreading
Abstract
We study the critical effect of quarantine on the propagation of epidemics on an adaptive network of social contacts. For this purpose, we analyze the susceptible-infected-recovered (SIR) model in the presence of quarantine, where susceptible individuals protect themselves by disconnecting their links to infected neighbors with probability , and reconnecting them to other susceptible individuals chosen at random. Starting from a single infected individual, we show by an analytical approach and simulations that there is a phase transition at a critical rewiring (quarantine) threshold separating a phase () where the disease reaches a large fraction of the population, from a phase () where the disease does not spread out. We find that in our model the topology of the network strongly affects the size of the propagation, and that increases with the mean degree and heterogeneity of the network. We also find that is reduced if we perform a preferential rewiring, in which the rewiring probability is proportional to the degree of infected nodes.
pacs:
64.60.Aq, 87.10.Mn, 89.75.-kI Introduction
The representation of interactions in a human society as a complex network, where nodes and links play the respective roles of individuals and their contacts, has been useful for modeling, studying, and understanding many problems in epidemiology Newman ; Vespignani-book . Usually it is assumed that diseases evolve faster than the topological evolution of the underlying network, so that the links of the network can be regarded as static. With modern mass media, however, the presence of an epidemic can be broadcast much faster than disease propagation. This information will inevitably change the behavior of the individuals comprising this network as, for example, they try to avoid contacts with infected people. In this way a feedback loop between the state of individuals and the topology of the network is formed. Networks that exhibit such feedback are called adaptive or coevolutionary networks Gross ; Schwartz ; Gross2 ; Gross3 ; SanMiguel .
Public health services are constantly searching for new ways to try to reduce the spread of diseases. Interventions like vaccination Anderson_May or total closure of workplaces and schools are very effective, but come with a high economic cost. As a less expensive alternative we examine here the effectiveness of a “quarantine” strategy, where healthy people are “advised” to avoid contacts with individuals that carry the disease. That is, a healthy person has a chance to suppress a contact with an infected neighbor and form a new tie with another healthy peer (rewiring). The value of this rewiring probability could depend, for instance, on the concern that the society has about the disease and, as suggested above, in a globalized world this concern will depend on the broadcast news. The degree of media attention about the disease is a parameter that could be controlled by public health services. Indeed, it is known that spontaneous quarantine in the recent H1N1 pandemic was found to have a large impact in reducing the final size of the epidemic H1N1 .
Based on these observations, we propose two strategies for the propagation of epidemics on an adaptive network, in which individuals alter their local neighborhoods with constant quarantine probability as described above, and systematically study the effect that the quarantine has on epidemic spreading. We find a phase transition at a critical threshold above which the epidemic is stopped from spreading. We show also how the epidemic spreading in the presence of quarantine depends on the contagion and recovery parameters. More importantly, we find that the initial structure of the network plays an essential role in disease propagation at criticality, unlike in previous related models Gross3 ; Shaw ; Zanette ; Funk where results only depend on the average network connectivity. We also introduce a generalized form of quarantine, where the probability of rewiring is proportional to the degree of the infected nodes, producing a more efficient isolation of the nodes with high degree. This preferential rewiring is more efficient than the case with constant.
II Analytical approach
We consider the susceptible-infected-recovered (SIR) epidemic spreading model, which is well established and accurately describes diseases such as seasonal influenza, SARS, or AIDS Anderson_May ; Colizza . Initially, all nodes are in the susceptible state (), with one node chosen at random (seed) in the infected state (). In the first strategy, strategy , at each time unit, every infected node in the network tries to transmit the disease to each susceptible neighbor with infection probability . If does not get infected, then with rewiring probability it disconnects its link from and reconnects it to another randomly chosen susceptible node, different from its present neighbors. Thus, the rewiring probability measures how fast susceptible nodes react to the disease (the quarantine probability). Infected nodes recover () after a fixed recovery time since they first became infected, remaining in the recovered state forever.
To estimate we start by assuming that the network has a tree structure tree , so that the disease spreads out from the seed and reaches a susceptible node through only one of its neighbors . Then, if becomes infected at time , the probability that becomes infected by at time , with , is . This is the probability that has neither become infected nor disconnected from up to time , times the probability that succeeds in transmitting the disease to at time . Therefore, the overall probability that becomes infected before recovers is given by the sum
| (1) | |||||
This expression for the transmissibility is equivalent to the corresponding expression in the standard SIR model Newman , but with a non-infection probability , instead of . When , Eq. (1) reproduces the known value for the transmissibility for the SIR model on static networks Newman . In this formulation plays the role of a control parameter of the transmissibility: for fixed values of and , can be reduced by increasing . By reducing we can go from a regime in which the epidemic spreads over the population (epidemic phase) to another regime where the disease cannot spread (disease-free phase). The transition from the disease-free phase to the epidemic phase corresponds to the average number of secondary infections per infected node becoming larger than one, allowing the long-term survival of the disease and thus ensuring the epidemic spreads to a large fraction of the population. In our problem, the expected number of susceptible neighbors that a node has when it just becomes infected is given by , where is called the branching factor, and and are the first and second moments, respectively, of the degree distribution . Since is the overall probability to infect a neighbor, the mean number of secondary infections per infected node is
| (2) |
The infection will die out if each infected node does not spawn on average at least one replacement, so for a very large system, the critical point is given by the relation , or
| (3) |
The transition between free-disease phase and epidemic phase is analogous to the static link percolation problem Havlin_Book , in which each link in a network is occupied with probability and empty with probability . When becomes smaller than a percolation threshold , the giant connected component disappears. In general, depends on the size of the network Wu , but in the thermodynamic limit it can be expressed as Cohen . Identifying with the transmissibility , and using the relation between and we find that on the epidemic/disease-free transition line:
| (4) |
This result shows that the transition point depends on the initial topology of the network through the moments of the degree distribution, as we shall confirm via simulation.
A better strategy would be try to avoid the contact between susceptible and infected individuals before the attempt to infection, i.e., only avoid the contact when you know an individual is sick. In this second strategy, strategy B, at each time unit every susceptible node attached to an infected node disconnects its link from with probability and reconnects it to another randomly chosen susceptible node, different from its present neighbors. If does not rewire its link, the infected node tries to infect it with infection probability . Notice that . For this strategy Eq.(1) is replaced by
| (5) |
Comparing Eq.(1) and Eq.(5) we see that for identical values of and . The new condition for disease to die in strategy B out follows from Eq.(5)
| (6) |
The two strategies represent different scenarios depending on the knowledge of the state of infection of the nodes. For strategy A, susceptible nodes have no information about the state of their neighbors until they are in physical contact. In contrast, for strategy B susceptible nodes know the state of their neighbors before they are in physical contact. We will show that this difference in the knowledge of the states of the nodes results in strategy B being more effective at stopping epidemic spreading.
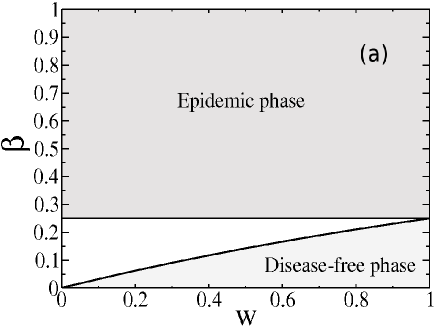
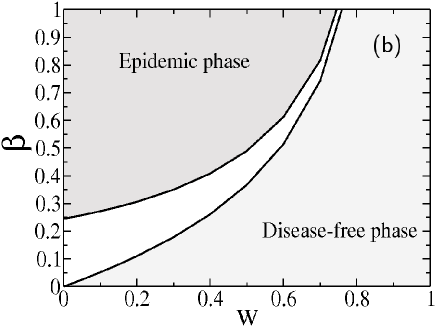
Fig. 1 shows phase diagrams in the plane for strategy A and strategy B, obtained by the numerical solutions of Eq. (3) and Eq. (6) respectively, for a network with (). Two phases emerge: the epidemic phase for , and the disease-free phase for . The location of the critical line separating the two phases depends on the recovery time . Fig. 1(a) illustrates the two limiting cases for strategy A: (upper curve) and (lower curve), which are given by the expressions and . Therefore, the pairs of values in the region above the curve are always in the epidemic phase, and below the curve are always in the disease-free phase. A striking consequence is that if is larger than the percolation threshold , the propagation of an epidemic cannot be stopped, even with the largest rewiring probability . Thus, strategy A is not an efficient mechanism to control an epidemic when is higher than .
For strategy B, Fig. 1(b) illustrates the two limiting cases (upper curve) and (lower curve), which are given by the expressions and . In contrast to strategy A above, if does not diverge, i.e., the network has finite , the epidemic can always be stopped, even for . Notice that the maximum value of needed to stop a epidemic is .
Our theoretical predictions illustrate a novel feature about the dynamics of adaptive networks in SIR models. While previous adaptive SIS and SIRS models have transition values that depend only on the average connectivity of the network , and are independent of the heterogeneity or structural correlations of the initial topologyGross , our SIR model predicts dependence on the topological structure through the higher order moments of the degree distribution.
III Simulation Results
Our analytical approach predicts, through Eq. (3) and Eq. (6), a dependence of on the initial network. In order to test and explore this dependence, we performed extensive numerical simulations of our model starting from different topologies. We first used Erdös-Rényi (ER) networks with Poissonian degree distribution . Even though these types of homogeneous networks are common in nature, many real social networks are well represented by heterogeneous networks. Thus, we also used finite scale-free (SF) networks with degree distribution , where is the degree cutoff. This distribution represents networks with a finite threshold , and appears in a variety of real-world networks Aiello ; Bollobas . We only consider epidemic propagation on the largest connected cluster of the network, the giant component (GC).
In Fig. 2 we compare both strategies for ER networks. We plot as a function of , the average fraction of infected nodes , where is the size of the giant component, on a ER network. This fraction is normalized by the corresponding fraction on an identical fixed network, i.e., for the SIR model without quarantine, . We can see that for strategy B is lower than for strategy A, as expected. This relation will hold for any topology with the same (see Eq.(3) and Eq.(6)). Since strategy B is more effective, from here to the end of the paper we will show only simulation results for strategy B.
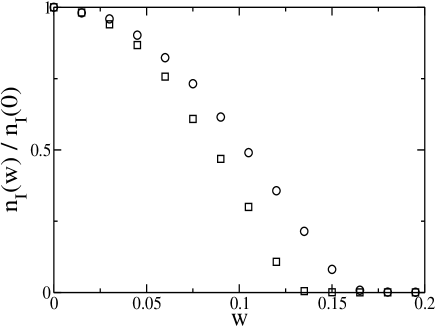
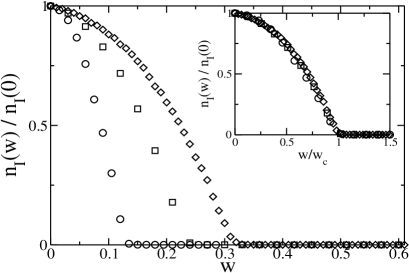
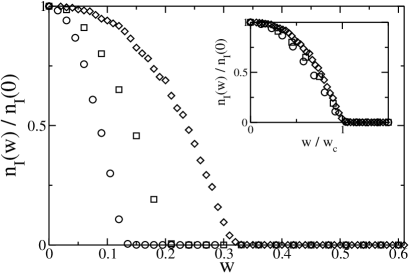
Fig. 3 shows, vs for different . In this figure, we can observe the strong effect of quarantine and the critical threshold above which approaches zero. Thus, in the disease-free phase ( only a small number of individuals get infected and the disease quickly dies out. We observe, as expected, that the values of increase with . This behavior matches the phase diagram of Fig. 1 (b), where the critical line has a positive slope. Scaling the horizontal axis by the values of obtained by numerically solving Eq. (6) collapses the curves, showing a excellent agreement between theory and simulations, as well as a scaling behavior of the form , as shown in the inset of Fig. 3.
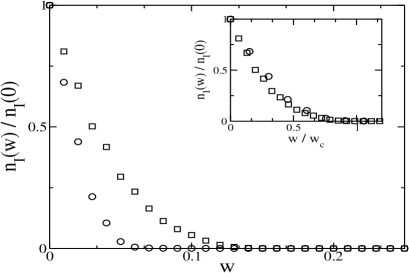
We also explored the dependence of on the connectivity of the network, by computing vs for different (see Fig. 4). We observe that increases with , due to the fact that propagation is facilitated by having more neighbors, as in the original SIR dynamics. The inset of Fig. 4 shows the collapse of all curves. Again, the good agreement between theory and simulation confirms that Eq. (6) is a valid expression of the transition point for the adaptive SIR model on ER networks.
Given that the second moment, and therefore , is large in heterogeneous networks, the critical value turns out to be larger in heterogeneous networks than in homogeneous networks with the same mean degree and size , as seen by considering Eq. (6) in the limit, where
| (7) |
Since for heterogeneous networks is much bigger than in homogeneous networks we expect that increases as the heterogeneity increases with larger . For we expect that and that the transition will eventually disappear for large heterogeneous networks.
In Fig. 5, we show simulations on scale-free networks for different values of Pc_N . In good agreement with our predictions from Eq. (7), as increases with , increases. In the inset we rescale by obtained from Eq. (6), and find good collapse (Fig. 5(inset)), confirming the general validity of Eq. (6) for heterogeneous SF networks.
In very heterogeneous networks it is well known that due to high degree nodes, propagation processes are very difficult to stop Havlin_Book ; Vespignani . Thus, a constant probability of rewiring is not effective for controlling epidemics in these networks, because such a strategy assumes all nodes have the same importance in an epidemic, ignoring the function of higher degree nodes as superspreaders. It is also well known that removing the high degree nodes of the network (targeted percolation) Havlin_Book ; Barabasi-Nature ; Cohen2001 is a more efficient method to stop propagation processes than random removal. This type of strategy is expected to be superior, but requires global information about the network.
To test this prediction, we propose a new strategy of type B where depends on the degree of the infected node, with given by the general form
| (8) |
where is a constant that controls the highest possible value of , and it is equal or smaller than , where is the largest degree of the network. For and [0,1] we recover the results for a constant value of , with . For and the rewiring increases with the degree of the infected node, and decreases with increasing . In the limit of the rewiring process is equivalent to a targeted rewiring where only the links of the highest connected node(s) are rewired. To compare the cases with and , we use the average over the network, choosing for the targeted case such that is equal to in the uniform case.
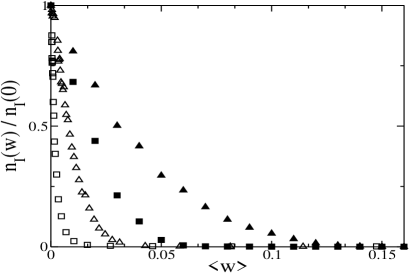
In Fig. 6 we plot as a function of for SF networks with and . As expected, for is lower than for . The preferential rewiring reduces the value of because quarantine is more effective at isolating the superspreaders.
IV Summary and conclusions
We have introduced and studied two strategies for the propagation of epidemics on evolving networks of social contacts. The states of the individuals are changed according to SIR dynamics, while the network evolves according to a quarantine mechanism based on local information, in which susceptible individuals replace their infected neighbors by other susceptible peers with probability . We demonstrated by an analytical approach, and confirmed by numerical simulations, that the size of the epidemics can be largely reduced by increasing the probability of rewiring, and that the propagation can be eventually stopped by using high enough values of . In other words, quarantine is an effective way to halt the appearance of epidemics that would otherwise emerge in the case of a static network. For strategy A, when the infection probabliy is larger than a threshold the quarantine mechanism is not effective any more and disease propagation becomes unavoidable. This is because the quarantine model only breaks contact after allowing for a chance of infection, thus for high enough infection probability, the spreading is irreversible, even with a rewiring probability of unity. For strategy B, the quarantine mechanism is effective in homogeneous networks and finite heterogeneous networks, even for infection probability equal to unity. The transition disappears only for large, very heterogeneous networks. In these scale-free networks, the critical rewiring probability becomes very large and the transition eventually disappears for large enough systems, thus only the epidemic phase is observed. This is likely due to the presence of individuals with very large connectivity that can spread the disease over a large fraction of the population, even for small infection probabilities. To confirm this, we introduced a generalized form of strategy B, where the quarantine depends on the degree of the infected nodes. This preferential rewiring isolates the superspreaders more efficiently, reducing and preserving a finite transition even for a scale-free networks. Lastly, in SIR dynamics the final frozen state, where everybody is either recovered or susceptible, is reached rather quickly —in a time of order according to our simulations— and thus an SIR network does not evolve much, so the initial topology is preserved during the entire evolution of the system. In contrast, in adaptive models with SIS or SIRS dynamics the system evolves for a very long time in the epidemic phase —times that grow exponentially larger with — thus the network moves towards a stationary topology similar to an Erdös-Rényi network, independent of the initial topology, and rendering the initial topology irrelevant. Therefore, unlike other adaptive network models of epidemic spreading, in our model the epidemic threshold has a strong correlation with the topology of the network, which remains relatively unchanged at criticality, and the social structure of connections when epidemics begin to propagate is crucial in the state of the final outbreak.
Acknowledgements.
CL, LAB, PAM, MVM thank UNMdP and FONCYT-PICT 2008/0293 for financial support. MD, SH and HES thank the DTRA, European EPIWORK project, and the ONR for financial support, SH thanks also the Israel Science Foundation.References
- (1) M.E.J. Newman, Phys. Rev. E 66 016128 (2002).
- (2) A. Vespignani and G. Caldarelli, Large Scale Structure and Dynamics of Complex Networks, (World Scientific Publishing Co, Singapore, 2007).
- (3) T. Gross and H. Sayama, Adaptive Networks: Theory, Models and Applications, (Springer, 2009).
- (4) Ira B. Schwartz and Leah B. Shaw, Physics 3, 17, (2010).
- (5) T. Gross and B. Blasius, J. R. Soc. Interface 5, 259 (2008).
- (6) T. Gross, Carlos. J. Dommar D’Lima, and B. Blasius, Phys. Rev. Lett. 96, 208701 (2006).
- (7) F. Vazquez, V. Eguíluz and M. San Miguel, Phys. Rev. Lett. 100,108702 (2008).
- (8) R.M. Anderson and R.M. May, Infectious Disease in Humans, (Oxford Univ.Press, Oxford, 1992.)
- (9) K. Eastwood, D. N. Durrheim, M. Butler, and A. Jon Responses to Pandemic (H1N1) 2009,Australia, Emerging Infectious Diseases, Vol.16, Num.8, (2010).
- (10) L. B. Shaw and I. B. Schwartz, Phys. Rev. E 77, 066101 (2008).
- (11) D. H. Zanette and S. Risau-Gusman, J. Biol. Phys. 34, 135 (2008).
- (12) Funk, S., Gilad, E., Watkins, C. and Jansen, V. A. A., Proc. Natl Acad. Sci. USA 106, 6872 (2009).
- (13) V. Colizza, A. Barrat, M. Barthélemy, and A. Vespignani, Proc. Natl. Acad. Sci. USA 103 2015 (2006).
- (14) This assumption is valid at and below criticality, as the low density of infected nodes makes collisions between infected branches (loops) unlikely.
- (15) R. Cohen, S. Havlin, Complex Networks: Structure, Robustness and Function, (Cambridge Univ. Press, 2010.)
- (16) Z. Wu, C. Lagorio, L. A. Braunstein, R. Cohen, S. Havlin, and H. E. Stanley., Phys. Rev. E 75, 066110 (2007).
- (17) R. Cohen, K. Erez, D. ben-Avraham, S. Havlin, Phys. Rev. Lett. 85, 4626 (2000).
- (18) W. Aiello, F. Chung, and L. Lu, Experimental Math. 10, 53 (2001).
- (19) R. Albert and A.L, Barabàsi, Rev. Mod. Phys., 74 47 (2002)
- (20) For we have to replace with in Eq. (4). Recently, Wu et. al Wu observed that only in networks larger than nodes is the aproximation valid.
- (21) R. Pastor-Satorras, A. Vespignani, Phys. Rev. Lett. 86, 3200 (2001).
- (22) R. Albert, H. Jeong, and A.-L. Barabási, Nature, 401, 130 (1999).
- (23) R. Cohen, K. Erez, D. ben-Avraham, and S. Havlin, Phys. Rev. Lett. 86, 3682 (2001).