1\secondaddressInstitut d’Astrophysique Spatiale, Orsay, France \secondaddressCRAL, Observatoire de Lyon, Lyon, France
How do dwarf galaxies acquire their mass
& when do they form their stars?
Abstract
We apply a simple, one-equation, galaxy formation model on top of the halos and subhalos of a high-resolution dark matter cosmological simulation to study how dwarf galaxies acquire their mass and, for better mass resolution, on over halo merger trees, to predict when they form their stars. With the first approach, we show that the large majority of galaxies within group- and cluster-mass halos have acquired the bulk of their stellar mass through gas accretion and not via galaxy mergers. We deduce that most dwarf ellipticals are not built up by galaxy mergers. With the second approach, we constrain the star formation histories of dwarfs by requiring that star formation must occur within halos of a minimum circular velocity set by the evolution of the temperature of the IGM, starting before the epoch of reionization. We qualitatively reproduce the downsizing trend of greater ages at greater masses and predict an upsizing trend of greater ages as one proceeds to masses lower than . We find that the fraction of galaxies with very young stellar populations (more than half the mass formed within the last 1.5 Gyr) is a function of present-day mass in stars and cold gas, which peaks at 0.5% at =, corresponding to blue compact dwarfs such as I Zw 18. We predict that the baryonic mass function of galaxies should not show a maximum at masses above , and we speculate on the nature of the lowest mass galaxies.
1 Introduction
There is still much debate on how galaxies acquire their mass and when do they form their stars. The mass growth of galaxies can occur either by accretion of gas that cools to form molecular clouds in which stars form or by galaxy mergers. While it is generally accepted that spiral disks form through the first mode, it is still unclear whether elliptical galaxies are built by mergers or not. We use a very simple toy model of galaxy formation (Cattaneo et al. 2010) run on top of dark matter halo merger trees to understand how dwarf galaxies acquire their mass. We also use the toy model to predict the frequency of galaxies with stellar population as young as the very metal-poor (1/50th solar metallicity) galaxy I Zw 18, for which analyses of the color-magnitude diagrams observed with HST have revealed that the bulk of the stellar population is younger than 500 Myr (Izotov & Thuan 2004) or 1.5 Gyr (Thuan et al. 2010, see also Aloisi et al. 2007).
2 How do galaxies acquire their mass?
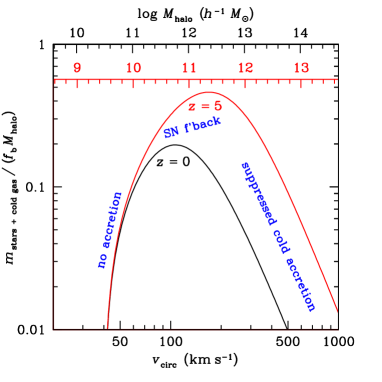
Galaxies form in DM halos, and our toy model gives the mass in stars and cold gas, , as a function of halo mass and epoch , taking into account the fact that for stars to form one needs: 1) gas accretion, which is fully quenched for low-mass halos (Thoul & Weinberg 1996; Gnedin 2000); 2) in cold form, which becomes inefficient in high-mass halos (Birnboim & Dekel 2003; Kereš et al. 2009); and 3) to retain the interstellar gas against supernova (SN) winds (Dekel & Silk 1986):
| (1) |
where = is the cosmic baryon fraction, is the minimum halo circular velocity for gas accretion, is a characteristic velocity for SN feedback, and represents the transition from pure cold to mainly hot accretion. Figure 1 describes the efficiency of galaxy formation, , at =0 and 5, with the parameters tuned to match the observed (0.1) galaxy stellar mass function (MF) of Bell et al. (2003). Galaxy formation occurs in a fairly narrow range of halo masses, that varies with redshift.
We apply equation (1) to the merger trees run on the halos and subhalos (AHF algorithm of Knollmann & Knebe 2009) of a high resolution dark matter cosmological simulation (CS) When a halo enters a more massive one, it becomes a subhalo and its galaxy becomes a satellite. The orbit of the subhalo is followed until either 1) dynamical friction (DF) causes it to fall to the halo center and necessarily see its galaxy merge with the central galaxy of the parent halo, or 2) it is tidally stripped and heated by the global potential of the halo to the point that there are insufficient particles to follow it. In this latter case (, corresponding to at ), we assume that the satellite galaxy merges with the central one after a delay set by DF, for which we adopt the timescale carefully calibrated by Jiang et al. (2008) with hydrodynamical CSs.
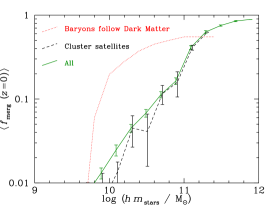
Figure 2 shows that while mergers dominate the growth of the massive galaxies (as expected from the toy model, since gas accretion is quenched at high masses), their importance drops sharply when one moves to masses below (the mass resolution is estimated at , where the median fraction of mass acquired by mergers no longer decreases with mass faster than in our reference model where baryons trace the dark matter [red dotted line]). This dominance of gas accretion at low mass is also true for the satellites of clusters (dashed line). Since observations indicate that most satellites of clusters are dwarf ellipticals (dEs), we conclude that cluster dEs are most often not built by mergers. One must resort to other mechanisms (not included in our toy model) that transform dwarf irregulars into dEs (harassment [Mastropietro et al. 2005] or ram pressure stripping [Boselli et al. 2008]).
3 When do dwarf galaxies form their stars?
In our toy model of galaxy formation, galaxy formation can only occur in halos above a critical mass (corresponding to ). We have used the halo merger tree code of Neistein & Dekel (2008) to statistically study the star formation histories (SFHs) of dwarf galaxies. We consider 24 final halo masses geometrically spaced between and , and run each halo merger tree 10 000 times. We run the toy model on top of the branches of the halo merger tree (moving forward in time) to follow the evolution of stellar mass (plus cold gas).
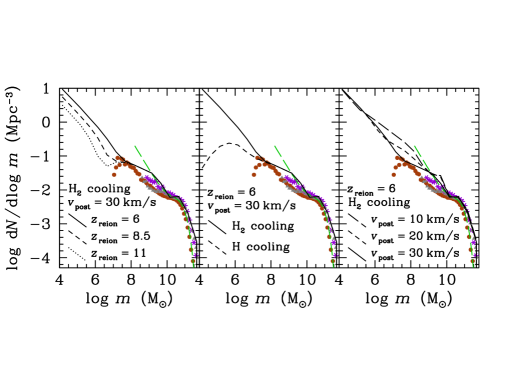
The predicted baryonic (stars + cold gas) MFs generally do not match that observed in the SDSS (Baldry et al. 2008), (but by coincidence they do match the observed stellar MFs). The left panel of Figure 3 suggests that reionization must occur late (=6). The middle panel of Figure 3 hints that, before reionization, the temperature of the IGM must be set by molecular cooling (=). The right panel indicates a good match between predicted and observed baryonic MFs when the IGM after reionization is fairly cool ().
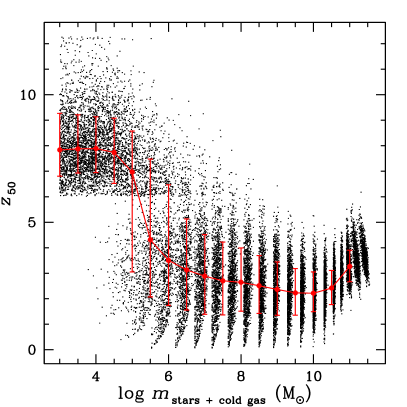

According to the left panel of Figure 4, as one proceeds from the highest final stellar (plus cold gas) masses to lower ones, one first notices that the median stellar age diminishes, qualitatively reproducing the downsizing of star formation. However this downsizing stops at masses of (roughly the masses of blue compact dwarfs) and as one proceeds to even lower masses, one notices an upsizing of stellar ages. In our model, the smallest galaxies have the bulk of their stars formed before reionization.
The right panel of Figure 4 shows that the frequency of galaxies with the bulk of their mass in stars (and cold gas remaining in the galaxy) acquired within the last 1.5 Gyr is maximal at at =. The presence of a young galaxy such as I Zw 18, whose baryonic mass is of order (Thuan et al. 2010), is consistent with our model (and robust to the parameters). However, our model predicts as many as 340 young galaxies in the SDSS, mostly at (and twice as many with ), which may present a challenge for such modeling.
4 The lowest mass galaxies
The middle panel of Figure 3 indicates that there is no peak in the best fitting galaxy (stars plus cold gas) MF, if the IGM temperature before reionization is set by molecular Hydrogen cooling (=) with a low-end slope of (in comparison the baryonic MF measured by Baldry et al. 2008 has a slope of ). If, instead, the IGM temperature before reionization is set by atomic Hydrogen cooling (=), the mass function peaks at =. This maximum is probably not caused by of our mass resolution, since no such peak is seen when the pre-reionization IGM temperature is set by cooling.
The importance of the low-end tail of the galaxy MF raises the question of the nature of very low mass objects (). Two classes of objects come to mind: Globular Clusters (GCs) and High Velocity Clouds (HVCs). However, in our model, these objects must be (or have been) associated with DM halos. While Galactic HVCs do appear to require DM (Brüns & Westmeier 2004), Galactic GCs don’t (e.g. Sollima et al. 2009), perhaps because they are closer and more tidally stripped.
References
- Aloisi et al. (2007) Aloisi, A., Clementini, G., Tosi, M., et al. 2007, ApJ, 667, L151
- Baldry et al. (2008) Baldry, I. K., Glazebrook, K., & Driver, S. P. 2008, MNRAS, 388, 945
- Bell et al. (2003) Bell, E. F., McIntosh, D. H., Katz, N., & Weinberg, M. D. 2003, ApJS, 149, 289
- Birnboim & Dekel (2003) Birnboim, Y. & Dekel, A. 2003, MNRAS, 345, 349
- Boselli et al. (2008) Boselli, A., Boissier, S., Cortese, L., & Gavazzi, G. 2008, ApJ, 674, 742
- Brüns & Westmeier (2004) Brüns, C. & Westmeier, T. 2004, A&A, 426, L9
- Cattaneo et al. (2010) Cattaneo, A., Mamon, G. A., Warnick, K., & Knebe, A. 2010, A&A, submitted, arXiv:1002.3257
- Dekel & Silk (1986) Dekel, A. & Silk, J. 1986, ApJ, 303, 39
- Gnedin (2000) Gnedin, N. Y. 2000, ApJ, 542, 535
- Izotov & Thuan (2004) Izotov, Y. I. & Thuan, T. X. 2004, ApJ, 616, 768
- Jiang et al. (2008) Jiang, C. Y., Jing, Y. P., Faltenbacher, A., Lin, W. P., & Li, C. 2008, ApJ, 675, 1095
- Kereš et al. (2009) Kereš, D., Katz, N., Fardal, M., Davé, R., & Weinberg, D. H. 2009, MNRAS, 395, 160
- Knollmann & Knebe (2009) Knollmann, S. R. & Knebe, A. 2009, ApJS, 182, 608
- Mastropietro et al. (2005) Mastropietro, C., Moore, B., Mayer, L., et al. 2005, MNRAS, 364, 607
- Neistein & Dekel (2008) Neistein, E. & Dekel, A. 2008, MNRAS, 383, 615
- Sollima et al. (2009) Sollima, A., Bellazzini, M., Smart, R. L., et al. 2009, MNRAS, 396, 2183
- Thoul & Weinberg (1996) Thoul, A. A. & Weinberg, D. H. 1996, ApJ, 465, 608
- Thuan et al. (2010) Thuan, T. X., Yakobchuk, T. M., & Izotov, Y. I. 2010, ApJ, submitted
- Yang et al. (2009) Yang, X., Mo, H. J., & van den Bosch, F. C. 2009, ApJ, 695, 900