Stellar Population Trends in S0 Galaxies
Abstract
We present stellar population age and metallicity trends for a sample of 59 S0 galaxies based on optical SDSS and NIR J & H photometry. When combined with optical g and r passband imaging data from the SDSS archive and stellar population models, we obtain radial age and metallicity trends out to at least 5 effective radii for most of the galaxies in our sample. The sample covers a range in stellar mass and light concentration. We find an average central light-weighted age of 4 Gyr and central metallicity [Z/H] 0.2 dex. Almost all galaxies show a negative metallicity gradient from the center out, with an average value of [Z/H]log(r/) -0.6. An age increase, decrease, and minimal change with radius is observed for 58%, 19%, and 23%, respectively, for a mean age gradient of agelog(r/Re) 2.3 Gyr dex-1. For 14 out of 59 galaxies, the light-weighted age of the outer region is greater than 10 Gyr. We find that galaxies with both lower mass and lower concentration have younger light-weighted ages and lower light-weighted metallicities. This mass-metallicity relation extends into the outer regions of our S0 galaxies. Our results are consistent with the formation of S0 galaxies through the transformation of spiral galaxy disks. Determining the structural component that makes up the outer region of galaxies with old outksirts is a necessary step to understand the formation history of S0 galaxies.
keywords:
galaxies: elliptical and lenticular, cD; galaxies: evolution; galaxies: formation; galaxies: photometry1 Introduction
The unique morphological status of S0 galaxies between gas-poor and gas-rich galaxies makes their origin a key ingredient of galaxy formation and evolution models. Numerous hypotheses suggest that at least a class of S0 galaxies are by-products of secondary events in galaxy formation that transform spiral galaxies into S0 galaxies, rather than products of initial conditions (Icke, 1985; Byrd & Valtonen, 1990; Moore et al., 1996; Quilis et al., 2000; Boselli et al., 2008). These theories involve the removal of gas and subsequent halting of star formation and can include the following formation mechanisms: minor interactions with other galaxies (Icke, 1985; Barnes, 2002), harassment (Moore et al., 1996), ram pressure and/or viscous stripping (Quilis et al., 2000; Kronberger et al., 2008), strangulation (Kawata & Mulchaey, 2008), and cluster tidal effects (Byrd & Valtonen, 1990). Observational evidence for a higher fraction of S0-to-spiral galaxies in local clusters as compared to higher redshift clusters certainly supports the idea that S0 galaxies are primarily created through evolutionary processes (Butcher & Oemler, 1978; Dressler & Gunn, 1983). However, obstacles to theories of a simple transformation from a spiral to a lenticular galaxy exist. For example, the bulge-to-disk ratios of S0 galaxies appear to be on average larger than those of spirals in all density regimes (Dressler, 1980), thus creating problems for a straightforward disk-quenching scenario, although not for other scenarios such as merging. The structural dichotomy between massive and low mass S0s suggests different formation scenarios for the two mass groups (van den Bergh, 1994; Bedregal et al., 2008). In this paper we study the stellar populations in S0 galaxies to better constrain their possible formation processes.
Observations of radial stellar population (hereafter, SP) gradients in S0 galaxies may help to distinguish between possible scenarios for S0 galaxy formation, since the dynamical events that lead to the production of S0s may produce or erase imprints on the galaxy’s star formation history. For example, hierarchical models of galaxy formation predict an inside-out accretion of disk gas from the hot gaseous halo, resulting in ages that decrease outward in the galaxy (Fall & Efstathiou 1980, but see Renzini 1995). On the other hand, formation mechanisms, such as those outlined above for the transformation of a spiral galaxy into an S0, could alter this trend of age with radius through either recent star formation (Byrd & Valtonen, 1990; Moore et al., 1996; Quilis et al., 2000; Kronberger et al., 2008) or gas removal (Quilis et al., 2000; Kronberger et al., 2008). The latter process can alter age trends with radius because gas is preferentially removed from the outer disk, while for the former, this occurs through gas inflow.
SP trends in the inner regions of S0 galaxies have been widely studied. Spectroscopic studies suggest that the nuclear regions of S0 galaxies are on average younger and more metal rich than bulges (Fisher et al., 1996; Sil’chenko, 2006; Serra et al., 2008); however, Serra et al. (2008) found this to be true only for HI-poor S0 galaxies. Although the photometric studies of Peletier et al. (1999) found redder colors in the nuclear regions of S0s compared to further out, they attributed this to dust effects, as opposed to age differences. Most models for the transformation of spiral into S0 galaxies predict a resulting central gas concentration that leads to a young SP in the center of the S0 remnant (Icke, 1985; Moore et al., 1996; Kronberger et al., 2008), consistent with spectroscopic studies (as cited above). Derivations of the mean central ages yield an uncertain picture. Peletier et al. (1999) examined the bulges of S0 galaxies using Hubble Space Telescope images and found an average bulge light-weighted age of 9 Gyr, while Sil’chenko (2006) found ages between 4.8 and 8.3 Gyr. Both studies find high central metallicities.
Even less is known about the age trends at larger radii in S0 galaxies. Various authors have proposed that the disks of S0 galaxies are younger than the bulge (Caldwell, 1983; Bothun & Gregg, 1990; Norris et al., 2006). Others suggest comparable ages for the bulge and disk (Peletier & Balcells, 1996; Mehlert et al., 2003) while some report older ages in the disk compared to the bulge (Fisher et al., 1996; Tikhonov et al., 2003; MacArthur et al., 2004). The large variation in observed age trends may be due to differences in radial coverage, bandpasses studied, and the adopted SP models, if any, by the authors. Alternatively, it is possible that the disagreement between studies may be due to the heterogeneous nature of S0 galaxies. Large samples with accurate photometry extending beyond a few effective radii are required to firm up SP and evolutionary trends in S0 galaxies.
In addition to establishing radial SP gradients in S0 galaxies, one must assess whether the SP gradients and mean values are linked to global properties such as the galaxy’s stellar mass, central light concentration, and environment. S0 galaxies are proportionately more populous in the dense environments of rich clusters than in low-density environments (Dressler, 1980), suggesting that environment plays a role in S0 formation and evolution. The mass of a galaxy is closely tied to its formation history. Hierarchical assembly predicts that larger galaxy dark matter halos are formed through mergers later in time than smaller halos (Navarro et al., 1995). However, semi-analytic models can produce “anti-hierarchical” star formation histories in a Cold Dark Matter () universe despite the hierarchical assembly of these galaxies (De Lucia et al., 2006). As well, Neistein et al. (2006) showed analytically that anti-hierarchical evolution can be a natural outcome of bottom-up clustering. Such anti-hierarchical evolution is more consistent with actual observational trends of stellar populations with galaxy mass for all Hubble types, including S0s (MacArthur et al., 2004, hereafter, M04). For example, an increasing fraction of S0 galaxies with recent star formation has been observed for decreasing luminosities (an indicator of stellar mass) (Balcells & Peletier, 1994; Poggianti et al., 2001). Additionally, a correlation of older stellar populations in S0 galaxies with higher velocity dispersion (an indicator of dynamic mass) has been observed (Mehlert et al., 2003; Sil’chenko, 2006; Bedregal et al., 2008). These studies support different star formation histories for high and low mass S0 galaxies, but have largely focused on the inner stellar populations of galaxies.
The degree to which light is concentrated towards the center of the galaxy is also linked to a galaxy’s formation history. Secondary galaxy evolution processes may increase the mass of the central region either through secular build-up or accretion of satellites (Kormendy & Kennicutt, 2004). On the other hand, the relative mass of the central component, or bulge, may influence the outcome of galaxy formation processes, such as those transforming spiral galaxies. For example, harassment preferentially selects bulge-dominated galaxies to be stripped of their spiral structure and transformed into S0s, since disk-dominated galaxies will instead be shredded down to a dwarf system (Moore et al., 1996). Either way, the light concentration of the galaxy is closely tied to galaxy evolution processes and should thus correlate with SP parameters. For instance, McDonald et al. (2009b) found a lack of low surface brightness galaxies with high concentration as well as a lack of high surface brightness galaxies with low concentration. Therefore, they suggest that galaxies with high concentration can only form through major mergers. Other studies relating the size of the bulge and the bulge-to-disk ratio (which is related to concentration) to the evolution of S0 galaxies find that galaxies with larger bulges are redder and have smaller color gradients (Balcells & Peletier, 1994). However, at intermediate redshift (0.73 z 1.04), Koo et al. (2005) found no difference in bulge colors between disk and bulge-dominated galaxies, suggesting that B/D ratio is poorly correlated with stellar populations.
Despite recent progress, studies of radial SP trends in S0 galaxies as a function of the global properties of mass and concentration are still open-ended and have seldom explored the regions beyond . Most efforts have indeed focused on age and chemical composition within one effective radius. In this paper, we use deep optical/near-infrared (NIR) color gradients to explore age and metallicity gradients in S0 galaxies out to typically , and with a large enough sample to cover a substantial range in galaxy mass and light concentration. The focus of this paper is largely on empirical radial trends in stellar populations; separate bulge and disk trends that result from model decompositions of the galaxy image will be presented in a forthcoming publication (Chamberlain et al. 2011, in prep). Our sample of 59 S0 galaxies is presented in §2, while our observations and data reduction techniques are discussed in §3 and §4, respectively. Measurements of global galaxy properties are presented in §5 and the SP models are described in §6. Our results for the age and chemical composition trends in S0 galaxies are presented in §7. The implications of our results are discussed in §8, and a summary is presented in §9. A distance of 16.5 Mpc is used for all Virgo cluster galaxies (Mei et al. 2007).
2 Sample
We selected from the UGC catalog (Nilson, 1973) all galaxies with S0, S0a and S0B morphologies and blue Galactic extinction yielding a catalog of 1088 objects. This sample was further restricted to areas of the sky covered by the Sloan Digital Sky Survey (York et al., 2000, hereafter, SDSS) bringing the sample to 542 galaxies. Finite telescope time limited us to NIR data for only 15% of the SDSS sub-sample; the sample was selected to cover a representative range of mass and light concentrations. Eliminating edge-on galaxies and galaxies with significant spiral structure or overlapping foreground stars further restricted our sample to 59 objects as described below. While this UGC-derived sample includes some range in environment (see §5), the higher density environments are missed. Thus, for greater coverage, we include observations of eight low-mass Virgo cluster galaxies from the sample of McDonald et al. (2010) (hereafter M10); these were observed with the same equipment as our sample (see §3). However, these eight galaxies all have low mass and low concentration; see §5 for more details. In the electronic version, we show SDSS color images (using g, r, and i bands) for our full sample. These images were obtained from the SDSS website: http://cas.sdss.org/dr7/en/tools/chart/navi.asp.
Our sample excludes galaxies with spiral structure and highly disturbed structure, as gauged by visual inspection of the SDSS images. Galaxies with tidal tails or faint spiral structure were retained, but classified as “transition” galaxies due to the emergence or fading of their spiral structure. Examples are shown in the color images available in the electronic version, and are noted by a “T” above the image. Twelve of our 59 sample galaxies are labeled as “transition”. We will see in §7.3 that the putative structural transition correlates with a transition in SP properties. We note that some S0 galaxies left in our “featureless disk” sample are likely to reveal spiral structure when examined with higher resolution images and our sample may also contain elliptical galaxies misclassified as S0.
Highly inclined galaxies with , and galaxies that fall on the edge of the SDSS field of view, were also pruned from the sample in order to measure well-defined surface brightness (SB) profiles.
Our final sample is neither statistically complete nor randomly selected, but tailored to cover a broad range in global properties such as mass, concentration, and local environmental density (see §5). The galaxy sample is presented in Table 1.
3 Observations
Our SP analysis relies on optical and NIR photometry of 59 S0 galaxies. The NIR observations (J- &/or H-band) were collected with the ULBCam at the University of Hawaii’s 2.2-m telescope and the archival optical imaging (g & r) is from SDSS.
3.1 Optical Observations
Optical g & r images with a scale of 0.396 arcsec/pixel were extracted from the SDSS/DR5 archives. The u and z bands were left out considering their low signal-to-noise. We did not use the i-band since it does not improve the discriminating power for age and metallicity in SP models, when combined with g, r, and J or H bands.
3.2 Near-IR Observations
Near-IR images for the 59 S0 galaxies in our sample were obtained with the ULBCam at the University of Hawaii’s 2.2-meter telescope on Mauna Kea in April 2005, 2006 and 2007 and March 2008. A total of 29 galaxies in our sample were observed only in the H band, 19 were observed only in the J band, and 11 galaxies were observed in both the J and H bands. The ULBCam image scale is 0.25 arcsecond per pixel. A maximum single exposure time of 40 seconds was used to maximize the sky flux whilst keeping within the detector’s linear regime. The total integration time depends on SB and ranges from 8 to 24 minutes. A standard dithering script minimized the resampling of bad pixels. Only the cleanest of the four 2048x2048 arrays was used, resulting in an 8.5’ by 8.5’ field of view, which was large enough to properly assess the sky background levels. Our NIR flux calibration makes use of reference stars in the target galaxy field from the Two Micron All-Sky Survey (Skrutskie et al., 2006, hereafter 2MASS). Thus, no standard star observations for photometric calibration were necessary (see §4.1). A more detailed description of ULBCam data taking procedures is provided in M10. A log of observations is presented in Table 2.
In the remainder of the paper, we refer to the galaxies observed in the J-band as the “J-band sample” and those observed in the H-band as the “H-band sample”. Eleven overlapping galaxies are included in both samples.
4 Data Reduction
4.1 Basic Reductions
SDSS images are already processed for flat-fielding, bias subtraction, and cosmic ray rejection. The photometric calibration of the light profiles (§4.6) used the photometric zero-points provided in the SDSS/DR5 library.
Basic reductions of the UH NIR data, which include flat-fielding, stacking, bad pixel rejection, geometric distortion corrections, and flux calibration, were applied to the ULBCam data using the XVISTA software package111http://astronomy.nmsu.edu/holtz/xvista/index.html. The data reduction procedures follow the prescription of M10. The NIR flux calibration of light profiles used infrared stellar photometry from 2MASS for stars in the ULBCam target galaxy fields. A mean offset between our brightnesses and the 2MASS J or H-band brightnesses was calculated and used for the zero-point calibration. This method of flux calibration enabled us to calibrate the photometry of our science images at each pixel, independent of airmass variations and transparency conditions. Additional information on flux calibration methods and background stability can be found in M10. The photometric zero-point and the standard deviation about the mean in the calibrating stars are noted in Table 2. If fewer than three 2MASS stars were found in a target field (indicated by a zero in the last column of Table 2), the calibration used is the average of the previous and next exposures. The quoted standard deviation for these observations is a standard deviation of all calibration values, that is 0.056 mag.
SBs have been corrected for Galactic foreground extinction in each bandpass using the reddening values, , of Schlegel et al. (1998) and assuming an extinction curve.
4.2 PSF Matching
Wavelength-dependent image blurring by the atmosphere affects inner galaxy colors. Thus, we measured the 2D seeing point spread function (PSF) to correct galaxy color profiles. The PSF full width at half maximum (FWHM) is measured from the final stacked image in each bandpass. The stars that are identified for PSF measurements in the g & r bands are individually sky-subtracted and fit with a 2-dimensional Gaussian function from which FWHMs are derived. On average, 50 stars are used for PSF measurements in each stacked SDSS image. The final PSF per image is the median of all individual star PSFs. For NIR images, the final PSF per image is the average of 5 individual PSFs. Images from each bandpass are degraded to the PSF of the worst seeing bandpass (typically the g image) by convolving with a 2D gaussian of appropriate FWHM. For additional precaution, we apply an inner radial cutoff of roughly 2 seeing disks (3 arcseconds) to the color profiles. The central region in all other analyses of colors is averaged within at-least the inner 2 seeing disks. PSF measurements have also enabled the identification of foreground stars that are then removed from the galaxy light.
4.3 Sky Measurement
Careful sky subtraction is crucial for the accurate analysis of deep SB profiles. Sky subtraction follows slightly different approaches for SDSS and NIR images.
We have used the sky value provided with each SDSS image222http://www.sdss.org/dr5/algorithms/sky.html. For the images where the sky value was not available ( half our sample), we used the lowest of the sky measurements measured by us from either the entire SDSS image or from the four image corners. The latter scheme gives sky estimates within 0.5% of the SDSS values (M10).
For the NIR data, the sky is measured in four rectangular boxes along the perimeter of the field of view and then averaged together to give the mean sky value for that image. Each of the four sky boxes has a typical size of 75 x 500 arcseconds. The typical deviation of sky levels amongst the four boxes for the NIR data are .004% of the sky value.
4.4 Surface Brightness Profile Extraction and Error Estimates
SB profiles were extracted by fitting elliptical isophotes to the r-band galaxy images. The XVISTA command, PROFILE, enables this operation based on a generalized non-linear least-squares fitting routine. For these fits, ellipticity and position angle are allowed to vary but the galaxy center is fixed. The isophotal solutions based on the r-band images were then applied uniformly to the images in the g, J, and H band images. This ensures that color gradients are computed from the same matching isophotes. Further details about isophotal fitting and profile extraction, including details on profile depth and signal-to-noise ratios, are given in Courteau (1996) and M10.
The effect of a systematic sky error on galaxy photometry naturally increases with galactocentric radius. To estimate this effect, we have recalculated the SB profiles and color profiles using sky values adjusted to , where is the systematic sky uncertainty. This is calculated as the standard error in the mean of the sky values (as described in §4.3) from four boxes along the perimeter of the image. We determine the sky effect at each radius along the SB profile as half the difference in the SB calculated with the sky value set at and - . Our final computation of the photometric error at each radius is the sum in quadrature of the statistical error from profile fitting (this naturally includes statistical errors in the sky background) and the systematic sky error estimate.
4.5 Outer Radial Cutoff
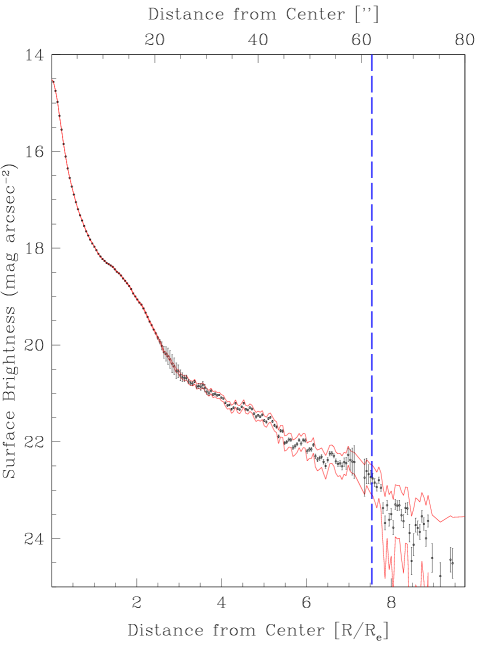
The low NIR galaxy SB, relative to the bright NIR sky background, make an accurate determination of the sky background crucial for extracting reliable surface photometry. This is demonstrated in Fig. 1 for a sample galaxy (UGC4737). We define the outer radial cutoff as the point where the sky error envelopes deviate from each other by more than 0.4 mag arcsecond-2, which is usually where the statistical error per point is comparable to the typical point-to-point variations. Our NIR profiles are intrinsically shallower than SDSS profiles and the common outer truncation radius was thus determined using J and H profiles for all but UGC 10158 where the optical bandpasses are more sensitive to sky errors. In the few cases where the statistical error from profile fitting (for any of the optical or NIR bands) consistently exceeds 0.1 mag arcsecond-2 at large radii, the radius at that SB threshold point would be used as the outer cutoff instead. An example of the outer cutoff, based on an H-band profile, is shown in Fig. 1 as the dashed vertical line. The radial cutoff used for the g and r bands matches the NIR band that is being used for analysis. The outer radial cutoffs for each galaxy in the J and H-bands are given in Table 3.
4.6 Surface Brightness and Color Profiles
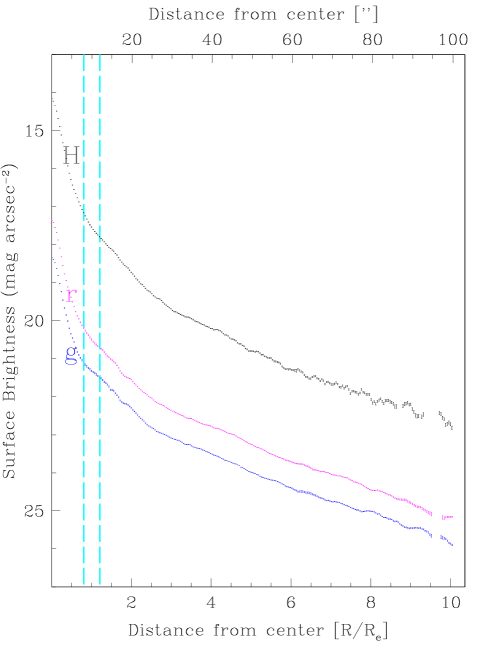
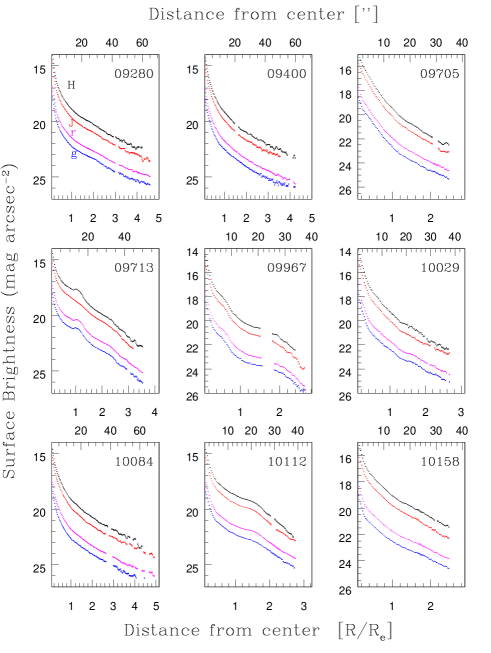
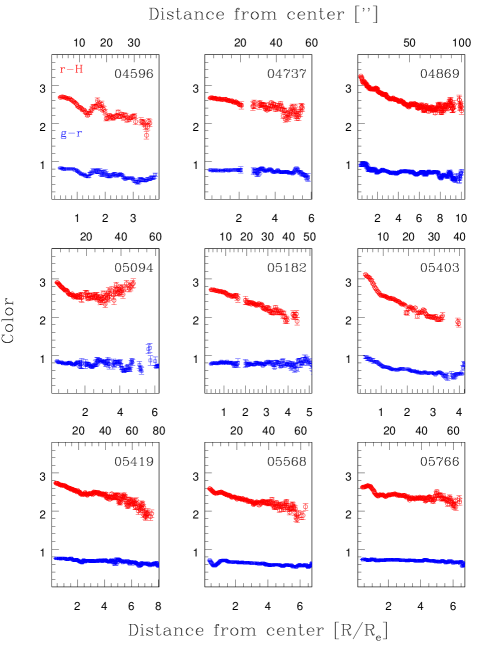
Optical (g & r) and NIR (J and/or H) SB profiles are extracted for all of our galaxies following the prescription outlined in §4.4. Fig. 2 shows an example surface brightness profile for UGC 4869. The entire collection of SB profiles is shown in Fig. 3. The g, r, J and H bandpasses are represented by blue, magenta, red and black data points. The J and H profiles are displayed for the 11 galaxies observed in both passbands. Color profiles for g-r and r-H versus radius are shown in Fig. 4. In figures where both J and H profiles are displayed, the cutoff for the g and r passbands is determined by the larger of the J and H-band cutoffs. The SB and color error bars at each radius reflect the 1 statistical errors only. These errors tend to be small, generally smaller than the point size, except at the largest radii. Interior to the outer radial cutoff, SBs and colors are not plotted for radii where the statistical error exceeds 0.1 mag arcsec-2, which is equivalent to setting very low weight for these pixels. Gaps in SB and color profiles, such as that seen for UGC04737 around 25”, are due to overlapping foreground stars or galaxies. Since these foreground objects have been masked during ellipse fitting, which is identical to setting very low weight for these pixels; they do not affect the profile shape.
We compute effective radii and total magnitudes in the g, r, J, and H bands. To determine the total magnitude, we have extrapolated the SB profile outward by fitting the outer profile with an exponential function. See Courteau (1996) for more details. The effective radius, Re, is the radius that contains 50% of the total extrapolated light. For the 5 galaxies with a plateau in their SB profiles (Type II; Freeman, 1970), no extrapolation is performed. Total magnitudes, mean colors and Re for each galaxy in our sample are given in Table 4.
The lower axis of the SB and color profiles in Figs. 3 - 4 shows the radius in terms of the r-band Re of the galaxy. Most profiles extend past 5 Re. It is also apparent that our sample galaxies cover a range in profile shapes, suggesting a variety of contributions from galactic components. Dips and plateaus in the SB profiles, such as those seen for UGC 4596, are due to structure in the galaxy, usually rings, bars, or spiral structure, and/or extinction by dust.
4.7 Radial Binning
To increase the signal per color bin, we average colors in six radial bins, scaled by the r-band half light radius. The binning scheme is noted in Table 5. If the statistical SB error at any radial point exceeds 0.1 mag arcsec-2, that radial point or region is excluded from the analysis. We also ensure that each binning region contains at least 5 radial points, otherwise that region is excluded from further analysis.
Each galaxy is also subdivided into an inner and outer radial region. The separation between the two regions is chosen at the most prominent inflection point in the SB profile. We find a well-defined change in the slope of the SB profile for 50% of the sample, with the majority having a break between 0.8 and 1.2 Re. We thus label inner regions as those within 0.8 Re and outer regions as those beyond 1.2 Re for all galaxies in our sample. Fig. 2 shows an example of the inner and outer regions with dashed lines at 0.8 and 1.2 Re. Note that our distinction of inner and outer regions is independent of model fitting of galactic components (i.e. disk and bulge). Analysis of stellar populations of discrete galactic components will be discussed elsewhere (Chamberlain et al. 2010, in preparation). Here we focus on a model-independent analysis of the SB profiles. For clarity, when discussing the central-most colors, we refer to ’central’ as the binning region with r 0.5 Re and ’inner’ for r 0.8 Re.
5 Determination and Range of Galaxy Properties
Our analysis of SP gradients relies on correlations with global galaxy properties, such as stellar mass, light concentration and environment. Prescriptions for determining these properties are given below and the values for each galaxy in our sample are listed in Table 6.
Total stellar masses for our galaxies were calculated from total g and r magnitudes (described in §4.6) and using the mass-to-light ratio prescriptions of Bell et al. (2003), unless otherwise noted333We have also calculated masses using Portinari et al. (2004) and find no difference in our results. Distance estimates, which are required to calculate the mass and physical size of the galaxies, were corrected for Virgo flow and the Great Attractor as provided by the NED444The NASA/IPAC Extragalactic Database (NED) is operated by the Jet Propulsion Laboratory, California Institute of Technology, under contract with the National Aeronautics and Space Administration for all galaxies other than Virgo cluster galaxies. The median stellar mass of our sample is 1 x 10¹¹ . Fig. 5 shows a slight bias towards high mass S0s.
Model-dependent bulge-to-disk ratio estimates may carry large systematic errors due to the subjectivity of profile fitting functions (MacArthur et al., 2003; McDonald et al., 2009a). Alternatively, the galaxy light concentration parameter gives a non-parametric indication of the bulge-to-disk ratio (Kent, 1985). It is computed as:
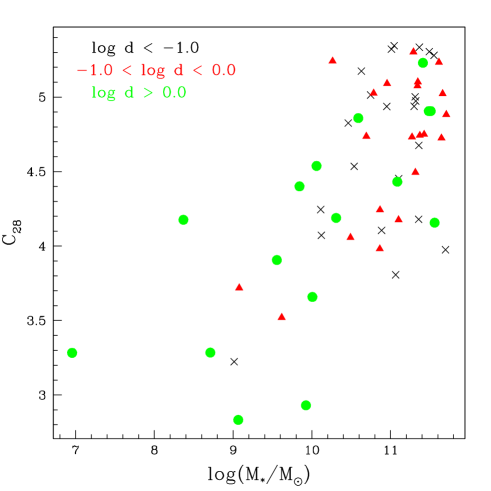
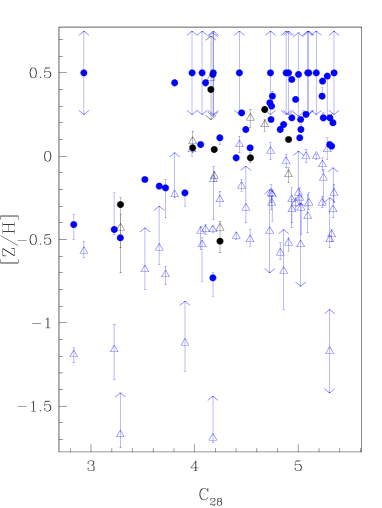
where and are the radii that enclose 80% and 20% of the total light, respectively. The total magnitudes and subsequent 80% and 20% radii have been calculated as described in §4.6. Concentration values for our sample galaxies range from = 2.8 to 5.5 with a median value of 4.7 as shown in Fig. 5. For reference, a pure exponential disk has 2.8.
Our definition of local environment uses a three-dimensional number density based on the mean distance of the six nearest neighbors. To construct the density field, we use the Updated Zwicky Catalog (Falco et al., 1999, hereafter UZC) which is 95% complete to a limiting magnitude of 15.5 mag. A three-dimensional position in a Cartesian coordinate system of each galaxy in our sample is then assigned, based on its sky position and recessional velocity (using a value for the Hubble constant of Ho 75 km s-1Mpc-1). The local number density of our S0 galaxies is calculated by taking the number of objects contained within a sphere of radius equal to the mean distance of the six nearest neighbors in the density field and then dividing by the physical volume of the sphere. We note several sources of uncertainty in our environmental density estimate. First, the magnitude limited catalog samples the galaxy luminosity function to different levels at different heliocentric distances. To correct for this effect, our densities are multiplied by a luminosity function (LF) correction factor, which is the ratio of the integrated observable LF (i.e., the number of galaxies per Mpc-3brighter than the limiting magnitude of the sample) at 3000 km s-1 to the integrated LF at the galaxy’s redshift. We use a Schechter LF (Schechter, 1976) derived from the UZC, with -1.0 and -18.8 (Marzke et al., 1994). However, for objects with cz 9000 km s-1, correction factors become unreliable (greater than factors of 3). Fortunately, only 8 out of our 59 galaxies fall beyond this redshift range. We also consider that galaxies with cz 3000 km s-1 (17 galaxies in our sample) have large peculiar velocities that yield uncertain line-of-sight distances. Finally, in clusters, the high internal velocity dispersion will bias number densities towards lower values. The distribution in environmental densities for our sample covers the range from -2.2 Mpc-3 to 1.23 Mpc-3 with a median value of -0.67 Mpc-3. Our sample is underrepresented in the cluster regime; our 8 Virgo cluster galaxies sample the densest environment. The environmental density calculations were kindly provided by Jesse Miner.
Fig. 6 demonstrates the broad parameter space covered by our sample. Black crosses and green dots refer to galaxies in the lowest and highest density environments respectively. Although our S0 galaxies have mostly low concentration for low mass galaxies, SP trends in mass and concentration can still be identified. However, the combination of a statistically incomplete sample regarding environment (e.g., all of the observed lowest mass galaxies are in the Virgo cluster high density environment) and a scarcity of high density environment galaxies makes it difficult to draw conclusions regarding the effect of environment on age or metallicity.
Galaxies typically occupy two distinct regions in color-stellar mass space; the so-called “red sequence” and the “blue cloud” (Strateva et al., 2001; Kauffmann et al., 2003; Bell et al., 2004; Kannappan et al., 2009a). Although S0 galaxies generally fall into the red sequence, studies have shown that this morphology-color correspondence fails for low mass S0s (Kannappan et al., 2009b). Fig. 7 shows u-r color (Petrosian magnitudes from SDSS) versus stellar mass calculated using Portinari et al. (2004). The dotted line shows the boundary between red and blue sequences, as reported by Kannappan et al. (2009b) but with a mass offset factor of 1.8 to account for mass scale differences. We use the Portinari et al. (2004) mass transformations to match with Kannappan et al. (2009b). All but one S0 galaxy (UGC09003) in our sample fall in the red sequence.
6 Stellar Population Models
A comparison of the observed galaxy colors with those predicted from SP synthesis models covering a range in age and chemical composition allows for the determination of light-weighted mean ages and metallicities. The combination of a primarily age sensitive color (e.g., g-r) with a primarily metallicity sensitive color (e.g., r-H) provides a separation in age and metallicity. We use the Charlot & Bruzual (2010, private communication, hereafter CB10) simple stellar population (hereafter, SSP) model with a Salpeter initial mass function and STELIB libraries (Le Borgne et al., 2003) for our analysis. Since only a single age is attached to any SSP model whilst the observed light likely results from multiple coeval populations, the derived ages of the stellar population contributing the integrated light are best understood as a light-weighted mean age rather than a mass-weighted age. From here on, we drop the “mean” and refer to these as light-weighted ages and metallicities to avoid confusion with mean ages that are radially averaged.
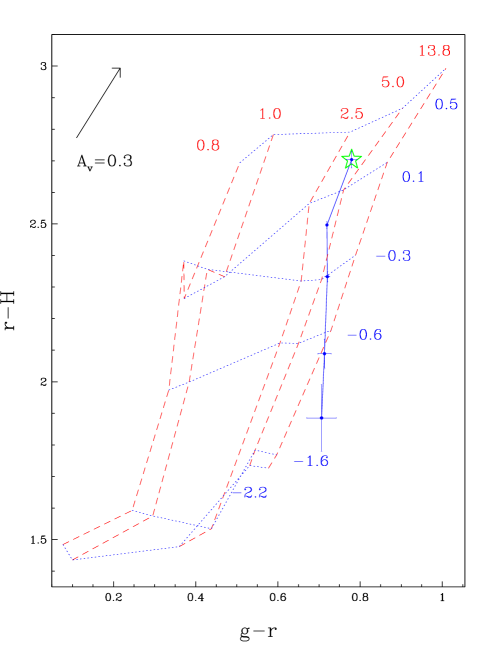
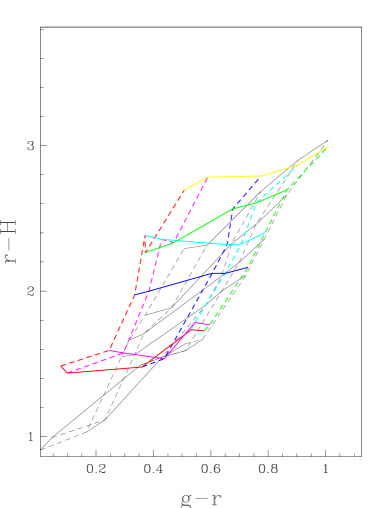
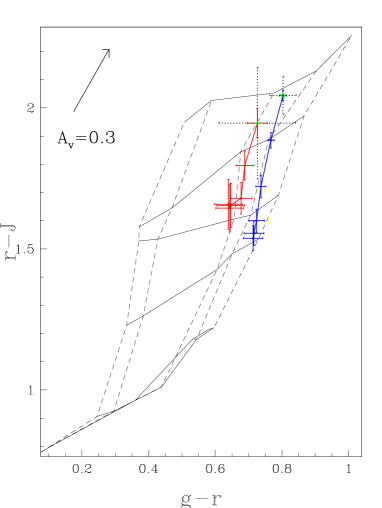
Ages and metallicities are presented in Fig. 8 for the UGC10391 color-color diagram. For each galaxy, the central bin, subsequent radial bin, and consecutive radial bins are denoted by a green star, small filled circle, and a solid blue line, respectively. Overplotted is a CB10 SSP model grid. Red dashed lines represent model lines of constant age increasing, left to right, from 0.8 Gyr to 13.8 Gyr. Blue dotted lines represent model lines of constant metallicity increasing, bottom to top, from [Z/H] = -2.2 to +0.5. The error bars for each radial bin represent the standard error in the mean based on the scatter in color of the radial points within the designated bin added in quadrature to the sky effect (see §4.3). This example shows a galaxy whose light-weighted metallicity and light-weighted age decrease and increase respectively from the center of the galaxy outward. The galaxy gets bluer in r-H at larger radii and keeps a roughly constant g-r, thus crossing over lines of constant age with increasing radius and indicating older ages in the outer regions of the galaxy.
6.1 Star Formation Histories and Model Uncertainties
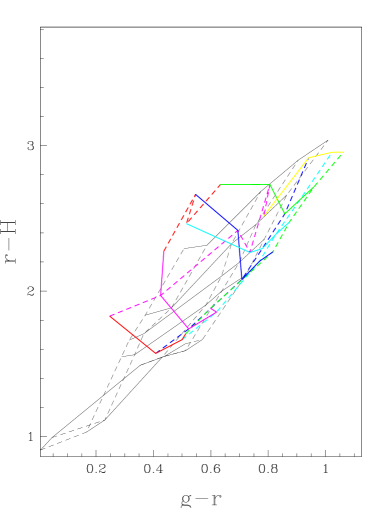
Since our analysis of SP trends in S0s hinges on the reliability of derived ages and metallicities, we must understand the effects of SP model differences on our results. The SSP models that we use for our analysis predict the evolution in colors (and spectrum) of a coeval population of stars with the same chemical composition and specified initial mass function. While this is clearly an over-simplification of actual star formation histories in S0 galaxies, it represents a straightforward way to obtain a light-weighted age and metallicity. However, we must test how our analysis could be affected by the use of more complex star formation histories. Since an SSP is one extreme star formation history (equivalent to a single burst), we compute models for the other extreme, a constant star formation history with a quenching of star formation at various ages, and compute models for the intermediate case of exponentially declining star formation. We thus consider populations that are composed of a superposition of SSPs, born at different epochs. Using the csp-galaxev program555Part of the Bruzual & Charlot (2003) software release: http://www2.iap.fr/users/charlot/bc2003/, we use an SSP model with a Salpeter initial mass function and fixed metallicity, convolved with the given star formation history (exponentially declining and constant). We compute the convolved models for a range of metallicities and time constants, , (for the exponentially declining star formation models) or star formation truncation times (for the constant star formation history models). In both cases, we set the age of the galaxy, or time that star formation began, to 13 Gyr. We show a color-color diagram based on the two sets of models in Fig. 9. The constant star formation history is shown in blue, the exponentially declining star formation history in red, and the SSP model in black. The same SSP model grid is used throughout the paper. The meaning of the “age” of an SP for each set of models is different. For the exponentially declining models, we plot lines of constant . For the constant star formation history models, the age is represented by truncation times, or how long the star formation has lasted since 13 Gyr. The model grid edges are similar between the three model sets. For example, the constant star formation model with a truncation time of 0.1 Gyr and the exponentially declining model with a of 0.1 Gyr are similar to the SSP model with an age of 13.8 Gyr, all lying and nearly overlapping near the right edge of the grids. The general shape of the lines do not vary with star formation history, except for the variation of the -0.3 metallicity line at young ages which is small compared to the large metallicity gradient that is observed in our sample. Thus, an analysis based on relative age trends with radius will be robust with respect to star formation histories.
Uncertainties in SP synthesis modeling have received notable attention (Trager et al., 2000; Schiavon et al., 2002; Shapley et al., 2005; Conroy et al., 2009). Theoretical model uncertainties in the age and metallicity zeropoint can be caused by errors in the calibration of ages and metallicities from globular clusters. When two populations differ in metallicity as well as in age, and if the model zero point errors are metallicity dependent, differential ages between metal-poor and metal-rich populations are less secure. Indeed, there appears to be a strong metallicity gradient with radius for most of our galaxies. Therefore, our derived age trends with radius are subject to metallicity-dependent zero point issues and we take this into consideration when examining our results. Another concern is the difference in elemental abundance ratios between the population being studied and the stars from which the models are based. Massive S0 galaxies are known to have a higher abundance of alpha elements, relative to iron, as compared to solar neighborhood stars (Nelan et al., 2005; Thomas et al., 2005; Serra et al., 2008; Bedregal et al., 2008). Thus when using stellar population models that do not account for non-solar abundance ratios, derived ages and metallicities are affected by errors in the theoretical stellar evolutionary tracks (Schiavon, 2007; Lee et al., 2009). Uncertainties in the input model parameters, such as the effective temperature of the isochrones, giant stars or binary stars in the luminosity function, our understanding of late evolutionary phases, as well as the theory for convection and the effects of rotation and diffusion, may induce additional, unknown systematic errors. The treatment of advanced stages in evolution, such as the Thermal-Pulsating Asymptotic Giant Branch phase (TP-AGB), has received much attention lately. TP-AGB stars are extremely bright and dominate the NIR light of a galaxy following a burst of star formation, but represent a challenge for theoretical models due to the combined effects of thermal pulses, changes from heavy element dredge-up, and mass loss (Bruzual & Charlot, 2003; Maraston, 2005).
The significant range in predictions between different SSP models can lead to great differences in the interpretation of galaxy colors. Although it is difficult to estimate uncertainties in the derived SP parameters (like age and metallicity), the comparison of available models suggests how reliable they are. The CB10 model is a revised version of the Bruzual & Charlot (2003, hereafter, BC03) models, which includes a new prescription for TP-AGB evolution of low and intermediate mass stars following Marigo & Girardi (2007), and uses tracks and isochrones with updated input physics from Bertelli et al. (2008). Eminian et al. (2008) and MacArthur et al. (2010) have highlighted significant changes with the new Bruzual and Charlot models in NIR model colors for intermediate populations. As well, the SP synthesis models of Maraston (2005) different from the Bruzual and Charlot models by using a fuel-consumption-based code. These models place a particular emphasis on the TP-AGB phase and the effect on the model colors has been demonstrated in the literature (Tonini et al., 2009).
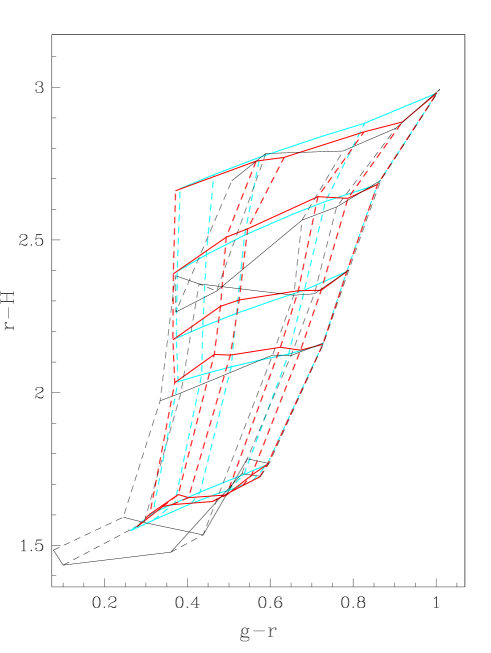
We compare the original BC03 SSP models to the SSP models of Maraston (2005) and CB10 in Fig. 10. Maraston (2005) and CB10 SSP model grids are shown in the left and right panels, respectively. The BC03 model grid is shown in each panel (in black) for reference. All three models cover similar ages and metallicities (see figure caption for details), but the lowest age plotted here (0.8 Gyr) is not available for the lowest metallicity (-2.25 dex) in the Maraston (2005) model. The CB10 models are a closer match to the Maraston (2005) models than the earlier BC03 version. Both Maraston (2005) and CB10 models are redder in r-H, which provides a closer match to observations of star forming galaxies (Eminian et al., 2008). Despite large differences in color at low ages, we find in all models that the lines of constant age are tilted in a similar direction at all ages. We will return to this key point in §7.2. For younger ages ( 3 Gyr), the lines of constant metallicity in the CB10 and Maraston (2005) models change slope (r-H colors decrease along lines of constant metallicity for increasing age) and lines of constant age vary slightly in their dependence on r-H colors. We will discuss the model differences on colors in §7.
6.2 Extraction of Ages, Metallicities, and Gradients
For our analysis, we use the CB10 models with an SSP star formation history. We derive light-weighted ages and metallicities for each radial bin and for the inner and outer radial regions (as defined in §4.7) by fitting CB10 SSP models to the galaxy colors. We compute a finely-spaced CB10 SSP model grid by interpolating linearly between the SSP metallicities and between the finely spaced ages provided by CB10. From the g-r and r-H (or r-J) colors, we determine the ages and metallicities from the model that minimizes the difference between model and observed colors, calculated in quadrature. Due to the uncertainties in extrapolating model colors to larger metallicities and ages and the convergence in colors at large ages, the age and metallicity of a galaxy are set to a maximum of 13.8 Gyr and +0.5 dex, respectively. While the CB10 models extend to 20 Gyr, we chose a maximum age of 13.8 Gyr for consistency with the current age of the universe (Hinshaw et al., 2009) (the colors of 20 Gyr and 13.8 Gyr models are similar enough not to affect our analysis).
The uncertainties in the derived ages and metallicities are determined via a Monte Carlo method based on M04. Two-hundred realizations of the model fits were performed for each radial bin and inner and outer regions with the colors for each realization drawn from a Gaussian distribution of the errors in each color. The standard error in the mean is based on the scatter in color of the radial points within the designated bin or region added in quadrature to the sky effect. Ages and metallicities for each bin correspond to the mean of the ages and metallicities computed from each realization. The positive and negative errors in the derived ages and metallicities for each bin are then taken as the interval containing 68% of the 200 Monte Carlo realizations. If more than 5% of the realizations produced either an age greater than 13.8 Gyr or a metallicity greater than +0.5, we set the error to zero, indicating the lack of a measurable error. We note that model fitting errors do not reflect uncertainties in the model itself (see §6.1). Ages, metallicities, and their uncertainties are listed in Table 3 for the inner and outer regions of all galaxies in our sample. Tables of ages and metallicities at each radial bin are available upon request.
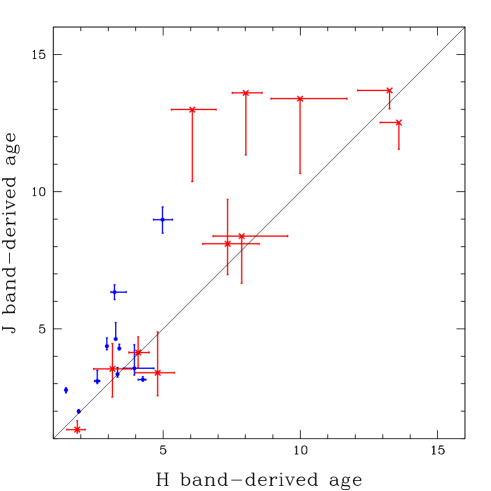
There are 11 galaxies with available J and H-band images, enabling a partial consistency check on our extracted ages and metallicities. In Fig. 11, we show the derived J-band ages versus the derived H-band ages for both the inner and outer regions. A Kolmogorov-Smirnov two-sample test (hereafter, KS) on ages for the 11 galaxies in common reveals a probability of 81% that J and H-band derived ages are drawn from the same population for both inner and outer regions.
Age and metallicity gradients are determined from a linear least-squares fit to the age and metallicity data in the second, third, and fourth radial bins. We avoid the central radial bin due to the greater likelihood of dust contamination and seeing blur; the fifth and sixth bins are avoided due to their greater errors from systematic sky uncertainties. The age and metallicity gradients for each galaxy are listed in the electronic version. Because the extracted ages and metallicities were set to a maximum of 13.8 Gyr and +0.5 dex respectively, when an age (outermost bin) or metallicity (innermost bin) is set to one of those values, the gradient is considered a lower limit.
7 Results
We wish to constrain the star formation and chemical enrichment histories of S0 galaxies by mapping light-weighted ages and metallicities from the center out to large radii. We first analyze the central ages and metallicities. While sky background removal is clearly the limiting obstacle to accurate photometric colors at large radii, it is a minimal problem in the central region. In addition, there exists numerous age determinations for the centers of early-type galaxies, including S0s, in the literature, thereby enabling a useful comparison of modeling procedures. On the other hand, central regions of early-type galaxies, which may include S0s, can be “contaminated” by recent star formation episodes that may be non-representative of the mean age of the rest of the galaxy (e.g., de Jong & Davies, 1997; Sánchez-Blázquez et al., 2007; MacArthur et al., 2009). Therefore the mean age derived for the central region may depend on the aperture size for the age determination. Moreover, PSF differences between different passbands make the interpretation of surface photometry within the central regions of galaxies problematic. Despite these complications, we first compare our central ages and metallicities with corresponding values from the literature. An analysis of the galaxies’ outer regions will follow. We note that our central regions all correspond to a radius of at least 3 arcseconds to alleviate PSF matching issues.
7.1 Central Ages and Metallicities
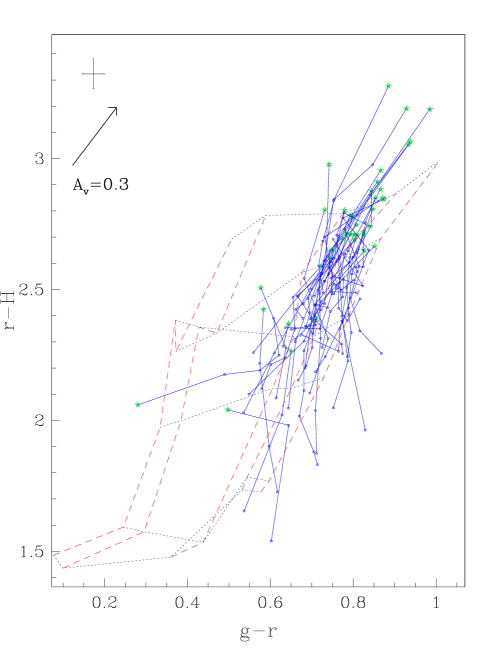
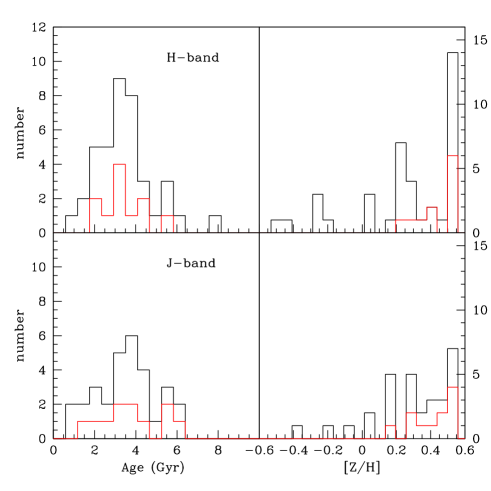
Central g-r colors versus r-H colors are plotted in Fig. 12 for all galaxies in the H-band sample relative to a SSP model grid, where the central bins (r 0.5 Re) are designated by a green star. It can be seen that most of our galaxies have central colors that are concentrated in regions of intermediate age and high metallicity. In Fig. 13 we plot histograms of the extracted central (r 0.5 Re) ages and metallicities for the J- and H-band samples. The 11 galaxies with J- and H-band data yield similar age and metallicity histograms, therefore we shall merge the two data sets. However, we note non-uniformities in the J-band backgrounds that do not exist at H. Thus, when combining all the galaxies in our sample, the quoted ages and metallicities for galaxies that have H-band imaging will be based on that band alone.
The distribution of light-weighted central ages for the combined J- and H-band data is fairly symmetrical with a mean age of 3.6 1.8 Gyr (the error is an rms scatter). The median central age is 3.3 Gyr. Thus, fairly recent star formation episodes have occurred in the central regions of a majority of S0 galaxies. We can compare this result with similar studies of S0 galaxies based on: (1) optical and NIR photometry (Peletier et al., 1999), and (2) integral field unit (IFU) optical spectroscopy (Sil’chenko, 2006), as well as comparing the ages and metallicities of specific galaxies in our sample with spectroscopically derived values. Since the central ages of early-type galaxies, which may include S0s, are typically older for more massive galaxies (Caldwell et al., 2003; Nelan et al., 2005; Sánchez-Blázquez et al., 2006; Graves et al., 2009; Sánchez-Blázquez et al., 2007; Smith et al., 2009), we must compare galaxies of similar stellar mass (absolute luminosity). The typical stellar masses of our sample galaxies are similar to those of the Peletier and Sil’chenko samples. Thus, stellar masses cannot be responsible for any age differences between the samples.
From broadband optical and NIR photometry, Peletier et al. (1999) found a mean bulge age of 9 2 Gyr (at 1 bulge effective radius) for a sample of twenty S0 and early spiral galaxies (to Sbc). The “bulges” of Peletier et al. (1999) are closest in observed radius to our 2nd binning region, for which we find a mean age of 4.6 2.4 Gyr. While the Peletier et al. (1999) ages are substantially greater than ours, these authors did not include the seven bluest, youngest bulges in their sample, three of which are S0 galaxies. As well, they studied highly inclined galaxies and masked out the disk from their extracted ages and metallicities, hence their results truly apply to bulge light at 1 Re, while ours apply to bulge and disk light mixed together within 0.5 to 1.5 Re. Finally, the difference in mean ages may be partly attributed to the difference in SP models. Peletier et al. (1999) used the Vazdekis et al. (1996) SSP models but note that the Worthey (1994) models give a significantly smaller mean age (2 Gyr) for their sample. The latter would be in closer agreement with our result.
Sil’chenko (2006) compiled an IFU spectroscopic sample of 58 lenticular galaxies and used the Thomas et al (2003) models for age estimates. She reports median ages within the unresolved nuclei of 3.7 and 6 Gyr for galaxies in sparse and dense environments, respectively, while the median ages for ‘bulges’ (extracted from an annulus of 4 to 7 arcsec) are 4.8 and 8.3 Gyr for sparse and dense environments. With the exception of the few Virgo galaxies, our sample shares the sparse environment of Sil’chenko’s galaxies, and our central ages are extracted from a region between the unresolved nucleus and the 4-7 arcsec bulge. Our age distribution is thus a closer match to that of Sil’chenko (2006).
We also wish to perform a comparison of metallicities, for which the mean and median central values of our sample galaxies are [Z/H]= 0.2 0.3 dex and 0.3 dex, respectively. The median value is preferable here, as it is more robust to the limit we place on metallicities at +0.5 dex. Our results are in agreement with Sil’chenko (2006), who finds a median metallicity for her nuclei and bulges of +0.4 dex and +0.2 dex, respectively. Visual inspection of Fig. 3a in Peletier et al. (1999) reveals a mean metallicity near solar, consistent with our mean value of [Z/H]=+0.0 0.3 dex for our second radial bin.
Although our sample does not overlap with either Peletier et al. (1999) or Sil’chenko (2006), independent ages and metallicities from spectroscopic studies offer direct comparisons for a few galaxies in our sample. Kuntschner et al. (2006) extracted Lick index line strength measurements for UGC 5503. Comparison of their H and Fe5015 index measurements to a Vazdekis (1999) stellar population model yields an age of 1.6 Gyr for the inner 25”. Our average extracted age for this region (comparable to our first two radial bins) is 1.3 Gyr. For UGC 10048, Caldwell et al. (2003) estimated an age range of 4.9 to 7.9 Gyr, depending on the indices used. They used a 3˝ wide long slit spectrum with variance weighting, thus it is difficult to compare specific regions in the galaxy. Nevertheless, our extracted age is slightly younger, ranging from 4.5 Gyr in the inner region to 3.7 Gyr in the outer region. The metallicity from Caldwell et al. (2003) ranges from -0.1 to 0.1 while ours ranges from 0.1 in the inner region to -0.3 in the outer region. Caldwell et al. (2003) also studied VCC 1614, for which our extracted age for this galaxy ranges from 1.4 Gyr in the inner region to 5.5 Gyr in the outer region. This is consistent with their age of 1.8 Gyr. Our metallicity ranges from -0.4 in the inner region to -1.2 in the outer region, consistent with the metallicity of -0.4 for Caldwell et al. (2003). In general, our extracted ages and metallicities are similar to those derived from spectroscopic studies.
Fig. 12 shows the center of several galaxies lying off the model grid toward larger r-H values. The colors of these off-grid points may result from dust reddening. In many S0 galaxies, dust affects mainly the central regions (Peletier et al., 1999; Wiklind & Henkel, 2001; Fritze v. Alvensleben, 2004), although dust lanes are observed in 3-color optical images in the outer regions of a few galaxies in our sample. While our galaxy colors are corrected for Galactic foreground extinction, internal extinction is ignored. To estimate the effect of internal extinction, a reddening vector for a foreground screen dust model with Av 0.3 is shown in the upper left corner of the color-color diagrams. Thus, if unaccounted for, intrinsic extinction biases our extracted ages and metallicities towards higher values. This effect is clearly demonstrated and discussed in Peletier et al. (1999). Their Figure 3a shows a large shift in colors, parallel to the reddening vectors, from the center of the galaxy to one Re; ages could shift from 11 Gyr to 9 Gyr and metallicity from [Fe/H] 0.5 to 0.0. Peletier et al. (1999) found a dust signature in HST images in almost all S0 galaxies in their sample.
7.2 Radial Age Trends
While the inner regions of our S0 galaxies have light-weighted ages of 3.7 1.8 Gyr (the error is rms scatter), the outer regions are remarkably heterogeneous. For those we find a mean age of 6.1 4.0 Gyr. The 4.0 Gyr scatter in age exceeds the observational error. The larger age spread in the outer regions is notable by comparing the top and bottom panels of Fig. 14, which shows all galaxies in our sample (as mentioned before, we use the H-band data for the 11 overlapping galaxies). Many galaxies have outer ages that exceed our limit of 13.8 Gyr. The increased heterogeneity in outer region ages compared to the inner regions naturally creates heterogeneous radial age trends, as illustrated in Fig. 12. We find an increase in age with radius from the inner to outer radial regions for 58% of our sample of 59 galaxies, a decrease for 19%, and a change of less than 1 Gyr for 23%. In Fig. 14, there is a clear tail in the outer region for high ages. As expected, this tail is also apparent in the distribution of age differences from the inner to the outer region, shown in the top panel of Fig. 15. Excluding this tail, many galaxies have similar ages between the inner and outer regions.
We find that the outer regions for 24% of our galaxies show a substantial increase in light-weighted age from the center of the galaxy outward, resulting in outer regions older than 10 Gyr. We refer to these galaxies as “old outskirts” galaxies. Specifically, we define an “old outskirts” galaxy to be one for which the integrated age of the “outer” region (i.e., all radii beyond ) is greater than 10 Gyr. Note that some galaxies with ages 10 Gyr in one or more outer radial bins are not classified as “old outskirts” galaxies because the integrated age for all radii beyond does not exceed 10 Gyr. However, we include two galaxies as “old outkirts” whose H-band derived ages in the outer region are just under 10 Gyr, but the J-band derived outer region ages exceeds 10 Gyr (see §7.2.1). Examination of optical color images for those galaxies shows no prominent features (i.e. bars, nascent spiral structure or rings) in their outer regions, except for UGC 9713 (bar) and UGC 10112 (faint ring). Color images for galaxies with old outskirts are shown in the electronic version and are indicated by an “O” above the image.
We have veri ed that the aforementioned results are robust to the definition of the outer region by varying it from 1.2 to . We see no change and, thus, conclude that the definition of the outer cutoff does not change strongly affect our results.
We can compare our age trends with those from similar studies. Early photometric studies of S0 galaxies found mostly negative age gradients, but covered only the inner disk and used different color combinations than ours (Caldwell, 1983; Bothun & Gregg, 1990). Peletier & Balcells (1996) find an age difference of less than 3 Gyr between the bulge and inner disk for most galaxies in their sample, similar to our peak at zero age difference. While they did not have many old outskirts galaxies, their study included early-type galaxies up to Sb, with only 8 pure S0 galaxies, two of which have older ages in the outer regions. Detailed studies of individual S0 galaxies have found both negative and positive age gradients (Tikhonov et al., 2003; Norris et al., 2006). Finally, Sil’chenko (2006) found that, independent of environment, S0 galaxies contain a nuclear region that is younger than the bulge region. We show here that this trend continues outward for some galaxies in our sample, resulting in a large age gradient for those.
We can compare our age gradients with those of Fisher et al. (1996), also discussed in §7.1, and those of Rawle et al. (2010), who studied a sample of 19 early-type galaxies, including 11 S0s, in the Shapley Supercluster core. For our galaxies, we find a mean agelog(r/Re) 2.3 4.6 Gyr dex-1, with a median of 0.6 Gyr dex-1. For a sample of 9 edge-on S0 galaxies, Fisher et al. (1996) found agelog(r/Re) 5.0 to 7.0 Gyr dex-1 (depending on assumptions) for the bulge and agelog(r/Re) 1 Gyr dex-1 for the inner disk. Even though we sample light from both the bulge and disk components due to the face-on nature of our sample, we do find that our age gradients are consistent. Rawle et al. (2010) found a lower mean age gradient of agelog(r/Re) -0.10 0.04 Gyr dex-1, but also point out the existence of several individual galaxies with significant gradients in either direction, as we have found.
7.2.1 Caveats for Old Outskirts S0 Galaxies
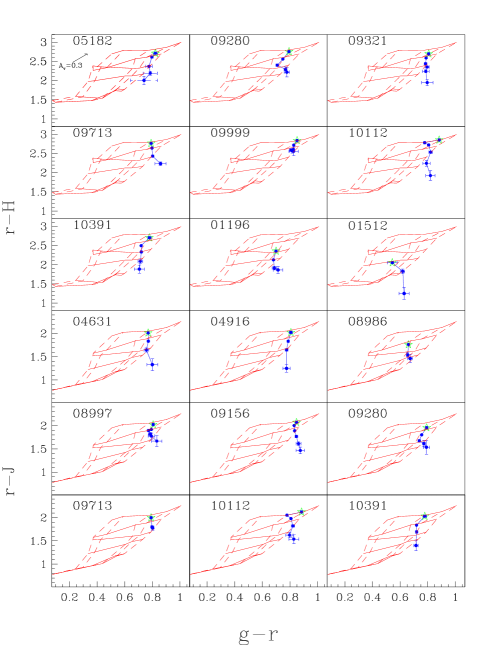
A striking finding of this study is the significantly old ages in the outer regions of 14 S0 galaxies. We discuss these galaxies in more detail below along with potential caveats, whether observational or model dependent, for our inference of old outer regions. To assist our discussion, we show in Fig. 16 color-color diagrams for these 14 galaxies.
We now test for observational consistency between J and H band data for the old outskirts galaxies. Based on H-band data, three galaxies, UGC 10163, UGC 10391 and UGC 9280, would not qualify as “old outskirts”, but do so by virtue of J-band data. The H-band color-color diagrams for UGC 10391 and UGC 9280 show that those galaxies do have old outskirts, such as ages 10 Gyr in at least 2 outer radial bins (but narrowly fail to be classified as “old outskirts” galaxies based on their integrated ages beyond 1.2 Re). Examination of the color image of UGC 10163 (see the electronic version) reveals dust in the outer region of the galaxy which artificially bias towards old ages. To be conservative, we eliminate this galaxy from our sample of old outskirts galaxies. Two galaxies in our sample with J and H band data, UGC 9713 and UGC 10112, qualify as an old outskirts galaxy using ages extracted from both bands. Thus, our final sample of old outskirts galaxies includes four S0s with data in both the J and H bands: UGC 9280, UGC 9713, UGC 10112, and UGC 10391. The color-color diagrams for those galaxies (Fig. 16) are very similar between J and H (the difference in UGC 9713 in the last bin is due to a stricter cutoff in the J-band).
Not only do old outskirts galaxies have old outer regions, they also have a positive age gradient. Because of the tilt of the model grid in Fig. 16, the outer region ages and age gradients are highly dependent on the r-H color, even though the g-r color is more sensitive to age than r-H. Thus, our results hinge on the observed large decrease in r-H color. This underscores the importance of NIR colors in extracting ages from photometry.
A major concern for the identification of faint outer regions in galaxies is the sky subtraction, which, as discussed in §4.4, is more problematic in the NIR than the optical. Possible systematic sky errors include a variation of sky level across the image field, a narrow field of view for the galaxy size (never a problem here), and a bias in the sky level assessment. We discussed in §4.4 NIR systematic error estimates based on the variation in sky level from four boxes along the perimeter of the image, which is included in the error bars in Fig. 16. Provided our sky error estimates are correct, altering the sky background by a systematic error in most of these galaxies would not yield an age below 10 Gyr; that is, old outer regions remain. Finally, any error in our methodology in sky background estimates should affect all of our galaxies equally.
It is also unlikely that the presence of dust has skewed our results of old outer regions. The reddening line shown in the top left of Fig. 16 shows the direction for dust reddening, which would make both g-r and r-H redder. Thus, a large amount of dust reddening would be necessary to explain the observed old ages. While S0 galaxies likely suffer some dust extinction, Peletier et al. (1999) find from HST images that the light should be free from dust for most S0 galaxies beyond r . Examination of SDSS color images of old outskirts galaxies shows no visible dust lanes or nascent spiral structure in the outer regions of these galaxies.
We have also examined photometric zeropoint errors. However, because this would affect all radii equally, no amount of shift in any direction would negate the trend of increasing ages with radius for old outskirts galaxies.
Our derived ages are notoriously subject to modeling uncertainties, especially at NIR fluxes that are dominated by ill-constrained late evolutionary phases (Eminian et al., 2008; Charlot & Bruzual, 2010; MacArthur et al., 2010). A major challenge for SP models is the treatment of the TP-AGB phase which affects mostly low ages and high metallicities, but old ages are unchanged. However, colors for the outer regions of old outskirts galaxies fall off of all model grids, suggesting an inconsistency in observations and the models. While some of the offset may be due to sky subtraction error, this cannot explain the offset entirely. Thus it is possible that zero point errors in the SP models are at play and may affect our results. Models have been known to predict excessive galaxy ages (Vazdekis et al., 2001; MacArthur et al., 2004; Thomas et al., 2005; Moorthy & Holtzman, 2006). Age dating of old stellar populations is influenced by uncertainties in the and [Fe/H] scale of giant branch stars (a significant fraction of the continuum light of old stellar populations, even in the blue, is provided by giant stars) as well as the luminosity function of the upper red giant branch (Schiavon et al., 2002, hereafter S02). For example, S02 found that the unrealistically large derived age for the globular cluster 47 Tucanae from comparison of its observed integrated spectrum to population synthesis models may be partially explained by the discrepancy between the observed luminosity function of the upper red giant branch of the cluster and the lower expected number based on synthesis models. Indeed, the model predictions in S02 for (B-V) are too blue compared to the observations of 47 Tucanae, so that an older age is needed to reconcile with the observed color. Despite these concerns for the model-dependent derivation of old ages, it is unlikely that the result of old outer regions in a sub-sample of S0 galaxies will be revised with improved models.
Finally, our reliance on SSP models to extract ages should not affect this result. Since young stars dominate the light, an SSP age greater than 10 Gyr indicates the lack of any significant star formation for quite some time. Therefore, no star formation history is necessary.
Given all of the above considerations, we feel that the result of old galaxy outskirts is robust in most cases.
7.3 Age Trends With Galaxy Properties
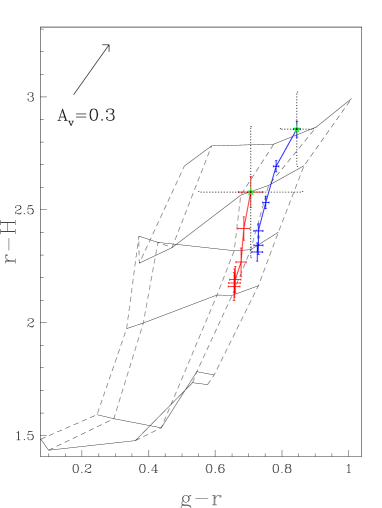
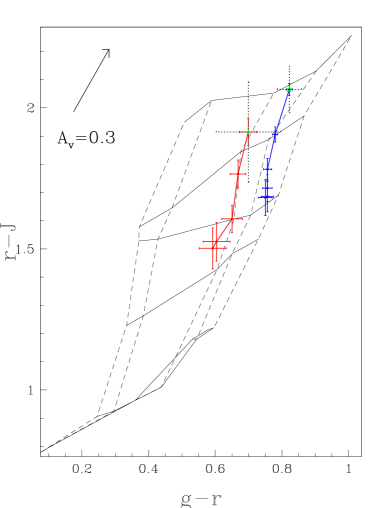
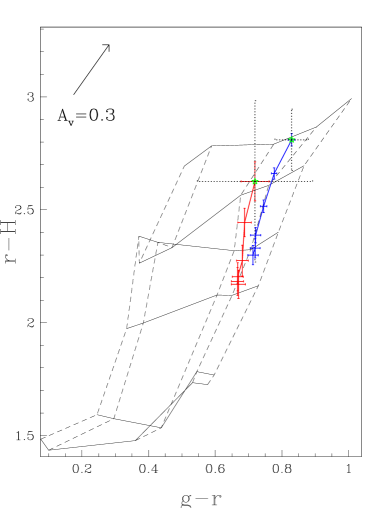
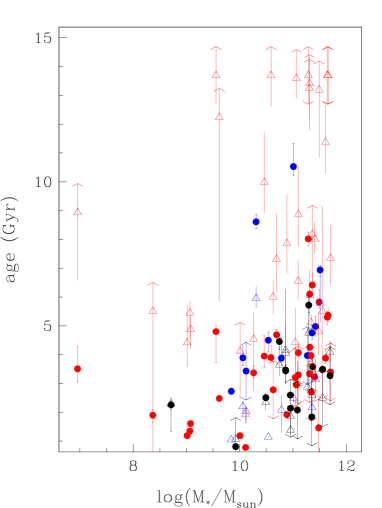
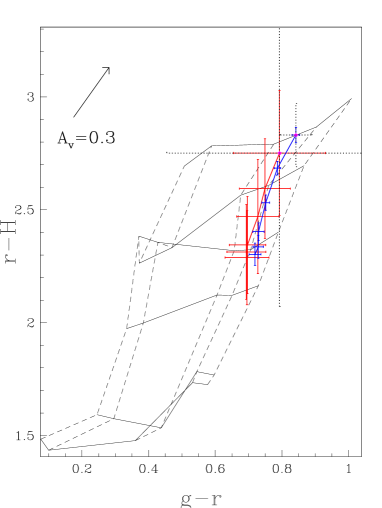
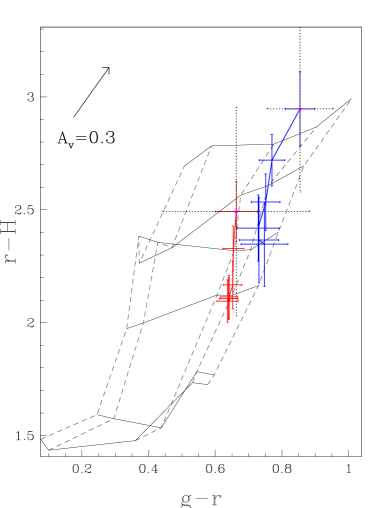
We have established that S0 galaxies exhibit a variety of radial trends in age, with a substantial population having large positive age gradients. We now inquire whether these age trends, as well as the mean ages, are correlated with global properties such as total mass and light concentration. To that end, we have separated our sample of 59 S0 galaxies into two roughly equal groups of low and high mass galaxies, straddling 1 M☉. The colors in each radial bin are averaged for all galaxies in each group and are plotted in the g-r vs r-H diagram (left panel) and g-r vs r-J diagram (right panel) in Fig. 17. The solid colored error bars are the standard error in the mean for each radial bin. The black dotted error bars in the first radial bin denote the 1 scatter in color for galaxies in that bin. In both panels a separation in ages is apparent between the two mass groups, such that the stellar populations of less massive galaxies are younger on average than those of more massive galaxies at all radial bins; this effect is more pronounced in the J-band sample. Although the sample is not statistically complete, accounting for possible environment-age trends (as observed in Sil’chenko, 2006) would only strengthen our mass-age relation. A KS two-sample test was applied to the high and low mass age distributions for all radial bins combined for all galaxies in our sample. The hypothesis that the two samples are drawn from the same population in mean age can be rejected, with a p-value of 1.710-5, confirming what is apparent in Fig. 17. The results of this and other KS tests are summarized in Table 7. When only the inner regions are considered, the ages of the two mass groups can still be rejected as a single population (at the 97% significance level). This result is consistent with Sil’chenko (2006), who found that the stellar populations of more massive S0 bulges are older than those of less massive bulges. However, the bias in mass and environment of our sample (see §5) may weaken age-mass relations.
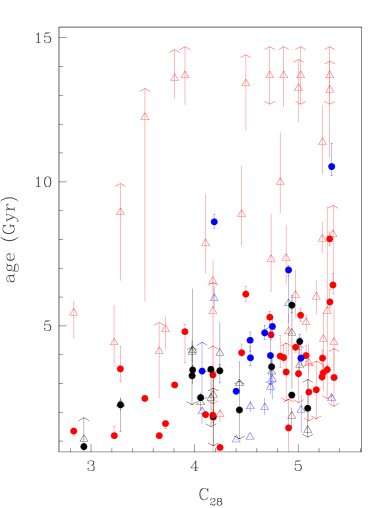
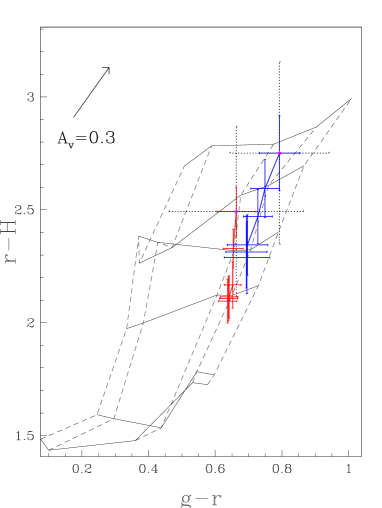
We have also sorted galaxies into high and low concentration groups, using a separation at the median value of the concentration index, . As above, the ages at each radial bin were combined for each galaxy in the two concentration subsamples. Fig. 18 shows a color-color diagram for the J- and H-band samples with the average colors of each concentration group averaged. A separation in age is evident, such that the stellar populations of centrally concentrated galaxies () are older than those of less centrally concentrated galaxies. As with mass, the J-band sample, which does not include the Virgo galaxies, shows a clearer separation in age. The hypothesis of a similar parent distribution in age between the two concentration groups can be rejected, with a p-value of 1.910-4, when all radial bins are combined. We do not find a statistically significant (within 1 ) age difference in the outer regions alone for different concentration groups. To show the mass-age and concentration-age relations without the constriction of groups, we plot in Fig. 19 age versus mass and concentration for the inner and outer radial regions.
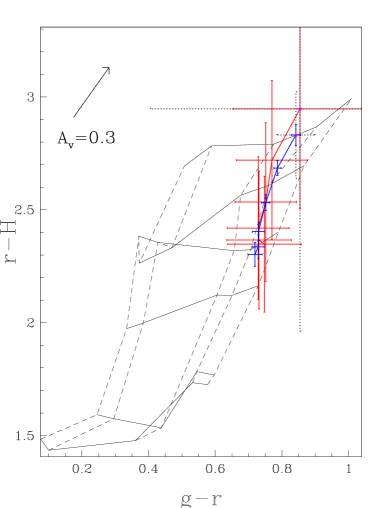
Because low concentration galaxies tend to be less massive than higher concentration ones, as seen in Fig. 6, the age trends found for both mass and concentration could be intertwined, with only one of the variables being the driving factor. To test which of mass or concentration is more fundamental, we further subdivide our high mass sample into low and high concentration subsamples, and do the same for the low mass sample. In Fig. 20 color-color diagrams are plotted with galaxies separated by mass as in Fig. 17, however this time only high concentration galaxies are plotted in the left panel and only low concentration galaxies are plotted in the right panel. Fig. 21 reverses the analysis. Figs. 20 - 21 show a larger separation in mean age for the low concentration and low mass galaxies. While this may suggest that both parameters drive the correlation in age, these eyeball tests are not necessarily statistically sound (at least within 1 ). Combining mass and concentration, we find that galaxies with both low mass and low concentration are younger in mean age than the rest of our sample in the inner region (2.9 Gyr versus 4.2 Gyr).
Our sample of S0 galaxies is a morphological mix, with some galaxies showing more spiral features than others. We now examine how radial age trends are dependent on morphology. The distributions of age differences for non-transition galaxies (featureless disk) and for transition galaxies are plotted in Fig. 15 in the middle and bottom panels respectively. There is a positive age gradient for featureless disk S0s which is clearly stronger than that for transition galaxies. Transition galaxies do not appear to have the same tail of large age differences as other galaxies. This is expected if transition galaxies have a growing spiral structure where young stellar populations are located. A KS test for the age differences of transition and non-transition groups reveals statistically different populations at a greater than 3 confidence level.
We note that old outksirts galaxies do not exhibit a preference for any particular mass or environment, but may for concentration. Also, age gradients, do not demonstrate a correlation with mass or concentration.
7.4 Metallicity Trends
Negative metallicity gradients have been previously found for S0 galaxies (Fisher et al., 1996; Tamura & Ohta, 2003; Rickes et al., 2009; Rawle et al., 2010). From their spectroscopic sample Fisher et al. (1996) found a mean of [Fe/H]log(r/Re) -0.9 to -0.7 (depending on assumptions) for their bulges and [Fe/H](rkpc) -0.04 to -0.06 kpc-1 for the disks. Rawle et al. (2010) found a mean metallicity gradient of [Z/H]log(r/Re) -0.13 0.04. We carry our measurements typically 2.5 to 5 times further in radius and look for correlations with global properties. Since colors alone do not yield information about non-solar element abundance ratios, we examine the trends of mean metallicity in S0 galaxies based on the scaled solar modeling described in §6.
Fig. 12 shows that virtually all S0s have significant negative metallicity gradients. We find a mean metallicity gradient -0.6 0.5. In terms of physical radius, the gradients have a mean -0.1 0.3, consistent within the errors with the above studies. Recall that the central-most binning region is avoided in the calculation of gradients. This largely alleviates any artificial metallicity bias due to dust, if any, in galaxy centers.
The correlation of metallicity with mass and concentration can be assessed in the same way as for age, i.e., by dividing the sample into high and low mass and concentration groups. For the trends of inner region metallicities, eleven galaxies lie off the model grid and are thus set to the maximum metallicity of 0.5 dex; this would most likely have a weakening effect on metallicity trends. As well, accounting for the fact that all of the observed lowest mass and lowest concentration galaxies are in the Virgo cluster (high density environment) would only strengthen the mass and concentration trends that we observe, because galaxies in higher density environments are found to have higher metallicity (at a given mass) (Cooper et al., 2008).
Examination of Figs. 17 and 18 shows a strong separation in metallicity for the high versus low mass and concentration groups such that low mass or low concentration galaxies have lower metallicities. High and low mass galaxies have statistically different metallicity distributions in both the inner and outer regions (KS test reveals a p-value of 6.7710-5 for the inner regions and 0.01 for the outer regions). Studies of mass-metallicity relations in S0 galaxies are abundant (Garnett, 2002; Kauffmann et al., 2003; MacArthur et al., 2004; Tremonti et al., 2004; Thomas et al., 2005), but most of these studies report a central metallicity ( 1 disk scale length) or a global metallicity (such as studies at high z where the aperture encompasses the entire galaxy) so that a comprehensive mass-metallicity relation in the outer parts of S0 galaxies is still missing. The metallicity-concentration trends we see may be related to the increase in metallicity with early Hubble type (M04). Metallicity gradients, on the other hand, do not demonstrate a correlation with mass or concentration. The mass-metallicity and concentration-metallicity relations are also demonstrated in Fig. 22 for the inner and outer radial regions.
We try again to separate the effects of mass and concentration on metallicity. Examination of Figs. 20 and 21 shows a significantly larger separation in mean metallicity for the low concentration and low mass galaxies. For the inner regions, the hypothesis that high and low mass galaxies of low concentration are from the same population and that high and low concentration galaxies of low mass are from the same population can be rejected, with a p-value of 2.5 10-4 for both. There is no statistical difference for the high mass galaxies. That the high mass sample does not show a difference in metallicity for concentration groups may either mean that concentration does not play a large role in metallicity trends or that it does not play a role in the range of concentration covered (). Regardless of the driving force for the metallicity relations, we find that galaxies with both low mass and low concentration have a lower mean light-weighted metallicity in the inner regions than other galaxies in our sample.
8 Discussion
We have examined the connection between the globally averaged light-weighted ages and metallicities of S0 galaxies and other global properties, such as stellar mass and concentration. We have also investigated age and metallicity gradients in S0s. We find that at all radii, S0 galaxies with lower mass and lower concentration have younger light-weighted ages and lower light-weighted metallicities. We have also found that virtually all S0 galaxies in our sample have negative metallicity gradients, with an average value of [Z/H]log(r/Re) -0.6 0.5, consistent with published results. On the other hand, the radial behavior of age in S0s is heterogeneous; both positive and negative age gradients are found. We observe an increase in age with radius for 58% of our sample, a decrease for 19%, and little change ( 1 Gyr) for 23%, and a mean age gradient of agelog(r/Re) 2.3 4.6 Gyr dex-1. For 24% of our sample, we find populations with substantially old light-weighted ages ( 10 Gyr) in the outer region of the galaxy. We now consider the implications of these results.
8.1 Mass and Concentration Relations
The mass-metallicity trends that we observe extend into the outer regions of the galaxy, which may be dominated by a disk component, but we can not be certain without full bulge-disk decompositions of our galaxies. We assume here that the inner regions are bulge dominated, but this, as well, is not certain without decomposition analysis.
Both high galaxy concentration and high galaxy mass point to a higher bulge mass. We speculate whether a relation between the bulge mass with age and metallicity in the inner and outer regions favor a particular model for S0 formation. Observations consistent with bulge growth through internal (i.e. driven by disk instabilities) and external (i.e. driven by satellites) secular evolution have been noted in various studies of late type spiral galaxies (Courteau et al., 1996; Combes, 2000; Ellis et al., 2001; Kannappan et al., 2004; Kormendy & Kennicutt, 2004; Barway et al., 2007). A small bulge, such as in late type spirals or low mass, low concentration S0s, is more likely to contain associated star formation from secular evolution, even if most of the mass has an earlier origin (Ellis et al., 2001). Indeed, the spectroscopic analysis of stellar populations by MacArthur et al. (2009) reveals that 20% of the mass of late type spiral bulges consists of stars less than 1Gyr (although, 70% of the bulge light comes from these young stars).
The merging scenario provides another explanation for the age and metallicity trend with mass and concentration in the inner region. It has been shown analytically that positive correlations of mass with average age can be a natural consequence of hierarchical merging (Neistein et al., 2006). As well, detailed semi-analytic modeling of hierarchical merging that includes enhanced feedback processes such as AGN, yield more extended star formation histories in less massive galaxies, leading to positive correlations of mass with average age and metallicity (Cole et al., 1994; Bower et al., 2006; Croton et al., 2006; De Lucia et al., 2006).
Thus, the fact that we find mass-metallicity relations for the inner regions of S0s does not discriminate between models where the bulge is formed through major mergers versus secular evolution models; they both predict age-mass and mass-metallicity relations for the bulges of S0s. Note that such relations also naturally result in a “monolithic collapse” scenario.
However, we see mass-metallicity relations in the outer regions as well. Can this point toward a particular formation mechanism? Yoachim & Dalcanton (2006) propose that increased outflows in low mass disks at early times (in sub-units before assembling into a disk) allows a mass-metallicity relation in disks to be established early so that hierarchical merging may be able to explain the observed mass-metallicity relation in the outer regions of S0 galaxies. It is unclear whether such a relation can be explained by secular evolution considering star formation must be efficient enough in the outer regions for enrichment to occur. While the mass-metallicity relation observed in the outer regions of S0 galaxies may be a useful discriminant of formation mechanisms, predictions from both merger and secular evolution models have yet to consider this scenario.
The parallel between our finding of younger ages for low mass and low concentration S0s and a similar finding that late type spirals are younger than earlier types (M04) is consistent with a similar formation picture for S0s and spirals. We have demonstrated in §7.3 that the structural transition in “transition” galaxies correlates with a transition in SP properties between S0s and spirals; as with the spiral galaxies observed by M04, transition S0 galaxies do not show the tail of increasing ages that we observe for non-transition galaxies. In fact, the majority of spiral galaxies are shown to have decreasing ages with radius (M04). The transition S0 galaxies thus appear to bridge the gap between S0 and spiral galaxies, supporting a formation connection between the two groups. Transition galaxies are likely candidates for descendants of spiral galaxies that have lost or exhausted their gas. However, the fact that many transition galaxies in our sample have large stellar masses is inconsistent with the proposed mass dichotomy in S0 formation (Jorgensen & Franx, 1994; Mehlert et al., 2003; Barway et al., 2007), namely that only low mass S0s originated from spirals, while the high mass S0s have a formation history similar to ellipticals.
8.2 Old Outskirts Galaxies
We have found a subsample of galaxies with large positive age gradients and significantly old outer regions ( 10 Gyr). These galaxies appear to form a separate evolutionary class from the rest of the sample, showing no preference for mass, concentration, or environment. Their physical appearance is largely featureless. We have discussed potential observational and model dependent caveats for the result of old outskirts in §7.2.1. Assuming this result is robust, we explore tentative implications of galaxy evolution.
Until we gather more information from light decompositions, we can only speculate on the nature of these old outskirts galaxies. The old populations in the outer regions either belong to a disk or a spheroid component. In the case of a spheroid membership, the galaxy may have a dominant spheroid population with an embedded disk so that the radial increase in ages is due to the change in luminosity-weighted ages from a disk-dominated to a spheroid-dominated region. Peletier et al. (2007) found that the minor axis, and thus the spheroid component, of 24 early-type (Sa) galaxies has uniformly old SPs. It is this old spheroidal component that might be dominating in the outer regions of old outskirts S0s. In this scenario, old outskirts galaxies would be closely tied to elliptical galaxies. In fact, the latter are known to harbor small embedded disks (Krajnović et al., 2008, M10), hence the old outskirts S0s would tend to straddle between ellipticals and S0 galaxies. Luminous red halos have also been observed around spiral galaxies (Lequeux et al., 1998; Zibetti et al., 2004; Zackrisson et al., 2006). However, Zackrisson et al. (2006) found that old populations cannot explain the red colors of many spiral halos without invoking an extremely bottom-heavy IMF.
If, instead, the outer regions of old outskirts galaxies are dominated by a disk component, their stars would have formed long ago. Given uncertainties in SP modeling, setting an absolute age on the formation of the disk is difficult, but in old outskirts galaxies the stars dominating the light in the outer regions clearly formed long ago (possibly 10 Gyr). Moderately old disks ( 7 Gyr) have been predicted in theoretical models where the main infall phase precedes the onset of star formation (Ferguson & Clarke, 2001). As well, Koo et al. (2005) find several very red luminous disks at high redshift, implying that at not all massive disks are young; some old, massive S0s may have already existed in the field. For reference, stars formed at would be 7 Gyr old at the present epoch. The presence of a disk component implies that no major, disk-destroying event has occurred since the formation of the dynamically fragile stellar disk; stellar disks are thought to be destroyed in merger of galaxies with a mass ratio 1/4 (Mihos & Hernquist, 1996; Steinmetz & Navarro, 2002). Thus, the very old ages of the galaxies’ outskirts (possibly 10 Gyr) place a constraint on models of hierarchical merging if the outskirts have a disky origin.
Previous studies of spirals with low present day B/D suggest that hierarchical models may require no major merger since the formation of the stellar disk (Weinzirl et al., 2009). In principle, low B/D spirals may be produced through gas rich mergers, which produce a new disk in the merger remnant (Hopkins et al., 2009; Richard et al., 2010). However, our observations of old outskirts galaxies cannot be explained through these mergers because new stars will necessarily form in the disk and would then dominate the light. Thus, the requirement of no major merger since (using an age of 10 Gyr), if the outer regions are indeed a disk, is necessary to explain our observations.
Alternately, old stars may have somehow been redistributed into the outer regions. However, because the integrated light is heavily weighted toward young SPs, the old light-weighted ages in the galaxies’ outskirts imply that virtually no young stars exist in this region. An accretion of old satellites to the outer disk may be possible. For example, de Jong et al. (2007) found that a stream around M83 is made of an old stellar population. Additionally, a migration of old stars from the center outward is predicted in the models of Roškar et al. (2008) through spiral corotation resonance scattering, although the lack of spiral structure in S0 galaxies may make this difficult.
The large ages and low metallicities in the outer regions of old outskirts galaxies resemble those of thick disks observed around edge-on galaxies (Dalcanton & Bernstein, 2002; Yoachim & Dalcanton, 2006) and in the Milky Way (Gilmore et al., 1989). Perhaps the populations in the old outskirts of galaxies belong to a thick disk. Indeed thick disks may form during a gas-rich merger event and an embedded thin disk forms afterward (Richard et al., 2010). If a galaxy has its gas stripped shortly after this merger event, perhaps part or all of the young thin disk will be kept from forming and the galaxy will contain old outskirts. Unfortunately, our galaxies are seen face-on so it is difficult to determine whether the outer populations belong to a thick disk. We note that the Richard et al. (2010) models invariably show a major starburst occurring during the merger. Thus, mergers like these must be old if they are to explain the outer populations of old outskirts galaxies.
Most disk/spiral galaxies show a decrease in light-weighted age with radius (Bell & de Jong, 2000; MacArthur et al., 2004; Roediger et al., 2010), a trend opposite to what is observed in old outskirts galaxies. The positive age gradients of old outskirts galaxies, which may be due to a difference in bulge and disk age and/or to an age gradient in the disk, can offer clues to their formation. If the bulge (or the population dominating the light in the bulge) formed after the disk, some mass in the bulge would need to be created without either destroying the fragile disk or adding star formation to it. Internal secular evolution in gaseous galaxies is expected to fuel star formation in a centralized disk. Internal secular evolution may play a role in creating the young bulges in old outskirts galaxies, but other processes would be required to explain the suppression of star formation in the disk. Alternately, Hernquist & Mihos (1995) show that even a 10-to-1 merger can drive up to 50% of the primary galaxy’s gas into its center. Not only will this help to build up a young bulge, but it will suppress star formation in the disk.
A positive age gradient in the disk component itself could be due to either the original formation of the disk or to a later event that transformed the galaxy into an S0. Proposed theories of S0 formation through external gas removal processes (Quilis et al., 2000; Kawata & Mulchaey, 2008; Kronberger et al., 2008) call for an outside-in stripping of the galaxy. The resultant galaxy will have a lower light-weighted age inside the truncation radius than beyond it. Additionally, enhancement of star formation from several gas removal processes is expected in the central regions, again yielding an increase in age with radius. The events that are expected to bring about this age difference, however, are also expected to be short-lived with a timescale around 500 Myr (Kronberger et al., 2008). To create the observed large positive age gradient, star formation must be sustained in the inner regions for a very long time, possibly through minor accretion. The age increase in old outskirts galaxies’ disks may instead be due to the original formation of the disk.
Positive age gradients in disks are not exclusive to S0 galaxies. Taylor et al. (2005) found that the outer regions of some late type spiral galaxies are redder and the inner regions are bluer than other galaxies in his sample, suggesting that this could be an indicator of outside-in formation, with significant recent star formation in the inner regions and minimal recent star formation in the outer regions. A positive age gradient is predicted in simulations of the dissipational collapse of gas embedded in a spherical dark matter halo through scattering of disk stars (Roškar et al., 2008). Beyond a nominal radius, Roškar et al. (2008) find an increase in mean stellar age for their model disk galaxy. Spiral arms at some point in the history of the host galaxy are a necessary component for this model.
The scenario of the thick disk forming first may also be used to explain radial trends in old outskirts galaxies. Most likely, several processes are involved, i.e. perhaps the formation of the thick disk is halted through a partial stripping mechanism. Young disks embedded in the thick old disk and the outside-in disk growth in the models of Richard et al. (2010) may explain the trend in radius toward older ages observed in old outskirts galaxies.
In summary, the observed mass-metallicity trends in S0 galaxies are consistent with a merging scenario for the formation of the bulge, but the cause of the relation that we observe in the outer regions has yet to be considered in models. Our results, in particular those of transition galaxies that straddle S0 and spiral galaxies, are consistent with the formation of S0 galaxies through the transformation of spiral galaxy disks. It is possible that old outskirts galaxies require no major merger to have occurred in a very long time. These galaxies may harbor a thick disk in their outer region, while the thin disk was stripped early. However, until the structural components that make up these outer regions are resolved (e.g. disk versus spheroidal), we can only speculate about the nature of these galaxies.
9 Conclusion
We have presented optical (SDSS g and r) and NIR (J and/or H) surface photometry for a sample of 59 S0 galaxies covering a range in stellar mass and light concentration. Radial age and metallicity gradients out to at least 5 Re are derived from comparison of the observed r and r-J) colors with SP models.
We find an average central light-weighted age of 4 Gyr and central metallicity of [Z/H] 0.2 dex. For most of the galaxies in our sample, a large negative metallicity gradient is found with radius, with an average of [Z/H]log(r/Re) -0.6 0.5. Radial age trends are more heterogeneous. An increase in age with radius is found for 58% of our sample, a decrease for 19%, and little change for 23% of it.
The outer regions of 14 out of 59 S0 galaxies have very old light-weighted ages ( 10 Gyr) and also exhibit large increases in light-weighted age from the center outward. These old outskirts galaxies are found in a range of environments, masses, and concentrations. None of these galaxies shows nascent spiral structure. Determining the structural component (i.e. disk versus spheroidal) that makes up the outer region is a necessary step to further probe the formation history of these galaxies. Assuming that the outer region is a disk, old outskirts galaxies may be showing the thick disk in the outer region, while the thin disk was stripped early. It is possible that old outskirts galaxies require no major merger to have occurred in a very long time.
We find that mean light-weighted age and metallicity correlate with both mass and concentration; galaxies with both lower mass and lower concentration have, on average, younger central ages and lower metallicities than other systems in our sample. The mass-metallicity relation extends to the outer regions of the galaxy. The observed mass-metallicity trends in S0 galaxies are consistent with a merging formation of these galaxies. The combination of a statistically incomplete sample regarding environment (e.g., all of the observed lowest mass galaxies are in the Virgo cluster high density environment) and a scarcity of high density environment galaxies makes it difficult to draw conclusions regarding the effect of environment on age or metallicity.
We wish to thank S. Charlot and G. Bruzual for providing their new models, J. Miner for providing density calculations, J. Roediger and S. Kannappan for stimulating discussions, and Brent Tully who made all of our NIR observations at the UH 2.2m possible. We thank the referee for numerous thoughtful comments that led to a much improved presentation. This study was partially funded by NSF grant AST 04-06443 to the University of North Carolina. L.C. acknowledges the support of the Linda Dykstra Science Dissertation Fellowship and S.C. acknowledges the support of NSERC through Discovery grant. This research has made use of the NASA/IPAC Extragalactic Database (NED) which is operated by the Jet Propulsion Laboratory, California Institute of Technology, under contract with the National Aeronautics and Space Administration.
References
- Balcells & Peletier (1994) Balcells M., Peletier R. F., 1994, AJ, 107, 135
- Barnes (2002) Barnes J. E., 2002, MNRAS, 333, 481
- Barway et al. (2007) Barway S., Kembhavi A., Wadadekar Y., Ravikumar C. D., Mayya Y. D., 2007, ApJ, 661, L37
- Bedregal et al. (2008) Bedregal A. G., Aragón-Salamanca A., Merrifield M. R., Cardiel N., 2008, MNRAS, 387, 660
- Bell & de Jong (2000) Bell E. F., de Jong R. S., 2000, MNRAS, 312, 497
- Bell et al. (2003) Bell E. F., McIntosh D. H., Katz N., Weinberg M. D., 2003, ApJS, 149, 289
- Bell et al. (2004) Bell E. F., Wolf C., Meisenheimer K., Rix H.-W., Borch A., Dye S., Kleinheinrich M., Plus 2 more 2004, ApJ, 608, 752
- Bertelli et al. (2008) Bertelli G., Girardi L., Marigo P., Nasi E., 2008, A&A, 484, 815
- Boselli et al. (2008) Boselli A., Boissier S., Cortese L., Gavazzi G., 2008, ApJ, 674, 742
- Bothun & Gregg (1990) Bothun G. D., Gregg M. D., 1990, ApJ, 350, 73
- Bower et al. (2006) Bower R. G., Benson A. J., Malbon R., Helly J. C., Frenk C. S., Baugh C. M., Cole S., Lacey C. G., 2006, MNRAS, 370, 645
- Bruzual & Charlot (2003) Bruzual G., Charlot S., 2003, MNRAS, 344, 1000
- Butcher & Oemler (1978) Butcher H., Oemler Jr. A., 1978, ApJ, 226, 559
- Byrd & Valtonen (1990) Byrd G., Valtonen M., 1990, ApJ, 350, 89
- Caldwell (1983) Caldwell N., 1983, ApJ, 268, 90
- Caldwell et al. (2003) Caldwell N., Rose J. A., Concannon K. D., 2003, AJ, 125, 2891
- Charlot & Bruzual (2010) Charlot S., Bruzual G., 2010, in preparation
- Cole et al. (1994) Cole S., Aragon-Salamanca A., Frenk C. S., Navarro J. F., Zepf S. E., 1994, MNRAS, 271, 781
- Combes (2000) Combes F., 2000, in Combes F., Mamon G. A., Charmandaris V., eds, Dynamics of Galaxies: from the Early Universe to the Present Vol. 197 of Astronomical Society of the Pacific Conference Series, Bar-driven Galaxy Evolution and Time-scales to Feed AGN. pp 15–+
- Conroy et al. (2009) Conroy C., White M., Gunn J. E., 2009, ArXiv e-prints
- Cooper et al. (2008) Cooper M. C., Tremonti C. A., Newman J. A., Zabludoff A. I., 2008, MNRAS, 390, 245
- Courteau (1996) Courteau S., 1996, ApJS, 103, 363
- Courteau et al. (1996) Courteau S., de Jong R. S., Broeils A. H., 1996, ApJ, 457, L73+
- Croton et al. (2006) Croton D. J., Springel V., White S. D. M., De Lucia G., Frenk C. S., Gao L., Jenkins A., plus 3 more 2006, MNRAS, 365, 11
- Dalcanton & Bernstein (2002) Dalcanton J. J., Bernstein R. A., 2002, AJ, 124, 1328
- de Jong & Davies (1997) de Jong R. S., Davies R. L., 1997, MNRAS, 285, L1
- de Jong et al. (2007) de Jong R. S., Seth A. C., Bell E. F., Brown T. M., Bullock J. S., Courteau S., Dalcanton J. J., plus 6 more 2007, in A. Vazdekis & R. F. Peletier ed., IAU Symposium Vol. 241 of IAU Symposium, GHOSTS: The Resolved Stellar Outskirts of Massive Disk Galaxies. pp 503–504
- De Lucia et al. (2006) De Lucia G., Springel V., White S. D. M., Croton D., Kauffmann G., 2006, MNRAS, 366, 499
- Dressler (1980) Dressler A., 1980, ApJ, 236, 351
- Dressler & Gunn (1983) Dressler A., Gunn J. E., 1983, ApJ, 270, 7
- Ellis et al. (2001) Ellis R. S., Abraham R. G., Dickinson M., 2001, ApJ, 551, 111
- Eminian et al. (2008) Eminian C., Kauffmann G., Charlot S., Wild V., Bruzual G., Rettura A., Loveday J., 2008, MNRAS, 384, 930
- Falco et al. (1999) Falco E. E., Kurtz M. J., Geller M. J., Huchra J. P., Peters J., Berlind P., Mink D. J., Plus 2 more 1999, PASP, 111, 438
- Ferguson & Clarke (2001) Ferguson A. M. N., Clarke C. J., 2001, MNRAS, 325, 781
- Fisher et al. (1996) Fisher D., Franx M., Illingworth G., 1996, ApJ, 459, 110
- Freeman (1970) Freeman K. C., 1970, ApJ, 160, 811
- Fritze v. Alvensleben (2004) Fritze v. Alvensleben U., 2004, in D. L. Block, I. Puerari, K. C. Freeman, R. Groess, & E. K. Block ed., Penetrating Bars Through Masks of Cosmic Dust Vol. 319 of Astrophysics and Space Science Library, On the Origin of SO Galaxies. pp 81–+
- Garnett (2002) Garnett D. R., 2002, ApJ, 581, 1019
- Gilmore et al. (1989) Gilmore G., Wyse R. F. G., Kuijken K., 1989, ARA&A, 27, 555
- Graves et al. (2009) Graves G. J., Faber S. M., Schiavon R. P., 2009, ApJ, 693, 486
- Hernquist & Mihos (1995) Hernquist L., Mihos J. C., 1995, ApJ, 448, 41
- Hinshaw et al. (2009) Hinshaw G., Weiland J. L., Hill R. S., Odegard N., Larson D., Bennett C. L., Dunkley J., plus 14 more 2009, ApJS, 180, 225
- Hopkins et al. (2009) Hopkins P. F., Somerville R. S., Cox T. J., Hernquist L., Jogee S., Kereš D., Ma C.-P., Robertson B., Stewart K., 2009, MNRAS, 397, 802
- Icke (1985) Icke V., 1985, A&A, 144, 115
- Jorgensen & Franx (1994) Jorgensen I., Franx M., 1994, ApJ, 433, 553
- Kannappan et al. (2009a) Kannappan S., Guie J., Baker A., 2009a, AJ, submitted
- Kannappan et al. (2009b) Kannappan S. J., Guie J. M., Baker A. J., 2009b, AJ, 138, 579
- Kannappan et al. (2004) Kannappan S. J., Jansen R. A., Barton E. J., 2004, AJ, 127, 1371
- Kauffmann et al. (2003) Kauffmann G., Heckman T. M., White S. D. M., Charlot S., Tremonti C., Brinchmann J., Bruzual G., Plus 15 more 2003, MNRAS, 341, 33
- Kawata & Mulchaey (2008) Kawata D., Mulchaey J. S., 2008, ApJ, 672, L103
- Kent (1985) Kent S. M., 1985, ApJS, 59, 115
- Koo et al. (2005) Koo D. C., Simard L., Willmer C. N. A., Gebhardt K., Bouwens R. J., Kauffmann G., Crosby T., plus 8 more 2005, ApJS, 157, 175
- Kormendy & Kennicutt (2004) Kormendy J., Kennicutt Jr. R. C., 2004, ARA&A, 42, 603
- Krajnović et al. (2008) Krajnović D., Bacon R., Cappellari M., Davies R. L., de Zeeuw P. T., Emsellem E., Falcón-Barroso J., plus 6 more 2008, MNRAS, 390, 93
- Kronberger et al. (2008) Kronberger T., Kapferer W., Ferrari C., Unterguggenberger S., Schindler S., 2008, A&A, 481, 337
- Kuntschner et al. (2006) Kuntschner H., Emsellem E., Bacon R., Bureau M., Cappellari M., Davies R. L., de Zeeuw P. T., plus 5 more 2006, MNRAS, 369, 497
- Le Borgne et al. (2003) Le Borgne J., Bruzual G., Pelló R., Lançon A., Rocca-Volmerange B., Sanahuja B., Schaerer D., Soubiran C., Vílchez-Gómez R., 2003, A&A, 402, 433
- Lee et al. (2009) Lee H., Worthey G., Dotter A., Chaboyer B., Jevremović D., Baron E., Briley M. M., Ferguson J. W., Coelho P., Trager S. C., 2009, ApJ, 694, 902
- Lequeux et al. (1998) Lequeux J., Combes F., Dantel-Fort M., Cuillandre J., Fort B., Mellier Y., 1998, A&A, 334, L9
- MacArthur et al. (2010) MacArthur L., McDonald M., Courteau S., Gonzalez J. J., 2010, submitted to ApJ
- MacArthur et al. (2004) MacArthur L. A., Courteau S., Bell E., Holtzman J. A., 2004, ApJS, 152, 175
- MacArthur et al. (2003) MacArthur L. A., Courteau S., Holtzman J. A., 2003, ApJ, 582, 689
- MacArthur et al. (2009) MacArthur L. A., González J. J., Courteau S., 2009, MNRAS, 395, 28
- Maraston (2005) Maraston C., 2005, MNRAS, 362, 799
- Marigo & Girardi (2007) Marigo P., Girardi L., 2007, A&A, 469, 239
- Marzke et al. (1994) Marzke R. O., Huchra J. P., Geller M. J., 1994, ApJ, 428, 43
- McDonald et al. (2009a) McDonald M., Courteau S., Tully R. B., 2009a, MNRAS, 393, 628
- McDonald et al. (2009b) McDonald M., Courteau S., Tully R. B., 2009b, MNRAS, 394, 2022
- McDonald et al. (2010) McDonald M., Courteau S., Tully R. B., Roediger J., 2010, MNRAS, submitted (M10)
- Mehlert et al. (2003) Mehlert D., Thomas D., Saglia R. P., Bender R., Wegner G., 2003, A&A, 407, 423
- Mihos & Hernquist (1996) Mihos J. C., Hernquist L., 1996, ApJ, 464, 641
- Moore et al. (1996) Moore B., Katz N., Lake G., Dressler A., Oemler A., 1996, Nature, 379, 613
- Moorthy & Holtzman (2006) Moorthy B. K., Holtzman J. A., 2006, MNRAS, 371, 583
- Navarro et al. (1995) Navarro J. F., Frenk C. S., White S. D. M., 1995, MNRAS, 275, 56
- Neistein et al. (2006) Neistein E., van den Bosch F. C., Dekel A., 2006, MNRAS, 372, 933
- Nelan et al. (2005) Nelan J. E., Smith R. J., Hudson M. J., Wegner G. A., Lucey J. R., Moore S. A. W., Quinney S. J., Suntzeff N. B., 2005, ApJ, 632, 137
- Nilson (1973) Nilson P., 1973, Uppsala general catalogue of galaxies
- Norris et al. (2006) Norris M. A., Sharples R. M., Kuntschner H., 2006, MNRAS, 367, 815
- Peletier & Balcells (1996) Peletier R. F., Balcells M., 1996, AJ, 111, 2238
- Peletier et al. (1999) Peletier R. F., Balcells M., Davies R. L., Andredakis Y., Vazdekis A., Burkert A., Prada F., 1999, MNRAS, 310, 703
- Peletier et al. (2007) Peletier R. F., Falcón-Barroso J., Bacon R., Cappellari M., Davies R. L., de Zeeuw P. T., Emsellem E., plus 6 more 2007, MNRAS, 379, 445
- Poggianti et al. (2001) Poggianti B. M., Bridges T. J., Carter D., Mobasher B., Doi M., Iye M., Kashikawa N., plus 6 more 2001, ApJ, 563, 118
- Portinari et al. (2004) Portinari L., Sommer-Larsen J., Tantalo R., 2004, MNRAS, 347, 691
- Quilis et al. (2000) Quilis V., Moore B., Bower R., 2000, Science, 288, 1617
- Rawle et al. (2010) Rawle T. D., Smith R. J., Lucey J. R., 2010, MNRAS, 401, 852
- Richard et al. (2010) Richard S., Brook C. B., Martel H., Kawata D., Gibson B. K., Sanchez-Blazquez P., 2010, MNRAS, 402, 1489
- Rickes et al. (2009) Rickes M. G., Pastoriza M. G., Bonatto C., 2009, ArXiv e-prints
- Roediger et al. (2010) Roediger J., Courteau S., McDonald M., MacArthur L., 2010, submitted for publication
- Roškar et al. (2008) Roškar R., Debattista V. P., Quinn T. R., Stinson G. S., Wadsley J., 2008, ApJ, 684, L79
- Roškar et al. (2008) Roškar R., Debattista V. P., Stinson G. S., Quinn T. R., Kaufmann T., Wadsley J., 2008, ApJ, 675, L65
- Sánchez-Blázquez et al. (2007) Sánchez-Blázquez P., Forbes D. A., Strader J., Brodie J., Proctor R., 2007, MNRAS, 377, 759
- Sánchez-Blázquez et al. (2006) Sánchez-Blázquez P., Gorgas J., Cardiel N., González J. J., 2006, A&A, 457, 809
- Schechter (1976) Schechter P., 1976, ApJ, 203, 297
- Schiavon (2007) Schiavon R. P., 2007, ApJS, 171, 146
- Schiavon et al. (2002) Schiavon R. P., Faber S. M., Rose J. A., Castilho B. V., 2002, ApJ, 580, 873
- Schlegel et al. (1998) Schlegel D. J., Finkbeiner D. P., Davis M., 1998, ApJ, 500, 525
- Serra et al. (2008) Serra P., Trager S. C., Oosterloo T. A., Morganti R., 2008, A&A, 483, 57
- Shapley et al. (2005) Shapley A. E., Steidel C. C., Erb D. K., Reddy N. A., Adelberger K. L., Pettini M., Barmby P., Huang J., 2005, ApJ, 626, 698
- Sil’chenko (2006) Sil’chenko O. K., 2006, ApJ, 641, 229
- Skrutskie et al. (2006) Skrutskie M. F., Cutri R. M., Stiening R., Weinberg M. D., Schneider S., Carpenter J. M., Beichman C., plus 24 more 2006, AJ, 131, 1163
- Smith et al. (2009) Smith R. J., Lucey J. R., Hudson M. J., 2009, MNRAS, 400, 1690
- Steinmetz & Navarro (2002) Steinmetz M., Navarro J. F., 2002, New Astronomy, 7, 155
- Strateva et al. (2001) Strateva I., Ivezić Ž., Knapp G. R., Narayanan V. K., Strauss M. A., Gunn J. E., Lupton R. H., plus 22 more 2001, AJ, 122, 1861
- Tamura & Ohta (2003) Tamura N., Ohta K., 2003, AJ, 126, 596
- Taylor et al. (2005) Taylor V. A., Jansen R. A., Windhorst R. A., Odewahn S. C., Hibbard J. E., 2005, ApJ, 630, 784
- Thomas et al. (2005) Thomas D., Maraston C., Bender R., Mendes de Oliveira C., 2005, ApJ, 621, 673
- Tikhonov et al. (2003) Tikhonov N. A., Galazutdinova O. A., Aparicio A., 2003, A&A, 401, 863
- Tonini et al. (2009) Tonini C., Maraston C., Devriendt J., Thomas D., Silk J., 2009, MNRAS, 396, L36
- Trager et al. (2000) Trager S. C., Faber S. M., Worthey G., González J. J., 2000, AJ, 119, 1645
- Tremonti et al. (2004) Tremonti C. A., Heckman T. M., Kauffmann G., Brinchmann J., Charlot S., White S. D. M., Seibert M., plus 5 more 2004, ApJ, 613, 898
- van den Bergh (1994) van den Bergh S., 1994, AJ, 107, 153
- Vazdekis (1999) Vazdekis A., 1999, ApJ, 513, 224
- Vazdekis et al. (1996) Vazdekis A., Casuso E., Peletier R. F., Beckman J. E., 1996, ApJS, 106, 307
- Vazdekis et al. (2001) Vazdekis A., Kuntschner H., Davies R. L., Arimoto N., Nakamura O., Peletier R., 2001, ApJ, 551, L127
- Weinzirl et al. (2009) Weinzirl T., Jogee S., Khochfar S., Burkert A., Kormendy J., 2009, ApJ, 696, 411
- Wiklind & Henkel (2001) Wiklind T., Henkel C., 2001, A&A, 375, 797
- Worthey (1994) Worthey G., 1994, ApJS, 95, 107
- Yoachim & Dalcanton (2006) Yoachim P., Dalcanton J. J., 2006, AJ, 131, 226
- York et al. (2000) York D. G., Adelman J., Anderson Jr. J. E., Anderson S. F., Annis J., Bahcall N. A., Bakken J. A., plus 137 more 2000, AJ, 120, 1579
- Zackrisson et al. (2006) Zackrisson E., Bergvall N., Östlin G., Micheva G., Leksell M., 2006, ApJ, 650, 812
- Zibetti et al. (2004) Zibetti S., White S. D. M., Brinkmann J., 2004, MNRAS, 347, 556
| Galaxy | Morph | a | b | Vr | Distance | Incl. | Type |
|---|---|---|---|---|---|---|---|
| (’) | (’) | ( km s-1) | (Mpc) | (∘) | |||
| UGC04330 | SB0 | 1.1 | 1.0 | 4865 | 69.4 | 34.6 | B |
| UGC04596 | S0 | 1.2 | 1.0 | 9439 | 131.7 | 25.4 | T |
| UGC04599 | S0 | 2.1 | 2.1 | 2072 | 31.8 | 18.3 | T |
| UGC04631 | S0 | 1.1 | 1.0 | 4159 | 60.6 | 24.3 | N |
| UGC04639 | S0? | 1.4 | 1.3 | 8556 | 120.0 | 23.3 | N |
| UGC04737 | S0? | 0.8 | 0.5 | 3813 | 56.0 | 53.3 | N |
| UGC04869 | S0? | 2.0 | 0.7 | 6889 | 97.8 | 62.9 | T,B |
| UGC04901 | S0-A? | 1.1 | 1.1 | 8424 | 118.7 | 28.9 | N |
| UGC04910 | S0 | 1.0 | 0.6 | 8353 | 117.8 | 28.9 | N |
| UGC04916 | S0 | 1.2 | 0.9 | 8785 | 123.6 | 36.2 | N |
The full table appears in the electronic edition of the Journal.
From the Uppsala General Catalog (UGC) unless otherwise noted
Major and minor diameter, and radial velocity, from the NASA/IPEC Extragalactic Database (NED)
Distances are corrected for Virgo flow and the Great Attractor, from NED
T (transition galaxy), B (barred, from Hyperleda), N (normal)
From NED if morphology; from Hyperleda if inclination
| Galaxy | T(sec)666Total exposure time in seconds | date | Z.P.(mag)777Zero-point magnitude | 888Standard deviation in the derived zero-points for that field | NS999Number of standard stars in the field |
| UGC04330J | 480 | Apr 2007 | -1.916 | 0.037 | 10 |
| UGC04596H | 480 | Mar 2008 | -1.731 | 0.004 | 3 |
| UGC04599J | 480 | Apr 2007 | -1.713 | 0.034 | 11 |
| UGC04631J | 480 | Apr 2007 | -1.707 | 0.037 | 7 |
| UGC04639J | 480 | Apr 2007 | -1.628 | 0.030 | 9 |
| UGC04737H | 480 | Mar 2008 | -1.819 | 0.201 | 10 |
| UGC04869H | 480 | Mar 2008 | -1.853 | 0.056 | 0 |
| UGC04901J | 480 | Apr 2007 | -1.596 | 0.025 | 9 |
| UGC04910J | 480 | Apr 2007 | -1.579 | 0.057 | 7 |
| UGC04916J | 480 | Apr 2007 | -1.694 | 0.018 | 7 |
The full table appears in the electronic edition of the Journal.
| Inner | Outer | ||||||||||||
|---|---|---|---|---|---|---|---|---|---|---|---|---|---|
| Name | cutoff 101010Outer radial cutoff in arcseconds (”) | age(Gyr) | + | - | [Z/H] | + | - | age(Gyr) | + | - | [Z/H] | + | - |
| H band derived | |||||||||||||
| UGC04596 | 38 | 10.53 | 0.81 | 0.32 | 0.06 | 0.01 | 0.00 | 2.49 | 0.15 | 0.14 | -0.47 | 0.03 | 0.04 |
| UGC04737 | 62 | 4.69 | 0.20 | 0.18 | 0.22 | 0.01 | 0.01 | 7.31 | 1.57 | 1.13 | -0.22 | 0.05 | 0.06 |
| UGC04869 | 100 | 3.97 | – | – | 0.50 | – | – | 2.88 | 0.72 | 0.25 | 0.03 | 0.05 | 0.05 |
| UGC05094 | 60 | 3.48 | 0.15 | – | 0.48 | 0.02 | – | 5.51 | 3.64 | 2.19 | 0.04 | 0.07 | 0.06 |
| UGC05182 | 50 | 5.83 | 0.43 | 0.21 | 0.23 | 0.01 | 0.01 | 13.19 | – | 2.35 | -0.50 | – | 0.05 |
| J band derived | |||||||||||||
| UGC04330 | 43 | 2.08 | – | – | 0.50 | – | – | 3.00 | 0.77 | 0.21 | 0.07 | 0.05 | 0.05 |
| UGC04599 | 58 | 2.73 | 0.05 | 0.06 | -0.01 | 0.02 | 0.02 | 1.05 | 0.02 | 0.02 | -0.48 | 0.02 | 0.02 |
| UGC04631 | 36 | 3.90 | 0.42 | 0.16 | 0.19 | 0.02 | 0.01 | 13.69 | – | 1.08 | -0.69 | – | 0.23 |
| UGC04639 | 58 | 4.76 | 0.27 | 0.24 | 0.28 | 0.02 | 0.02 | 2.17 | 0.33 | 0.25 | 0.19 | 0.03 | 0.04 |
| UGC04901 | 90 | 3.49 | 0.08 | 0.03 | 0.40 | 0.01 | 0.01 | 2.50 | – | – | 0.47 | – | – |
The full table appears in the electronic edition of the Journal.
| Name | rtot | gtot | Htot | Jtot | Rer(”) | g-rtot | r-Htot | r-Jtot |
|---|---|---|---|---|---|---|---|---|
| UGC04596 | 14.0 | 14.7 | 11.4 | – | 9.9 | 0.7 | 2.6 | – |
| UGC04737 | 13.2 | 14.0 | 10.4 | – | 8.2 | 0.8 | 2.8 | – |
| UGC04869 | 12.9 | 13.8 | 10.0 | – | 11.9 | 0.8 | 3.0 | – |
| UGC05094 | 14.0 | 14.8 | 11.2 | – | 8.3 | 0.8 | 2.8 | – |
| UGC05182 | 13.0 | 13.8 | 10.4 | – | 10.6 | 0.9 | 2.6 | – |
| UGC05403 | 13.3 | 14.1 | 10.6 | – | 10.7 | 0.8 | 2.7 | – |
| UGC05419 | 12.3 | 13.0 | 9.7 | – | 19.0 | 0.7 | 2.6 | – |
| UGC05568 | 12.1 | 12.8 | 9.7 | – | 15.3 | 0.7 | 2.4 | – |
| UGC05766 | 12.2 | 12.9 | 9.6 | – | 17.2 | 0.8 | 2.6 | – |
| UGC08886 | 12.9 | 13.7 | 10.1 | – | 6.1 | 0.8 | 2.8 | – |
The full table appears in the electronic edition of the Journal.
| Bin | Radial range |
|---|---|
| 1 | r/Re |
| 2 | r/Re |
| 3 | r/Re |
| 4 | r/Re |
| 5 | r/Re |
| 6 | r/Re |
| Name | Concentration | Mass | Local Density |
|---|---|---|---|
| (M☉) | (log Mpc-3) | ||
| UGC04330 | 4.4 | 1.22e+11 | 0.40 |
| UGC04596 | 5.3 | 1.02e+11 | -1.41 |
| UGC04599 | 4.4 | 6.97e+09 | 0.29 |
| UGC04631 | 4.9 | 3.88e+10 | 0.45 |
| UGC04639 | 4.7 | 2.29e+11 | -1.22 |
| UGC04737 | 4.7 | 4.92e+10 | -0.07 |
| UGC04869 | 4.7 | 1.87e+11 | -0.29 |
| UGC04901 | 4.2 | 3.62e+11 | 0.43 |
| UGC04910 | 4.9 | 3.24e+11 | 0.94 |
| UGC04916 | 5.3 | 1.95e+11 | -0.72 |
The full table appears in the electronic edition of the Journal.
| Groups | Result |
|---|---|
| Age Trends | |
| inner region ages from J-band and H-band for galaxies in common | 0.81 |
| outer region ages from J-band and H-band for galaxies in common | 0.81 |
| inner ages of high and low concentration galaxies | 0.03 |
| outer ages of high and low concentration galaxies | 0.20 |
| inner ages of high and low mass galaxies | 0.03 |
| outer ages of high and low mass galaxies | 0.06 |
| ages for all bins of high and low concentration galaxies | 1.90E-4 |
| ages for all bins of high and low mass galaxies | 1.70E-5 |
| ages for all bins of high and low mass galaxies with low concentration | 0.09 |
| ages for all bins of high and low mass galaxies with high concentration | 0.02 |
| ages for all bins of high and low concentration galaxies with low mass | 0.19 |
| ages for all bins of high and low concentration galaxies with high mass | 0.04 |
| age differences of transition and featureless disk galaxies | 1.20E-4 |
| outer ages of high and low concentration non-old-outskirts galaxies | 0.34 |
| outer ages of high and low mass non-old-outskirts galaxies | 0.05 |
| outer ages of high and low density non-old-outskirts galaxies | 0.99 |
| mass of old-outskirts and non-old-outskirts galaxies | 0.71 |
| concentration of old-outskirts and non-old-outskirts galaxies | 0.91 |
| environmental density of old-outskirts and non-old-outskirts galaxies | 0.36 |
| Metallicity Trends | |
| inner region metallicity from J-band and H-band for galaxies in common | 0.81 |
| outer region metallicity from J-band and H-band for galaxies in common | 0.81 |
| inner metallicity of high and low concentration galaxies | 7.49E-4 |
| outer metallicity of high and low concentration galaxies | 0.10 |
| inner metallicity of high and low mass galaxies | 6.77E-5 |
| outer metallicity of high and low mass galaxies | 0.01 |
| metallicity for all bins of high and low concentration galaxies | 0.09 |
| metallicity for all bins of high and low mass galaxies | 8.10E-4 |
| metallicity for all bins of high and low mass galaxies with low concentration | 5.90E-6 |
| metallicity for all bins of high and low mass galaxies with high concentration | 0.53 |
| metallicity for all bins of high and low concentration galaxies with low mass | 9.1E-4 |
| metallicity for all bins of high and low concentration galaxies with high mass | 0.06 |
| inner metallicity of high and low mass galaxies with low concentration | 2.5E-4 |
| inner metallicity of high and low mass galaxies with high concentration | 0.20 |
| inner metallicity of high and low concentration galaxies with low mass | 2.5E-4 |
| inner metallicity of high and low concentration galaxies with high mass | 0.68 |
| metallicity gradient () of high and low mass galaxies | 0.30 |
| metallicity gradient () of high and low concentration galaxies | 0.30 |
Probability from Kolmogorov-Smirnov test that the two groups are drawn from the same population. Separation of concentration groups is at 4.7, separation of mass is at 1 M☉, and separation of density is at -0.3.