]http://www.ffn.ub.es/ritort/
Statistical properties of metastable intermediates in DNA unzipping
Abstract
We unzip DNA molecules using optical tweezers and determine the sizes of the cooperatively unzipping and zipping regions separating consecutive metastable intermediates along the unzipping pathway. Sizes are found to be distributed following a power law, ranging from one base pair up to more than a hundred base pairs. We find that a large fraction of unzipping regions smaller than 10 bp are seldom detected because of the high compliance of the released single stranded DNA. We show how the compliance of a single nucleotide sets a limit value around 0.1 N/m for the stiffness of any local force probe aiming to discriminate one base pair at a time in DNA unzipping experiments.
pacs:
87.15.-v, 82.37.Rs, 82.39.Pj, 87.80.NjThe mechanical response of biomolecules to externally applied forces allows us to investigate molecular free energy landscapes with unprecedented accuracy. Single molecule experiments with optical tweezers, atomic force microscope (AFM), and magnetic tweezers are capable of measuring forces in the pN range and energies as small as tenths of kcal/mol. An experiment that nicely illustrates the potential applications of single molecule manipulation is molecular unzipping Bockelmann:2002la ; Woodside:2006kn ; Danilowicz:2003ft ; Rief:1999km ; Koch:2002aa . By applying mechanical force to the ends of biopolymers such as DNA, RNA, and proteins, it is possible to break the bonds that hold the native structure and measure free energies and kinetic rates. In unzipping experiments, a DNA double helix is split into two single strands by pulling them apart and the force vs. distance curve (FDC) measured. A typical FDC shows a force plateau around 15 pN with a characteristic sawtooth pattern corresponding to the progressive separation of the two strands. Mechanical unzipping is also a process mimicked by motor proteins that unwind the double helix. In fact, anticorrelations between unzipping forces and unwinding rates have been found in DNA helicases suggesting that such enzymes unzip DNA by exerting local stress Johnson:2007aa . DNA unzipping experiments have several applications such as identifying specific locations at which proteins and enzymes bind to the DNA Koch:2002aa . Moreover, the strong dependence of the shape of the sawtooth pattern with the sequence might be used for DNA sequencing Baldazzi:2006aa , i.e., a way to infer the DNA sequence from the unzipping data. A limitation factor in these applications is the accuracy at which base pair (bp) locations along the DNA can be resolved. This is mainly determined by the combined stiffness of the force probe and the large compliance of the released single stranded DNA (ssDNA) Bockelmann:2002la ; Voulgarakis:2006aa . The unzipping process, even if carried out reversibly (i.e., infinitely slowly), shows a progression of cooperative unzipping-zipping transitions that involve groups of bps of different sizes. These cooperatively unzipping-zipping transitions regions (CUR) of bps breath in an all-or-none fashion hindering details about the individual bps participating in such transitions. Unzipping experiments pose challenging questions to the experimentalist and the theorist. What is the typical size of these CUR? What is the smallest size of the CUR that can be detected with single molecule techniques? Under what experimental conditions might be possible to resolve large CUR into individual bps? There have been several DNA unzipping studies with controlled force using magnetic tweezers. Because at constant force the unzipping transition is abrupt, this setup is not suitable to answer such questions Danilowicz:2003ft ; Lubensky:2002jb .
We carried out DNA unzipping experiments with optical tweezers fn:instrument ; suppmat and determined the distribution of CUR sizes in DNA fragments a few kbp long. For the experiments, a 2.2 kbp DNA molecular construct was synthesized suppmat . In a typical unzipping experiment one bead is held fixed at the tip of a micropipette and the other bead is optically trapped and the force exerted on the molecule measured. By moving the center of the optical trap at a very low speed (10 nm/s) double stranded DNA (dsDNA) is progressively and quasireversibly converted into ssDNA through a succession of intermediate states corresponding to the successive opening of CUR (Fig. 1a). The experimentally measured FDC shows a sawtoothlike pattern (Fig. 1b) that alternates force rips and gentle slopes. Slopes correspond to the elastic response of the molecule while the force rips correspond to the release of CUR. The slope is due to the combined elastic response of the optical trap and the released ssDNA. The size of a CUR can be inferred from the difference of slopes that precede and follow a given force rip. However, the identification of the CUR sizes is not straightforward as often the slopes cannot be isolated because the experimental FDC exhibits noise. Here we extract the different sizes of the CUR that separate contiguous intermediate states along the unzipping pathway. For that we adopt a Bayesian approach where for each experimental data point (distance, force) we determine the most probable intermediate state to which the data point belongs.
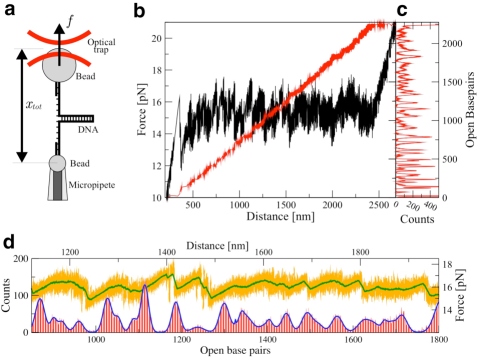
To this end we consider the molecular system as composed of different elements: the optical trap, the dsDNA handles, the released ssDNA and the hairpin at the intermediate state where bases are open. We express the total distance between trap and pipette at a given force as the sum of the extensions of each element at that force:
| (1) |
where is the position of the bead with respect to the center of the optical trap; is the extension of the flanking dsDNA handles; is the extension of the released ssDNA and is the diameter of the bead. The extension of the ssDNA depends on the number of open bases at the intermediate state . The different contributions to Eq. (1) are calculated by using well-known elastic models for biopolymers suppmat . For each experimental data point of the FDC (, ), the intermediate state that passes closest to that point for a fixed force is determined by
| (2) |
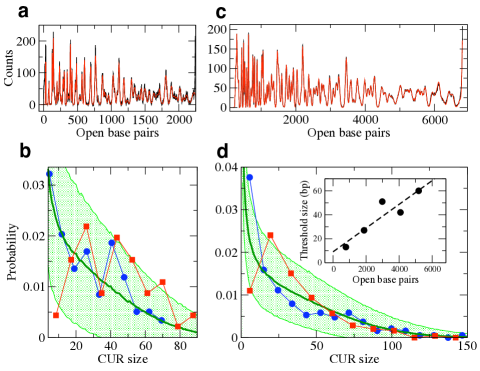
In this way each experimental data point (, ) is associated to a value of (red or gray curve in Fig. 1b). The histogram built from all values results in a series of sharp peaks that can be identified with the many intermediate states (Fig. 1c). The histogram contains information about the stability of the intermediate states: the higher the peak, the higher the stability of that state and the larger the GC content of that part of the sequence (data not shown). The histogram can be fit to a sum of Gaussians each one characterized by its mean, variance and statistical weight (Figs. 1d and 2a). Finally, the size of the CUR is obtained by calculating the difference of the means (in bps) between consecutive Gaussians. The experimental distribution of CUR sizes is shown in Fig. 2b. Sizes range from a few bps up to 90 bp with a maximum number of detected CUR sizes between 20 and 50 bp.
To better understand the distribution of CUR sizes we have computed the sequence dependent free energy profile using a mesoscopic model for DNA based on nearest neighbour bp interactions that includes the different elements of the experimental setup Manosas:2005jw ; Manosas:2007aa . The model is defined by the total free energy of the system, , which gets contributions from the partial free energies of the many intermediates : . From we can determine the theoretical FDC by using the relation, . We have used this model to compute the partial free energies of all intermediates . For a given value of we identify the most stable intermediate corresponding to the value of for which is the absolute minimum [i.e., ]. Integer values of change in a stepwise manner as is continuously varied according to the following scheme
| (3) |
where , , indicate the number of open bps corresponding to consecutive intermediates. Differences between consecutive values of provide the sizes of the CUR. The resulting size distributions are shown in Fig. 2b. The good agreement between the experimental and the theoretical size distributions shows that our method of analysis is capable of discriminating the metastable intermediates during unzipping. There are two remarkable facts in Fig. 2b. First, the mesoscopic model predicts a large fraction of CUR of size smaller than 10 bp that are not experimentally observed. Second, size distributions are not smooth but have a rough shape in agreement with the prediction by the mesoscopic model. In order to check the generality of these results we have repeated the same analysis by unzipping a different and longer molecular construct of 6.8 kbp (Figs. 2c, 2d). The agreement between experiments and theory remains good. Again a large fraction of predicted CUR sizes smaller than 10 bp are not detected suppmat . However, the CUR size distributions are now smoother suggesting that a monotonically decreasing continuous distribution could describe the distribution of CUR in the thermodynamic (infinite DNA length) limit. The fact that CUR sizes show a long tailed distribution indicates that large sizes occur with finite probability. However, large-sized CUR hinder their internal DNA sequence limiting the possibility of sequencing DNA by mechanical unzipping. Under what experimental conditions is it possible to break up large-sized CUR into individual bps?
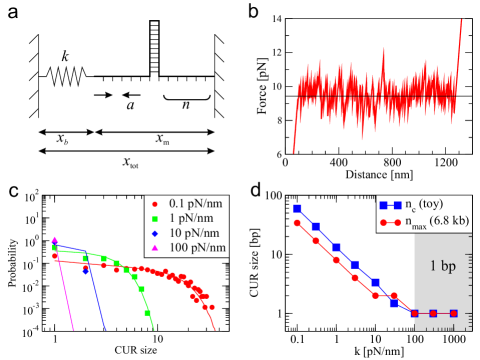
In order to answer this question we have developed a toy model useful to elucidate the mathematical form of the CUR size distribution. Similar distributions have been investigated in the context of DNA thermal denaturation Ambjornsson:2006aa ; Ares:2007aa and DNA unzipping experiments in the constant force ensemble Lubensky:2002jb . Our model contains only two elements: the bead in the optical trap and the DNA construct to be unzipped. The latter is composed of the DNA duplex and the released ssDNA (Fig. 3a). The optical trap is modeled by a harmonic spring with energy, . The DNA duplex is modeled as a one-dimensional random model with bp free energies along the sequence SantaLucia:1998aa . The free energy of a given intermediate is given by . The are distributed according to a normal distribution , where and are the mean and the standard deviation of the energies, respectively (other more realistic energy distributions give similar results). The released ssDNA is taken as inextensible: its extension () is given by , where is the interphosphate distance, is the number of open bps, and the factor 2 stands for the two strands of ssDNA. By using the relation (Fig. 3a), the total energy of the system can be written as
| (4) |
At fixed , the system will occupy the state () that minimizes the total energy of the system, i.e., . The function gives the thermodynamic energy function at the minimum, , and the FDC, . The FDC obtained from this model reproduces the sawtooth pattern that is experimentally observed (Fig. 3b).
Equation 4 can be approximated by neglecting the disorder and taking . This gives,
| (5) |
From this approximation we immediately get the following results , , and . These expressions capture the dependence of the averaged number of open bps, energy, and force on the external parameters suppmat .
Finally we have numerically computed the CUR size distribution. We find that this mostly depends on and . For several combinations of and we simulated realizations (i.e., sequences) of bp sequences, while and were kept constant. The size distributions are excellently fit by a power law with a superexponential cutoff suppmat :
| (6) |
where is the probability of observing a CUR of size ; and (cutoff size) are positive fitting parameters. How much can the toy model predict the experimental results? For the 2.2 kbp sequence the parameters that best fit the experimental histograms are kcal/mol, kcal/mol and pN/m (equal to the stiffness of the trap that we can measure independently). This gives , and (fit shown in Fig. 2b). For the 6.8 kbp sequence we find kcal/mol while and have the same value. This gives , and (fit shown in Fig. 2d). The values of and are not far from the actual mean and standard deviation of the energies of the nearest neighbour model for DNA, =-1.6 kcal/mol, kcal/mol SantaLucia:1998aa . Having not included the elastic effects of the ssDNA in the toy model we should not expect a good match between the fitting and the experimental values.
What is the limiting factor in detecting small-sized CUR? A look at Figs. 1c,2a,2c, and Figs. S14 and S15 in suppmat shows that histograms become smoother as the molecule is progressively unzipped. The increased compliance of the molecular setup as ssDNA is released markedly decreases the resolution in discriminating intermediates. In fact, for the 6.8 kbp construct we found that along the first 1500 bp of the hairpin only 30% of the total number CUR smaller than 10 bp are detected whereas beyond that limit no CUR smaller than that size is discriminated. If we define the threshold size as the size of the CUR above which of the predicted CUR are experimentally detected we find that increases linearly with the number of open bps putting a limit around 10 bp for the smallest CUR size that we can detect (Fig. 2d, inset). What is the limiting factor in resolving large-sized CUR into single bps? Only by applying local force on the opening fork (thereby avoiding the large compliance of the molecular setup) and by increasing the stiffness of the probe might be possible to shrink CUR size distributions down to a single bp Voulgarakis:2006aa . Figures 3c and 3d show how the CUR size distributions shrink and the largest CUR size decreases as the stiffness increases. Its value should be around 50-100 pN/nm for all CUR sizes to collapse into a single bp. Remarkably enough this number is close to the stiffness value expected for an individual DNA nucleotide strecthed at the unzipping force suppmat . Any probe more rigid than that will not do better. Similarly to the problem of atomic friction between AFM tips and surfaces we can define a parameter (defined as the ratio between the rigidities of substrate and cantilever) that controls the transition from stick slip to continuous motion Socoliuc:2004aa . For DNA unzipping we have where is the average free energy of formation of a single bp, is the probe stiffness, and is the interphosphate distance. The value determines the boundary where all CUR are of size equal to one bp (). In our experiments we have and to reach the boundary limit we should have 100 pN/nm consistently with what is shown in Figs 3c and 3d. It is remarkable that the elastic properties of ssDNA lie just at the boundary to allow for one bp discrimination. This suggests that molecular motors that mechanically unwind DNA can locally access the genetic information one bp at a time suppmat .
In summary, we have measured the distribution of sizes of unzipping regions of DNA. A toy model reproduces the experimental results and can be used to infer the experimental conditions under which the unzipping is done one bp at a time. This is achieved when the stiffness of the probe is higher than 100 pN/nm, which coincides with the stiffness of one base of ssDNA at the unzipping force.
J.M.H. acknowledges a grant from the Ministerio de Educación y Ciencia in Spain. F.R. is supported by grants No. FIS2007-3454 and No. HFSP (RGP55-2008).
References
- (1) U. Bockelmann et al., Biophys. J. 82, 1537 (2002).
- (2) M.T. Woodside et al., Science 314, 1001 (2006).
- (3) C. Danilowicz et al., Proc. Natl. Acad. Sci. U.S.A. 100, 1694 (2003).
- (4) M. Rief, H. Clausen-Schaumann, and H. E. Gaub, Nat. Struct, Biol. 6, 346 (1999).
- (5) S.J. Koch et al., Biophys. J. 83, 1098 (2002).
- (6) D. S. Johnson et al., Cell 129, 1299 (2007).
- (7) V. Baldazzi et al., Phys. Rev. Lett. 96, 128102 (2006).
- (8) N. K. Voulgarakis et al., Nano Lett. 6, 1483 (2006).
- (9) D. K. Lubensky and D. R. Nelson, Phys. Rev. E. 65, 031917 (2002).
- (10) Experiments were done in a dual-beam miniaturized optical tweezers with fiber-coupled diode lasers (845 nm wavelength) that produce a piezocontrolled movable optical trap and measure force using conservation of light momentum. The experimental setup is based on C. Bustamante and S. B. Smith, U.S. Patent No. 7 133 132 B2 (2006).
- (11) See Supplementary Information for the appendices.
- (12) M. Manosas and F. Ritort, Biophys. J. 88, 3224 (2005).
- (13) M. Manosas et al., Biophys. J. 92, 3010 (2007).
- (14) S. Ares and G. Kalosakas, Nano Lett. 7, 307 (2007).
- (15) T. Ambjörnsson et al., Phys. Rev. Lett. 97, 128105 (2006); Biophys. J. 92, 2674 (2007).
- (16) J.J. SantaLucia, Proc. Natl. Acad. Sci. U.S.A. 95, 1460 (1998).
- (17) A. Socoliuc et al., Phys. Rev. Lett. 92, 134301 (2004).