Cooling rates of neutron stars and the young neutron star in the Cassiopeia A supernova remnant
Abstract
We explore the thermal state of the neutron star in the Cassiopeia A supernova remnant using the recent result of Ho & Heinke (2009) that the thermal radiation of this star is well-described by a carbon atmosphere model and the emission comes from the entire stellar surface. Starting from neutron star cooling theory, we formulate a robust method to extract neutrino cooling rates of thermally relaxed stars at the neutrino cooling stage from observations of thermal surface radiation. We show how to compare these rates with the rates of standard candles – stars with non-superfluid nucleon cores cooling slowly via the modified Urca process. We find that the internal temperature of standard candles is a well-defined function of the stellar compactness parameter , irrespective of the equation of state of neutron star matter ( and are circumferential and gravitational radii, respectively). We demonstrate that the data on the Cassiopeia A neutron star can be explained in terms of three parameters: , the neutrino cooling efficiency with respect to the standard candle; the compactness ; and the amount of light elements in the heat blanketing envelope. For an ordinary (iron) heat blanketing envelope or a low-mass () carbon envelope, we find the efficiency (standard cooling) for and (slower cooling) for a maximum compactness . A heat blanket containing the maximum mass () of light elements increases by a factor of 50. We also examine the (unlikely) possibility that the star is still thermally non-relaxed.
keywords:
dense matter – equation of state – neutrinos – stars: neutron – supernovae: individual (Cassiopeia A) – X-rays: stars1 Introduction
Neutron stars are born with very high internal temperatures ( K) but gradually cool down. Observing the thermal radiation from cooling isolated neutron stars and comparing their temperatures to theoretical models allows one to explore the (still uncertain) physical properties of superdense matter in neutron star cores (see, e.g., Pethick, 1992; Tsuruta, 1998; Yakovlev & Pethick, 2004; Page et al., 2006, 2009, for review).
The supernova remnant Cassiopeia A (Cas A), at a distance of kpc (Reed et al., 1995), is one of the youngest-known in the Milky Way. The supernova that gave rise to the remnant may have been observed in 1680 (Ashworth, 1980), though this may have been a mis-identification (see, e.g., Thorstensen et al., 2001; Stephenson & Green, 2002, for review and discussion); nevertheless, a supernova explosion in years has been estimated by examining the expansion of the remnant (Fesen et al., 2006). Hereafter we shall assume that Cas A has a current age of yr. Although the supernova remnant is extremely well-studied, the central compact source was only identified in first-light Chandra X-ray observations (Tananbaum, 1999) and subsequently studied by Pavlov et al. (2000); Chakrabarty et al. (2001); Pavlov & Luna (2009). Recently, it was shown (Ho & Heinke, 2009) that the compact source in the remnant is a neutron star, which we will refer to as CANS (for Cas A Neutron Star or CArbon Neutron Star), with a carbon atmosphere and low magnetic field ( G). From the spectral fitting of the Chandra observations, the neutron star (gravitational) mass , (circumferential) radius , and effective (non-redshifted) surface temperature were found to be , km (at confidence), and K, respectively (Ho & Heinke, 2009). Prior to this last work, the possibility to study the CANS thermal evolution was hindered by the assumption that the measured temperature reflected a local hot spot, hence it could only be used to set an upper limit on the surface temperature (Pavlov et al., 2000). However, with the recent results showing that the X-ray emission arises from the entire neutron star surface, can be treated as the average surface temperature. Because the next youngest neutron stars, for which surface thermal emission has been detected, have ages exceeding a thousand years, the CANS serves as a valuable window into the early life of a cooling neutron star.
In this paper we use the theory of neutron star cooling and analyze the thermal state of the CANS. Because cooling theory gives a wealth of cooling scenarios involving many uncertain properties of superdense matter in neutron star interiors (such as composition, equation of state – EOS, superfluid properties of baryons, etc.), we do not test these scenarios one by one. Instead, we propose a robust method to analyze observations of neutron stars of age yr, i.e., those which have thermally relaxed interiors and cool via neutrino emission from their cores. We describe the procedure to extract the neutrino cooling rate of neutron stars (the ratio of their neutrino luminosity to the heat capacity) from observations and to compare the measurements with the theoretical cooling rates of neutron stars with non-superfluid nucleon cores which cool via the modified Urca process of neutrino emission. These theoretical cooling rates can be treated as standard neutrino candles, and the comparison between observations and theory can give valuable information on the physical properties of neutron star interiors. We apply this method to interpret observations of the CANS, evaluate the CANS cooling rate and outline various physical models of CANS internal structure that are compatible with the observations. We also explore the possibility that the CANS is still in a thermally non-relaxed state.
2 Data Analysis
We summarize here the observations and spectral fitting of the CANS used in our study; further details can be found in Ho & Heinke (2009) and Heinke & Ho (2010). Sixteen sets of Chandra X-ray Observatory archival data are considered (see Heinke & Ho 2010 for a listing), all using the ACIS-S charge-coupled device which provides spatial and spectral information (Garmire, 2003). A series of observations, totalling 1 megasecond (the majority of all extant data), was taken in 2004 to study the supernova remnant (Hwang et al., 2004). Several medium-length (50 ks) observations have been taken at various times between 2000 to 2009. A 70-kilosecond observation in 2006 was designed to study the compact source (Pavlov & Luna, 2009), using a subarray configuration to reduce instrument pileup (Davis, 2001). As discussed in Heinke & Ho (2010), most of the 2004 dataset is subtly contaminated by the presence of bad pixels affecting the flux from CANS. Although Chandra response functions include the effect of the bad pixels, the calibration becomes rather different, inducing small (%) variations in the computed temperature, depending on telescope orientation (as the position of the CANS with respect to the bad pixels varies). We choose to include all data and permit variations in the fitted temperatures, while forcing all other parameters to be the same between different observations (except the pileup grade-migration parameter , permitted to vary with different frame times). We justify including all data by the much stronger constraints we obtain on neutron star mass and radius when we include all the data, and by the fact that the temperature variations between observations are small (thus any effects on, e.g., the inferred neutron star mass and radius, will be %). CIAO 4.1 and XSPEC 12.4.0 are used for the data reduction and analysis.
We note that using seven Chandra ACIS observations from the past ten years, Heinke & Ho (2010) showed that the temperature of the CANS has been declining. However, the relative change is only during the period of observation. Since we are considering the CANS in the context of its long-term temperature evolution in the present work, we treat the observed temperature as a constant at the current epoch.
To fit the spectrum of the CANS, we used neutron star atmosphere models with various compositions (Ho & Heinke, 2009). These models are constructed assuming a plane-parallel atmosphere (since the atmosphere thickness cm is much smaller than the stellar radius). The atmosphere is in hydrostatic and radiative equilibrium at constant surface gravitational acceleration , where
| (1) |
is the stellar compactness parameter, i.e., the ratio of its Schwarzschild radius, , to . The efficient separation of light and heavy elements results in atmospheres composed of a single element (Alcock & Illarionov, 1980; Brown et al., 2002); the opacities are obtained from tables computed by the Opacity Project111http://cdsweb.u-strasbg.fr/topbase/op.html. Further details of the atmosphere model construction are given in Ho & Lai (2001); Ho & Heinke (2009). Only a non-magnetic carbon atmosphere provides both a good fit to the spectrum of the CANS and an emission size consistent with theoretical predictions for neutron star radii (Ho & Heinke, 2009). In addition, Chang & Bildsten (2004) and Chang et al. (2010) find that the high temperatures present in young ( y) neutron stars remove all surface hydrogen and helium on timescales shorter than the age of the neutron star. The (minimum) column depth and total mass of carbon required to form an optically thick photosphere is and g, respectively, and the density at one optical depth is . Thus we only consider hereafter the carbon atmosphere model.
Fits of the CANS spectrum by a neutron star atmosphere model depend on several parameters (in addition to corrections from pile-up and dust scattering). They are neutron star radius and mass , effective surface temperature , and effective column density of interstellar hydrogen . In our spectral fits we have fixed the distance to kpc (Reed et al., 1995). The smallest uncertainty is in (to within around cm-2). The measured flux implies a bolometric (1 eV10 keV) luminosity of erg s-1 at 90% confidence, assuming a distance between 3.33.7 kpc.
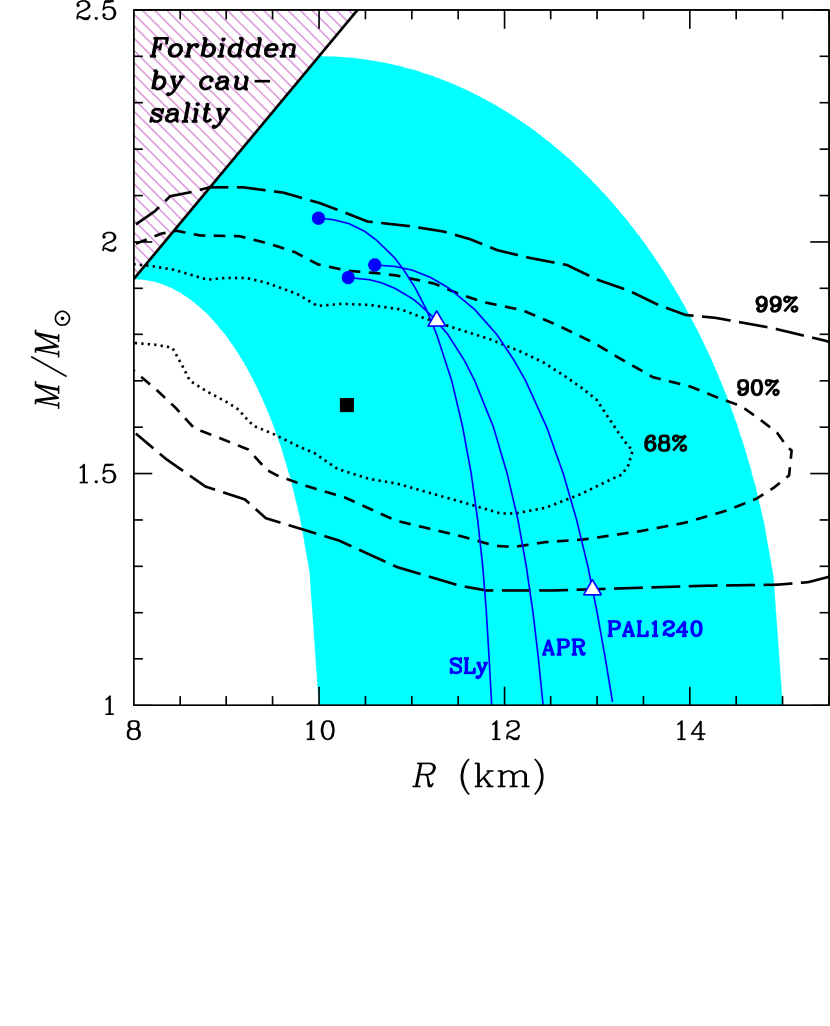
Spectral fits give us allowed regions in , and parameter space at different confidence levels. These results are shown in Figs. 1 and 2. The best-fit values are , and km (shown by filled squares). Fig. 1 presents 68% (dotted lines), 90% (short-dashed lines) and 99% (long-dashed lines) contours on the mass-radius diagram for neutron stars. The shaded upper-left corner is forbidden by the causality principle. The diagram and causality constraints are discussed, e.g., in Haensel, Potekhin & Yakovlev (2007). The uncertainties are seen to be wide.
To compare with theory, the solid lines in Fig. 1 give theoretical relations for neutron stars which contain nucleon cores with three different EOSs: SLy EOS by Douchin & Haensel (2001); APR EOS by Akmal et al. (1998); a version PAL1240 of the PAL EOS by Prakash et al. (1988). By APR we mean the parametrization of APR results suggested by Heiselberg & Hjorth-Jensen (1999); specifically, we use version APR I proposed by Gusakov et al. (2005). The PAL1240 is a version of the PAL EOS with the compression modulus of saturated nuclear matter MeV and model 1 for symmetry energy (Prakash et al., 1988). Filled dots on the solid lines indicate maximum-mass neutron star configurations (). Triangles correspond to the mass thresholds where the powerful direct Urca process of neutrino emission becomes allowed (more massive stars cool rapidly if the direct Urca process in their cores is not suppressed by superfluidity; see Sec. 4.2). For the SLy EOS we have , and rapid cooling is forbidden at any . For the APR EOS, and , while for the PAL1240 EOS, and . The central shaded region in Fig. 1 shows the range of and that can be obtained for other EOSs which we consider as realistic. We see that the CANS limits on and , inferred from observations, are wider than the range of theoretical predictions.
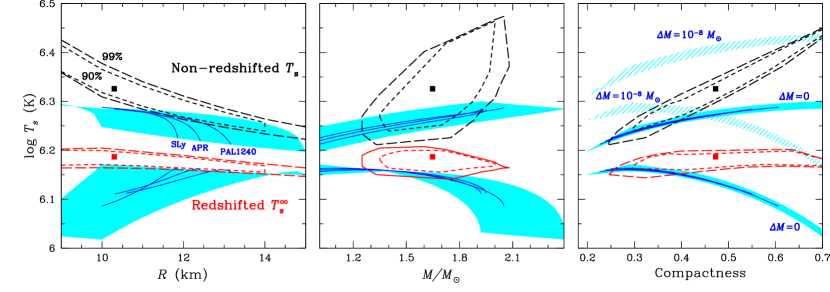
In Fig. 2 we present contours of inferred from the CANS observations as a function of (left), (middle) and (right). These contours are given by the upper curves. They are projections of the appropriate regions (at 90% and 99% confidence levels)222Note that contours in Fig. 1 refer to two-dimensional () confidence levels, while contours in Figs. 2–4 are for somewhat different three-dimensional () confidence levels. However, this difference does not affect our principal conclusions. on the corresponding axis, , or . Having regions, we also show the associated regions, where is the (redshifted) surface temperature as measured by distant observer. The lower curves in Fig. 2 are the corresponding contours of . Other curves are explained and discussed in Section 4.3.
3 Three cooling stages
Generally, neutron stars cool via neutrino emission from their interiors (mainly from the core) and via heat conduction to the surface and successive thermal surface emission. Cooling theory solves the heat conduction problem within the star in General Relativity (Thorne, 1977), accounting for internal neutrino energy losses and surface emission of photons. One can distinguish three main cooling stages. During the first stage (which lasts from yr to a few centuries depending on the specific model), a newly born neutron star is thermally non-relaxed, with the core being cooler than the crust because of stronger neutrino emission in the core (see Nomoto & Tsuruta, 1981, 1987; Lattimer et al., 1994; Gnedin et al., 2001; Shternin & Yakovlev, 2008, for details). The core is thermally decoupled from the crust; the surface temperature reflects the physics of the crust. During the second cooling stage (which lasts for yr), the star is thermally relaxed inside; it cools mainly via neutrino emission. The main temperature gradient is located in a thin layer near the surface (in the so called heat-blanketing envelope, at densities g cm-3, Gudmundsson et al. 1983). During the third (final) stage, the thermally relaxed star cools via the surface emission of thermal photons. During each cooling stage, the thermal radiation of neutron stars carries different information on the stellar structure. Isolated neutron stars, whose thermal surface radiation has been detected, are mostly at the (second) neutrino cooling stage (with isothermal interior). The CANS is the youngest of these neutron stars and is thus of special interest. We study the thermal state of this neutron star using our general relativistic cooling code (Gnedin et al., 2001) and useful semi-analytic expressions described below.
4 Neutrino cooling of thermally relaxed stars
4.1 Basic relations
A thermally relaxed star has an isothermal interior which extends from the center to the heat blanketing envelope (i.e., at ). Taking into account the effects of General Relativity (e.g., Thorne 1977), isothermality means spatially constant redshifted internal temperature , where is the local internal temperature, is radial coordinate and is the metric function that determines gravitational redshift. The cooling equations in such a star are much simpler than the general equations of heat transport. They reduce to the equation of global thermal balance (Glen & Sutherland, 1980),
| (2) |
where and are, respectively, the neutrino luminosity and the photon thermal luminosity of the star (redshifted to a distant observer), while is the stellar heat capacity. These quantities are given by
| (3) | |||||
| (4) | |||||
| (5) |
where is the neutrino emissivity, is the specific heat capacity, is the Stefan-Boltzmann constant, and is the element of proper volume determined by the appropriate metric function .
The hydrostatic stellar structure [, , etc.] is calculated by solving the Tolman-Oppenheimer-Volkoff equation (e.g., Shapiro & Teukolsky 1983). Then the cooling problem can be easily solved by integrating (2); the solution gives and . To this aim, one needs to calculate the two functions, and [by integrating over the stellar volume in (3) and (5)]. In addition, one needs to relate to the temperature at the bottom of the heat blanketing envelope () by solving separately the stationary one-dimensional heat conduction problem within this envelope (e.g., Gudmundsson et al. 1983; Potekhin et al. 1997, 2003). Approximately, (Gudmundsson et al., 1983). Since the envelope is thin, one can set within it, so that . Eq. (2) is solved with some initial condition, . However, for realistic values K, the dependence at yr is insensitive to (the initial condition is forgotten at such ).
Thus the cooling of thermally relaxed neutron stars is governed by the functions , and , which are the only three functions that can be tested by comparing neutron star cooling theory with observations. This cooling theory is fairly insensitive to the microphysics of the stellar crust (at ) and to the thermal conductivity in the isothermal interior. The functions and are sensitive to the (uncertain) microphysics in the neutron star core, while the -relation is based on the (better-known) plasma physics in the outer neutron star envelope.
Our cooling model implies that the isothermal stellar interior () is spherically symmetric. The structure of the heat blanketing envelope () can deviate from spherical symmetry under the effects of strong magnetic fields. If the latter effects are substantial, varies over the neutron star surface, which is taken into account in our envelope models (Potekhin et al., 2003, 2007). However, we have checked that the magnetic field G, which can be present in the surface layers of the CANS, does not affect , averaged over the surface. Thus, we set , so that the envelope models are determined only by the surface gravity and by the mass of light (accreted) elements. This assumption is supported by the non-detection thus far of pulsations from the CANS (Murray et al., 2002; Mereghetti et al., 2002; Ransom, 2002; Pavlov & Luna, 2009; Halpern & Gotthelf, 2010).
Our basic model will be the standard iron heat blanketing envelope. The presence of a small amount of carbon () in the CANS atmosphere does not affect the cooling properties of the star. We also consider models with more substantial light-element envelopes. Light elements increase the thermal conductivity and make the envelope more heat transparent (increase for the same ). Since we assume a carbon atmosphere, the envelope can contain carbon or heavier elements (hydrogen or helium, if present, would flow up to the surface). To this aim, we have constructed new (carbon-iron) models with different carbon mass , and iron under the carbon layer. The thickest carbon layer, with , can extend to the density of a few times of g cm-3; at higher densities carbon is destroyed by beta captures and pycnonuclear reactions.
4.2 Neutrino cooling rate
The cooling problem is further simplified during the neutrino cooling stage. In this case can be neglected in (2), so that
| (6) |
The internal temperature is controlled by the physics of the stellar interior (mainly, the core), being insensitive to the structure of the heat blanketing envelope. The cooling is governed by the one function , which specifies the cooling rate – the ratio of the neutrino luminosity to the heat capacity [K yr-1] – that is mainly determined by the properties of superdense core. It is only that can (in principle) be extracted from measured values of . However, the extraction is not straightforward. Two stars with the same mass and internal structure have the same (look the same from inside). However, if their heat blanketing envelopes are different, they have different surface temperatures (look different from outside).
We discuss the extraction, neglecting the effects of very fast rotation, superstrong internal magnetic field and possible deviations from beta-equilibrium. Then there is a single unique cooling function for the real EOS and microphysics of neutron star cores. This unknown function depends only on and (or some other quantity, or , instead of ). Theoretical models give different functions , for different compositions, EOSs, and superfluid properties of the core. Of the two ingredients of [ and ], the neutrino luminosity is much more sensitive to the microphysics of superdense matter, than the heat capacity . Therefore, mostly reflects the neutrino luminosity of neutron star cores. The standard neutrino emission mechanism is the modified Urca process (e.g., Pethick 1992; Yakovlev et al. 2001; Page et al. 2006, 2009) in non-superfluid cores. It gives erg s-1 (where ). We consider this as a neutrino standard candle (standard slow neutrino emission). The heat capacity of such cores is mainly determined by neutrons, erg K-1. The cooling rate of the standard candle (SC) can be estimated as
| (7) |
We discuss in more detail in Section 4.3.
The actual (unknown) cooling rate can strongly differ from the standard one, either enhanced or reduced. In this respect it is useful to introduce the ratio
| (8) |
which expresses the actual rate in units of standard candles (of the same and ). It measures the neutrino cooling efficiency, the very important property of superdense matter to be extracted from observations of cooling neutron stars. The parameter should be taken at a temperature of the cooling star. If and have the same temperature dependence, then is just a number, independent of ; otherwise it depends on , as discussed next.
The enhancement of over can occur if more efficient neutrino emission mechanisms are allowed in the inner cores of massive neutron stars. These fast mechanisms lead to neutrino luminosity . The strongest enhancement over (with at K) can be provided by the direct Urca processes in nucleon or nucleon/hyperon matter (Lattimer et al. 1991; Prakash et al. 1992). They open at densities higher than some threshold density . Thus the neutrino luminosity in non-superfluid low-mass neutron stars (where the direct Urca process is forbidden) is our neutrino standard candle, while at larger it is much higher, leading to fast neutrino cooling. The density threshold and the associated neutron-star mass threshold for fast neutrino cooling are very model dependent (see Sec. 2 and Fig. 1).
Even if direct Urca processes are forbidden in the inner neutron star core, the neutrino luminosity can still be enhanced over and can scale as . This happens provided the inner core has an exotic composition (contains pion condensates, kaon condensates or free quarks) owing to specific direct Urca-like processes in exotic matter. The neutrino luminosity depends on this composition (e.g., Pethick 1992; Yakovlev et al. 2001; Page et al. 2006, 2009) but is smaller than , leading to a smaller enhancement factor . In pion condensed matter one gets , while in kaon-condensed or quark matter . Calculations of neutrino emissivities and for these cases are very model dependent.
The situation is even more complicated in the presence of superfluidity of baryons (Cooper pairing due to attractive component of the baryon-baryon interaction) in neutron star cores. In the simplest case of nucleon matter, one deals with superfluidity of neutrons and protons. Hyperons and/or quarks (if available) can also be in a superfluid state. Pion or kaon condensates affect superfluidity of baryons. Each superfluidity is characterized by its own critical temperature that depends on . Calculations of are model dependent (e.g., Lombardo & Schulze 2001); various models give a large scatter of values ( K or higher). In central regions of massive stars, superfluidity disappears [] because short-range nucleon-nucleon repulsion destroys Cooper pairing.
Baryon superfluidity can greatly modify neutrino emission, and hence affect and (see, e.g., Yakovlev et al. 2001; Page et al. 2006, 2009). First, strong superfluidity () exponentially suppresses the traditional neutrino reactions, which involve superfluid particles, and reduces because the gap in the energy spectra of superfluid particles blocks the reactions. Second, superfluidity initiates a different neutrino emission process due to Cooper pairing of baryons, which increases .
Let us illustrate these statements by taking neutron stars with nucleon cores as an example. Consider a low-mass star, which would cool via the modified Urca process in a non-superfluid case. Strong (for instance, proton) superfluidity in the core suppresses the modified Urca process and reduces . If neutrons were non-superfluid, the main neutrino emission would be provided by neutrino pair production in neutron-neutron collisions (neutron-neutron bremsstrahlung); would be proportional to (as for the modified Urca process) but would be weaker than ; the star would cool slower than its non-superfluid counterpart, leading to . Now assume a mild triplet-state neutron superfluid in the core, with maximum of a few times of K. When the temperature in the core drops below this maximum, Cooper pairing of neutrons can initiate a sufficiently strong neutrino emission, with . Such a star would be a faster neutrino cooler than the standard candle (with maximum ). On the other hand, this extra neutrino emission is negligible if the direct Urca process is open (even slightly) in the core.
The effect of superfluidity in a massive star can be dramatic. The direct Urca process can be formally allowed in its core but suppressed by superfluidity. In this case, superfluidity transforms the fast neutrino cooling into a slow one and effectively increases . It can greatly smooth out the transition from slow to fast cooling with increasing . However, very massive stars would cool rapidly (if fast cooling is allowed by the EOS) because superfluidity disappears in their central regions (see above).
Recall that depends also on the heat capacity . In a non-superfluid star with a nucleon core, is mainly determined by neutrons (see above). The proton contribution is 1/4 of the neutron one, and the contribution of electrons and muons is 1/20 (Page, 1993). Strong neutron superfluidity suppresses the neutron contribution, and strong proton superfluidity suppresses the proton contribution, but the electron and muon heat capacities always survive.
All in all, current theories predict different cooling rates which depend on many uncertain properties of superdense matter. The temperature dependence is mainly expected to be a power-law,
| (9) |
with for fast neutrino cooling and for slow cooling; determines the cooling efficiency. From (9) and (6) at the neutrino cooling stage (after the initial conditions are forgotten), one obtains the cooling relation
| (10) |
with
| (11) |
Such solutions have been presented in previous works many times (see, e.g., Pethick 1992). If one knows , and , then (11) immediately gives the cooling rate . For a fixed the rate is directly proportional to . Eq. (10) greatly simplifies the solution of the cooling problem for a thermally relaxed star at the neutrino cooling stage. Note the weak dependence of on and on the cooling efficiency , which stems from the strong temperature dependence of the cooling rate.
It is instructive to introduce the parameter
| (12) |
where and refer to a given star, while and refer to the standard candle of the same age, and . measures the ratio of internal temperatures of the star and the candle, as well as the ratio of their cooling rates taken at their own internal temperatures. Because of the strong -dependence of the cooling rate [see eq. (9)], the parameter [] is drastically different from the ratio [; see eq. (8)]. According to eqs. (9) and (10), the cooling efficiency [calculated at a given stellar temperature ] is related to by
| (13) |
For instance, if the star has and is twice as hot as the corresponding standard candle should be (), its cooling efficiency is much lower than that of the candle (). We will show in Section 4.4 that can be easily constrained from observations. However, it is that determines the efficiency of neutrino emission and is the quantity of primary importance.
We will also show that observations of the CANS are consistent with . In this case it is reasonable to choose (as we will do throughout the paper); and are then independent of and . If in actuality , while we have chosen , then eq. (13) underestimates by a factor of 1.5.
4.3 Standard candles
We simulate cooling of many standard candles, taking 17 nucleonic EOSs that describe the neutron star core. The EOSs include all 9 original versions of the phenomenological PAL EOS (Prakash et al., 1988), as well as 3 other versions of this EOS with the symmetry energy of nuclear matter proposed by Page & Applegate (1992); the APR EOS (Akmal et al., 1998); the SLy EOS (Douchin & Haensel, 2001); and three new modifications (i–iii) of the PAL EOS. These modifications correspond to (i) MeV and model 2 for the symmetry energy from Prakash et al. (1988); (ii) MeV and model 3; and (iii) MeV and model 3; the parameter in Prakash et al. (1988) was taken to be zero in all three cases. These three EOSs are definitely superstiff and unrealistic. In particular, they predict the existence of very massive stars (with maximum masses up to ). We include them to check that the scaling relations presented below can be extrapolated to supermassive neutron stars. For any chosen EOS, we consider neutron star models of different , from to the maximum mass, with a step size of 0.1 or smaller. For those models where the direct Urca process is allowed, we switch the process off to ensure that we consider only standard candles. In this way, we take about 170 neutron star models which cover a large area of the mass-radius diagram, with from about 9 to 15 km. We simulate cooling of all our models and determine and . In the simulations, we assume non-magnetic iron heat blanketing envelopes. However, the values of are almost insensitive to the composition of the envelopes (which determine ) at the neutrino cooling stage (see Section 4.1).
We find that the internal temperature of all thermally relaxed neutron stars (standard candles) at the neutrino cooling stage can be approximated by
| (14) |
where the compactness is given by (1) and is some fiducial (normalization) timescale. The latter is set equal to the age of the Cas A supernova remnant ( yr) that is convenient for our purpose. The time dependence of in (14) is taken in accordance with eq. (10). Calculations show that this time dependence is, indeed, accurate at the neutrino cooling stage (see Section 5). It first establishes in the core which thermally equilibrates faster than the inner crust. After the global internal thermal relaxation is over, it becomes accurate in the entire star (except for the heat blanketing envelope). The numerical factors 3.45 and 0.12 in (14) are obtained by fitting the calculated values . The accuracy of the fit is sufficiently good. The root mean square relative fit error is (which translates into the 1.5% error of because ); the maximum error over all models is for an unrealistic (supermassive) model with ; the maximum error over 160 models with is (for the 1.9 model with the SLy EOS).
Note, that our cooling curves contain systematic uncertainties which come from uncertainties in the calculations of the neutrino luminosity and heat capacity of the core. The main uncertainties are those in the effective masses of neutrons and protons, and , and in the squared matrix element of the modified Urca process in the core. These quantities should be calculated self-consistently for a specific EOS (using specific many-body theory) as a function of density , but such calculations (which would be most desired!) are currently unavailable. Instead, we set somewhat arbitrarily ( being the free neutron mass), and we use the standard approximate expression for from Yakovlev et al. (2001). To estimate the above uncertainties, let us introduce a typical nucleon effective mass in dense matter and note that and . Then from eq. (10) we conclude that . For instance, allowing a 20% uncertainty in and 30% (uncorrelated) uncertainty in , we obtain % uncertainty in and 7% in . We will not take these uncertainties into account in our further analysis (which is a common practice in the neutron star cooling theory) but warn about them. Taking the same nucleon effective mass for neutrons and protons would be inaccurate in advanced simulations but is sufficient for estimating the uncertainties of .
Eq. (14) gives a very simple method to calculate the standard slow cooling of thermally relaxed neutron star of any reasonable mass and radius during the neutrino stage. It does not require detailed knowledge of the internal stellar structure and microphysics of superdense matter. Because is independent of the properties of the heat blanketing envelope at the neutrino cooling stage, eq. (14) is not biased by these properties but allows one to take them into account while calculating . One can easily determine for given values of , and , and find at the bottom of the heat blanketing envelope. Then it is a simple task to calculate using the relation.
For example, the shaded regions in Fig. 2 represent the effective surface temperatures ( and ) of standard candles of age yr. Their masses and radii are taken from the (realistic EOS) shaded region in Fig. 1. All of them assume an iron heat blanketing envelope; the exception is for the two lightly-shaded regions in the right panel – these are for heat blanketing envelopes containing of carbon. Note a striking feature of theoretical standard candle curves – they are described by a well-defined (nearly universal) function of compactness , but not of and . This is a remarkable manifestation of General Relativity. The presence of the maximum amount of carbon in the heat blanketing envelope does not violate the existence of a well-defined dependence of and on , but raises the effective temperatures by for standard candles of the CANS age.
At the redshifted surface temperature of all standard candles with iron blanketing envelopes is nearly the same, MK. With increasing , the redshifted temperature decreases, down to MK for standard candles with the maximum compactness ; in contrast, the non-redshifted temperature increases. Thus compact standard candles would appear colder for a distant observer but would be hotter for a local observer. The differing behavior of and is another manifestation of General Relativity. The weak sensitivity of to variations of and for standard candles was first noted by Page & Applegate (1992) and later discussed in the literature (e.g., Yakovlev & Pethick 2004, and references therein); here we quantify this effect.
The three solid lines in Fig. 2 show and for standard candles using the SLy, APR and PAL1240 EOSs (their relations are displayed in Fig. 1). We plot these curves using eq. (14) and assuming iron heat blanketing envelopes. These curves are similar to each other, not only as a function of , but also as a function of (because the three EOSs are alike).
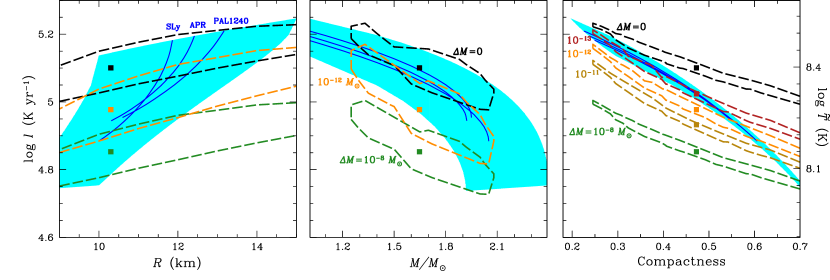
Theoretical cooling rates [eq. (9), along with eq. (14)] for standard candles of the CANS age are shown by the shaded regions in Fig. 3. The three panels give these rates versus , and . The masses and radii of neutron stars are again taken from the shaded region in Fig. 1 and the solid lines are again the theoretical rates for standard candles with the SLy, APR and PAL1240 EOSs. All these rates are independent of the properties of the blanketing envelopes. We see again that there is a well-defined relation between the cooling rate and compactness .
Since unambiguously determines (for ), the right vertical scale in Fig. 3 can be used to calibrate the internal neutron star temperature . The expected values of are a few K. The non-redshifted local internal temperature is somewhat higher. The relation between and is similar to that between and in Fig. 2. The difference between and in the neutron star core is larger than in the crust because of stronger gravitational redshifts in the core. The core is hotter ( is higher) than the crust for a given isothermal interior (given ).
4.4 Determining the cooling rate
We now propose a simple and robust method to determine the cooling rate in a thermally relaxed star at the neutrino cooling stage. Assuming some values of and , a model for the heat blanketing envelope, and taking a measured (constrained) value (or ), we can find (constrain) . With a given (or assumed) age , the cooling rate can then be determined (estimated) from (11) (with as discussed above).
The application of this method to the CANS is presented in Fig. 3, which shows values of (left vertical scale) and (right vertical scale) of the CANS versus , and . These values are inferred from spectral fits of the CANS at the 99% confidence level (Fig. 2). The accuracy of inferring is limited by the accuracy of our models for heat blanketing envelopes; the accuracy of inferring is also affected by the assumption that . The upper (dashed) lines of and are obtained using the neutron star models with iron heat blankets. Lower lines are for models with carbon shells of different mass . We again see that the values of and are well-defined functions of (for a given ). The inferred values of and of the CANS for realistic values of , , and vary within the factor . The advantage of Fig. 3 is that it gives absolute values of the cooling rate , an important parameter of the CANS.
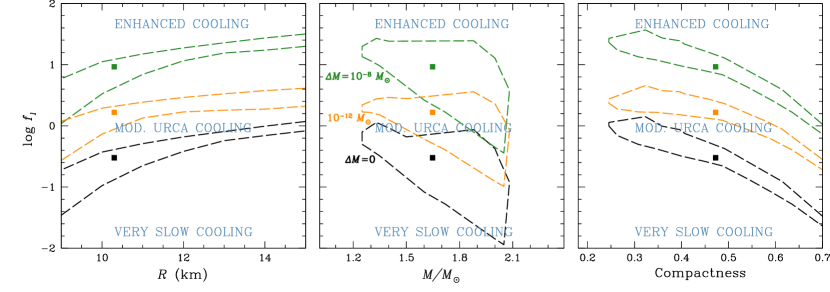
We now take the inferred values of , use eq. (8) and calculate the cooling efficiency , which is another important parameter of the CANS cooling. As discussed in Section 4.2, relatively small variations of yield much larger variations of . This is demonstrated in Fig. 4, which plots as a function of , and . Lower, middle and upper lines refer to the blanketing envelopes with and , respectively. The figure directly compares the CANS neutrino cooling rate to that of the standard candle.
Figures 2–4 impose constraints on the CANS cooling rate. Recall that we can specify the rate by the single parameter (provided we fix ). Our results suggest that (as well as , , ) is a nearly universal function of and . If the CANS has low compactness and possesses either an iron blanketing envelope () or an envelope with a very low mass carbon shell (), we find (i.e., standard candle cooling). For larger but the same heat blanket, we obtain lower (very slow cooling). For the maximum compactness , we find . If the CANS has a massive carbon heat blanket, then a higher cooling efficiency is required. With the most massive carbon shell at , the CANS cools faster than the standard candle, with . However, decreases with increasing and reaches the standard level at . Note the opposite -dependence of the cooling rate (Fig. 3) and cooling efficiency (Fig. 4). The star with smaller cools slower and has higher temperature (and hence higher ) than the standard candle of the same age [see eq. (13)].
We thus set robust restrictions on the cooling efficiency of the CANS as a thermally relaxed cooling neutron star. Unfortunately, the values of do not specify unambiguously the neutrino emission mechanisms within the star (Section 4.2) and can be realized by different physical models for the interior of CANS. For instance, is consistent with the modified Urca process in a non-superfluid neutron star core. It is equally consistent with enhanced neutrino emission that is partially suppressed by superfluidity. Thus there is ambiguity in the theoretical interpretation. We can explain the CANS data assuming different and , while the values of , inferred at fixed and , can be consistent with many models of CANS interiors.
5 CANS among other cooling stars
Figure 5 plots the CANS limits on the plane, as well as the data on other cooling isolated neutron stars, The CANS limits are those obtained from 99% confidence contours (Fig. 2). Observational data on other sources are taken from references cited in Yakovlev et al. (2008); Kaminker et al. (2009). The CANS is the youngest in the family of cooling neutron stars whose surface temperatures are measured (constrained) more or less reliably.
The thick solid line in Fig. 5 demonstrates the cooling of a standard candle. For this case, we take a neutron star with , km (), the APR EOS in the core and a heat-blanketing envelope composed of iron. The initial part of the cooling curve is almost flat, which indicates that the stellar interior is not thermally relaxed (Lattimer et al., 1994; Gnedin et al., 2001). The rapid drop of the surface temperature signals the end of thermal relaxation. By the current age of the CANS ( yr), the star has an isothermal interior, and the results of Section 4 apply. The curve is reasonably consistent with the CANS observations, in agreement with the results of Section 4.4.
The thick long-dashed cooling curve is calculated using the approximate cooling relation given by eq. (14). It is valid during the neutrino cooling stage in a thermally relaxed star. It accurately describes the cooling at yr (when the thermal relaxation is over) until yr (while photon cooling is still unimportant). The densely-shaded region around this cooling curve is also calculated from eq. (14). We only show it in the limited range of because eq. (14) is inapplicable for very young and very old stars. This region is covered by cooling curves of standard candles (with iron envelopes); masses and radii are taken from that part of the central shaded region in Fig. 1 where . These cooling curves nearly coincide and are almost consistent with the CANS data (in agreement with the results of Section 4.4; see Figs. 2 and 3). The lower lightly-shaded region in Fig. 5 is covered by similar cooling curves of more compact standard candles () from the shaded region in Fig. 1. With increasing compactness, standard candles have lower and cannot explain the CANS data. Neutrino emission would need to be reduced to be consistent with the observations. A reduction of the cooling rate to is required for the maximum compactness .
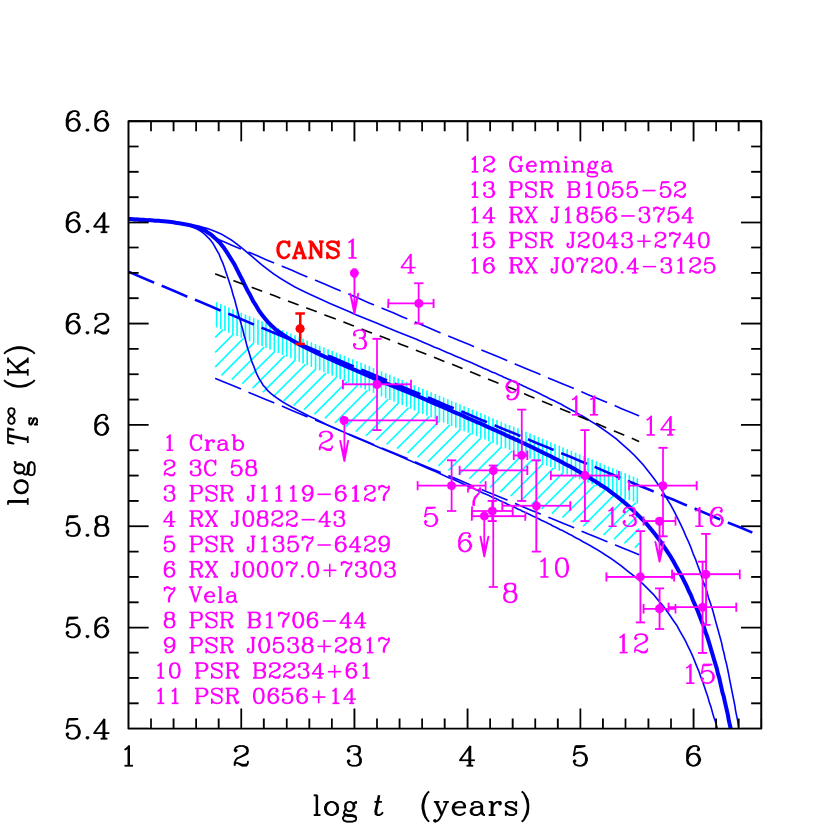
The thin solid lines in Fig. 5 are again the cooling curves of the 1.4 APR star (with the iron heat blanketing envelope). However, in this case the efficiency of neutrino emission is artificially enhanced (the lower curve) or suppressed (the upper curve) by a factor of 30 (i.e., or 1/30, respectively). The thin dashed lines are analytic approximations of these curves; they are calculated from eq. (14), in which we introduce the factor in accordance with eq. (10) to renormalize the efficiency of neutrino emission. There is a good agreement between the lower thin solid and dashed curves (when the star is thermally relaxed and cools via the neutrino emission). Also note that the 1.4 APR star with cools almost as a very compact () standard candle (). On the other hand, we obtain a slight disagreement between the upper solid and long-dashed curves (for our basic APR star with strongly reduced neutrino emission, ). This is because the cooling of neutron stars with very low neutrino emission from the core can be affected by neutrino emission from the crust. When we artificially reduce the emission from the crust, the upper thin solid curve shifts to the upper thin long-dashed curve (the shifted curve is not shown in Fig. 5). We have checked that this effect becomes noticeable only in neutron stars with very low neutrino cooling rate (). Similar effects were discussed by Kaminker et al. (2001) who studied very slowly cooling neutron stars with the neutrino emission in the core greatly suppressed by strong nucleon superfluidity. Thus our analytic approximation becomes inaccurate for . One should also be careful in applying this approximation to the case of because it is reasonable to expect that the cooling rate index can change from to (see Section 4.2).
Finally, the thin short-dashed line in Fig. 5 is the analytic cooling curve of the APR standard candle with a (maximal ) carbon heat blanketing envelope. Recall that during the neutrino cooling stage such a star has the same internal temperature as a star with an iron envelope; nevertheless, it has a hotter surface because the carbon envelope is more heat transparent. The thin short-dashed curve is close to the upper solid and long-dashed curves meaning that the surface temperature of a standard candle with the carbon envelope is nearly the same as that of a star with lower cooling rate () and iron envelope. If the CANS has a carbon envelope and is not too compact (), then its neutrino cooling rate should be over that of the standard candle by a factor of 30–50 (in agreement with the results of Section 4.4). As the compactness increases, the surface temperature of the standard candle with a carbon envelope will tend to the CANS range; for the highest compactness and a carbon envelope, CANS would cool as a standard candle.
An analysis of current theories of isolated neutron stars is given, e.g., by Yakovlev & Pethick (2004); Page et al. (2006); Yakovlev et al. (2008); Page et al. (2009). We note that the surface temperatures of nearly all stars lie between the upper and lower thin curves in Fig. 5 (the observed isolated stars do not require extremely slow or fast neutrino cooling). Our results indicate that the coldest of them (like the Vela pulsar), which have usually been treated as rapid neutrino coolers, can in fact be very compact standard candles. Note that the surface temperatures of many isolated neutron stars (especially the colder ones) can also depend on strong magnetic fields, which affects heat transport in the blanketing envelopes (see Potekhin et al., 2003, 2007).
6 Is CANS relaxed?
As shown in Section 4, observations of the CANS are consistent with the assumption that the star is thermally relaxed and cools relatively slowly (with a cooling efficiency ). In this section, we examine the possibility that the CANS is cooling much faster but its surface is not too cold because it is not yet thermally relaxed. We stress that cooling theories with the standard microphysics of neutron stars give relaxation times shorter than 300 yr (e.g., Lattimer et al. 1994; Gnedin et al. 2001). This means that the possibility considered here requires non-standard cooling scenarios which delay relaxation.
In a young neutron star, the crust is hotter than the core because of lower neutrino emission in the crust. Relaxation implies thermal equilibration of the crust with the core that is mainly regulated by the physics of the crust (Lattimer et al., 1994; Gnedin et al., 2001; Shternin & Yakovlev, 2008). It can be delayed by lowering the thermal conductivity and neutrino luminosity in the crust and by considering neutron star models with a thicker crust (which increases the thermal diffusion timescale in the crust).
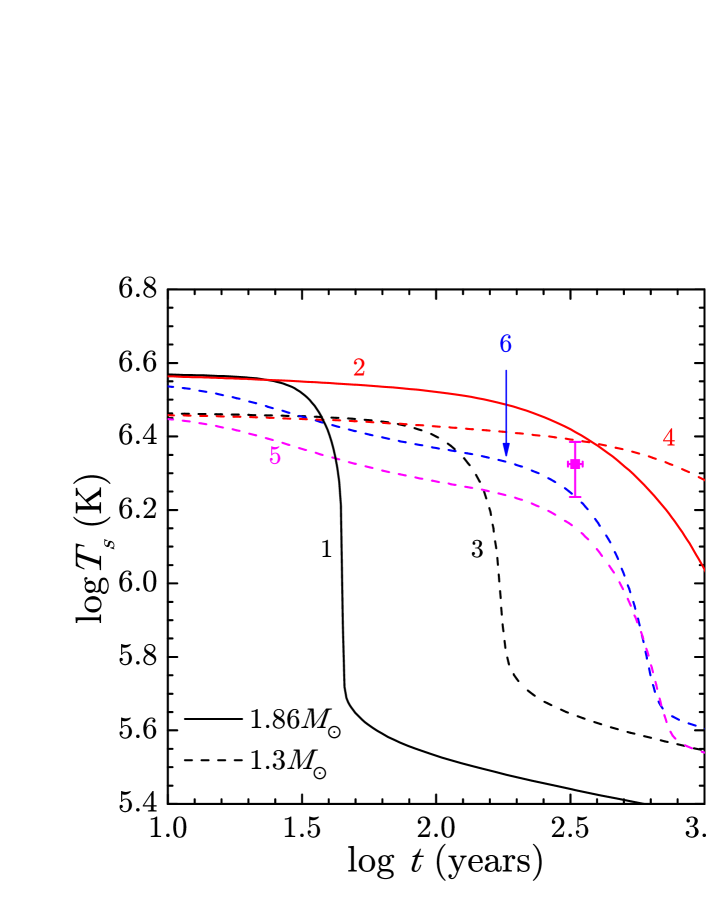
Figure 6 gives a number of cooling curves which are calculated for two neutron star models based on the PAL1240 EOS. We assume that the neutron stars have non-superfluid cores (since we focus on delaying relaxation by tuning the physics of the crust). The first model has and km. Recall that the direct Urca process is allowed for this EOS at . Here we do not switch this process off (as in the calculations presented in Section 4). As a result, the neutrino cooling rate is much higher [with ; see eq. (8)] than for standard candles. The second neutron star model has and km. Its mass again exceeds , and the neutrino cooling rate is huge. This star has a thicker crust than the star, and its relaxation time can be longer. The displayed CANS errorbars are estimates from Fig. 2.
Curve 1 in Fig. 6 shows the cooling of the star with the standard physics of the core and crust. The end of the thermal relaxation manifests itself in the drop of at yr. By the current age of CANS, the star is thermally relaxed; it is much colder than the CANS (in agreement with the results of Section 4). The largest delay of relaxation can be achieved by lowering the thermal conductivity in the crust. We demonstrate this by using a model thermal conductivity proposed by Brown (2000) (curve 2 in Fig. 6). This model corresponds to an amorphous crust and can be regarded as the lowest limit on the crustal conductivity. The relaxation time is now longer than the CANS age. By taking the thermal conductivity to be lower than the normal one but above the lower limit, we can match any point in the region between curves 1 and 2 and thus explain the CANS data. However, the hypothesis of low conductivity contradicts observations of thermal relaxation in quasi-persistent X-ray transients (see Shternin et al., 2007; Brown & Cumming, 2009, and references therein).
Curve 3 shows the cooling of the neutron star (with a thicker crust) assuming standard physics in the crust. The relaxation time is longer than for the star (curve 1), but the delay is insufficient to explain the CANS observations. Curve 4 demonstrates the cooling of the same star but with the lowest crustal thermal conductivity (Brown, 2000), corresponding to curve 2. In this case, relaxation is rather slow. Again by taking intermediate values of thermal conductivity, we can fit any point between curves 3 and 4.
Relaxation can be accelerated if the neutron heat capacity in the inner crust is suppressed by neutron superfluidity. This effect is illustrated by curve 5, which is calculated using the lowest thermal conductivity but assuming moderate neutron superfluidity in the crust (c.f., curve 4). The relaxation time drops to 700 yr, about twice the age of CANS. Finally, curve 6 is the same as 5 but for the star with the carbon heat blanketing envelope (). This star is the same inside but looks hotter from the outside and has the same relaxation time.
Thus the observations of the CANS can be compatible with a neutron star that undergoes fast cooling (via the direct Urca process) but is still not thermally relaxed. However, this can only be done by employing a very low thermal conductivity throughout the neutron star crust, which seems unrealistic.
7 Conclusions
We have used the cooling theory of isolated neutron stars and suggested a robust method (Section 4.4) to infer the neutrino cooling rate [defined by eq. (6)] of stars from observations of their thermal radiation at the neutrino cooling stage (ages yr) after the end of their internal thermal relaxation. We simulated cooling of many models (wide ranges of EOSs, masses and radii) of standard candles (neutron stars with non-superfluid nucleon cores which cool via the modified Urca process) and formulated simple relations (Section 4.3) which determine the cooling rates and cooling dynamics during the neutrino cooling stage. We have shown that ultra-compact standard candles with compactness have noticeably lower redshifted surface temperatures than their less compact counterparts (). Based on these results, we developed a method to compare the inferred cooling rates to the rates of standard candles and to determine the neutrino cooling efficiency [given by eq. (8)] of observed neutron stars. We have shown (Section 4) that many physical properties, which characterize the thermal state of a cooling neutron star (such as the surface and internal temperatures, cooling rate), are well-defined functions of the stellar compactness , rather than the stellar mass or radius . Self-similarity properties in the cooling of standard candles [eq. (14)], their universal dependence on the compactness , and the relatively low of ultra-compact standard candles have been previously overlooked in the cooling theory. The suggested method is practical. Fundamental uncertainties in the physics of superdense matter in neutron stars are incorporated into the parameter (or the cooling rate ) which can be determined (constrained) from observations.
We applied our theoretical formalism to study the thermal state of the neutron star in the Cas A supernova remnant. We base our study on the recent results of Ho & Heinke (2009), which showed that the observed X-ray radiation from this neutron star can be interpreted as thermal radiation from a carbon atmosphere (and the radiation is emitted from the entire stellar surface). We discussed the data (Section 2) and provided a theoretical interpretation (Section 4), assuming that the Cas A neutron star (CANS) is thermally relaxed. Our analysis shows that the CANS cooling rate is K yr-1 and its internal temperature K (Fig. 3). Its thermal state is mainly determined by the cooling efficiency , compactness and mass of light elements in the heat-blanketing envelope. The magnetic field G expected in the surface layers of the CANS (Gotthelf & Halpern, 2007, 2009; Ho & Heinke, 2009; Halpern & Gotthelf, 2010) does not affect its cooling.
If the CANS has a moderate compactness and possesses an iron heat blanketing envelope or an envelope with a low mass shell of carbon (), we find (implying standard candle cooling). If it has the same heat blanket but larger we obtain a lower (slower neutrino cooling), with a minimum for . For the most massive carbon shell () and moderate , the CANS would have (implying a cooling rate enhanced with respect to the standard candle), but for the same shell and maximum it would have the standard-candle cooling efficiency . In summary, we find for the CANS. Though these results do not give an unambiguous physical picture of the thermal structure of the CANS, they do impose firm and robust constraints.
We also examined the possibility that the CANS has a high neutrino cooling rate but is still not thermally relaxed and, therefore, is not very cold (Section 6). We found that this is possible (though not likely) provided the neutron star has a very low thermal conductivity in the crust.
Note that we considered heat blanketing envelopes made of iron, as well as envelopes composed of an outer carbon shell. We could have complicated the model, e.g., introducing an oxygen shell beneath the carbon shell, but we do not expect qualitatively different results.
It would be instructive to apply the above analysis to other cooling neutron stars, in an attempt to reconstruct the cooling rate function . It is expected to be one and the same function for all neutron stars, and it contains an important information on neutron star structure.
acknowledgements
WCGH appreciates the use of the computer facilities at the Kavli Institute for Particle Astrophysics and Cosmology. DGY, PSS and AYP acknowledge support from the Russian Foundation for Basic Research (grants 08-02-00837 and 09-02-12080) and Rosnauka (Grant NSh 3769.2010.2). WCGH acknowledges support from the Science and Technology Facilities Council (STFC) in the United Kingdom through grant number PP/E001025/1. PSS acknowledges support of the Dynasty Foundation and RF Presidential Program MK-5857.2010.2. COH acknowledges support from the Natural Sciences and Engineering Research Council (NSERC) of Canada.
References
- Akmal et al. (1998) Akmal A., Pandharipande V. R., Ravenhall D. G., 1998, Phys. Rev. C, 58, 1804
- Alcock & Illarionov (1980) Alcock C., Illarionov A., 1980, ApJ, 235, 534
- Ashworth (1980) Ashworth W. B., 1980, J. Hist. Astron., 11, 1
- Brown (2000) Brown E. F., 2000, ApJ, 531, 988
- Brown & Cumming (2009) Brown E. F., Cumming A., 2009, ApJ, 698, 1020
- Brown et al. (2002) Brown E. F., Bildsten L., Chang P., 2002, ApJ, 574, 920
- Chakrabarty et al. (2001) Chakrabarty D., Pivovaroff M. J., Hernquist L. E., Heyl J. S., Narayan R., 2001, ApJ, 548, 800
- Chang & Bildsten (2004) Chang P., Bildsten L., 2004, ApJ, 605, 830
- Chang et al. (2010) Chang P., Bildsten L., Arras P., 2010, ApJ, accepted (arXiv:1008.1993)
- Davis (2001) Davis J. E., 2001, ApJ, 562, 575
- Douchin & Haensel (2001) Douchin F., Haensel, P. 2001, A&A, 380, 151
- Fesen et al. (2006) Fesen R. A., et al. 2006, ApJ, 645, 283
- Garmire (2003) Garmire G. P., Bautz M. W., Ford P. G., Nousek J. A., Ricker G. R., 2003, Proc. SPIE, 4851, 28
- Glen & Sutherland (1980) Glen G., Sutherland P., 1980, ApJ, 239, 671
- Gnedin et al. (2001) Gnedin O. Y., Yakovlev D. G., Potekhin A. Y., 2001, MNRAS, 324, 725
- Gotthelf & Halpern (2007) Gotthelf E. V., Halpern J. P., 2007, ApJ, 664, L35
- Gotthelf & Halpern (2009) Gotthelf E. V., Halpern J. P., 2009, ApJ, 695, L35
- Gudmundsson et al. (1983) Gudmundsson E. H., Pethick C. J., Epstein R. I., 1983, ApJ, 272, 286
- Gusakov et al. (2005) Gusakov M. E., Kaminker A. D., Yakovlev D. G., Gnedin O. Y., 2005, MNRAS, 363, 555
- Haensel et al. (2007) Haensel P., Potekhin A. Y., Yakovlev D. G., 2007, Neutron Stars 1. Equation of State and Structure. Springer, New York
- Halpern & Gotthelf (2010) Halpern J. P., Gotthelf E. V., 2010, ApJ, 709, 436
- Heinke & Ho (2010) Heinke C. O., Ho W. C. G., 2010, ApJ, 719, L167
- Heiselberg & Hjorth-Jensen (1999) Heiselberg H., Hjorth-Jensen M., 1999, ApJ, 525, L45
- Ho & Heinke (2009) Ho W. C. G., Heinke C. O., 2009, Nature, 462, 71
- Ho & Lai (2001) Ho W. C. G., Lai D., 2001, MNRAS, 327, 1081
- Hwang et al. (2004) Hwang U., et al. 2004, ApJ, 615, L117
- Kaminker et al. (2001) Kaminker A. D., Haensel P., Yakovlev D. G., 2001, A&A, 373, L17
- Kaminker et al. (2009) Kaminker A. D., Potekhin A. Y., Yakovlev D. G., Chabrier G., 2009, MNRAS, 395, 2257
- Lattimer & Prakash (2007) Lattimer J. M., Prakash M., 2007, Phys. Rep., 442, 109
- Lattimer et al. (1991) Lattimer J. M., Pethick C. J., Prakash M., Haensel P., 1991, Phys. Rev. Lett., 66, 2701
- Lattimer et al. (1994) Lattimer J. M., van Riper K. A., Prakash M., Prakash M., 1994, ApJ, 425, 802
- Lombardo & Schulze (2001) Lombardo U., Schulze H.-J., 2001, in Blaschke D., Glendenning N. K., Sedrakian A., eds., Physics of Neutron Star Interiors. Springer, Berlin, p. 30
- Mereghetti et al. (2002) Mereghetti S., Tiengo A., Israel G. L., 2002, ApJ, 569, 275
- Murray et al. (2002) Murray S. S., Ransom S. M., Juda M., Hwang U., Holt S. S., 2002, ApJ, 566, 1039
- Nomoto & Tsuruta (1981) Nomoto K., Tsuruta S., 1981, ApJ, 250, L19
- Nomoto & Tsuruta (1987) Nomoto K., Tsuruta S., 1987, ApJ, 312, 711
- Page (1993) Page D., 1993, in Strayer M. R., Guidry, M. W., eds., Proc. of the 1st Symp. on Nuclear Physics in the Universe. Adam Hilger, Bristol, p. 15
- Page (1998a) Page D., 1998a, in Buccheri R., van Paradijs J., Alpar M. A., eds., The Many Faces of Neutron Stars. Kluwer, Dordrecht
- Page (1998b) Page D., 1998b, in Shibazaki N., Kawai N., Shibata S., Kifune T., eds., Neutron Stars and Pulsars. Univ. Acad. Press, Tokyo, p. 183
- Page & Applegate (1992) Page D., Applegate J. H., 1992, ApJ, 394, L17
- Page et al. (2006) Page D., Geppert U., Weber F., 2006, Nucl. Phys. A, 777, 497
- Page et al. (2009) Page D., Lattimer J. M., Prakash M., Steiner A. W., 2009, ApJ, 707, 1131
- Pavlov & Luna (2009) Pavlov G. G., Luna G. J. M., 2009, ApJ, 703, 910
- Pavlov et al. (2000) Pavlov G. G., Zavlin V. E., Aschenbach B., Trümper J., Sanwal D., 2000, ApJ, 531, L53
- Pethick (1992) Pethick C. J., 1992, Rev. Mod. Phys., 64, 1133
- Potekhin et al. (1997) Potekhin A. Y., Chabrier G., Yakovlev D. G., 1997, A&A, 323, 415
- Potekhin et al. (2003) Potekhin A. Y., Yakovlev D. G., Chabrier G., Gnedin O. Y., 2003, ApJ, 594, 404
- Potekhin et al. (2007) Potekhin A. Y., Chabrier G., Yakovlev D. G., 2007, Ap&SS, 308, 353 (electronic version with corrected misprints: arXiv:astro-ph/0611014v3)
- Prakash et al. (1988) Prakash M., Ainsworth T. L., Lattimer J. M., 1988, Phys. Rev. Lett., 61, 2518
- Prakash et al. (1992) Prakash M., Prakash M., Lattimer J. M., Pethick C. J., 1992, ApJ, 390, L77
- Ransom (2002) Ransom S. M., 2002, in P. O. Slane, B. M. Gaensler, eds, ASP Conf. Ser. Vol. 271, Neutron Stars in Supernova Remnants. Astron. Soc. Pac., San Francisco, p. 361
- Reed et al. (1995) Reed J. E., Hester J. J., Fabian A. C., Winkler P. F., 1995, ApJ, 440, 706
- Shapiro & Teukolsky (1983) Shapiro S. L., Teukolsky S. A., 1983, Black Holes, White Dwarfs, and Neutron Stars. Wiley, New York
- Shternin & Yakovlev (2008) Shternin P. S., Yakovlev D. G., 2008, Astron. Lett., 34, 675
- Shternin et al. (2007) Shternin P. S., Yakovlev D. G., Haensel P., Potekhin A. Y., 2007, MNRAS, 382, L43
- Stephenson & Green (2002) Stephenson F. R., Green D. A., 2002, Historical Supernovae and their Remnants. Clarendon Press, Oxford
- Tananbaum (1999) Tananbaum H., 1999, IAU Circ. No. 7246
- Thorne (1977) Thorne K. S., 1977, ApJ, 212, 825
- Thorstensen et al. (2001) Thorstensen J. R., Fesen R. A., van den Bergh S., 2001, AJ, 122, 297
- Tsuruta (1998) Tsuruta S., 1998, Phys. Rep., 292, 1
- Yakovlev & Pethick (2004) Yakovlev D. G., Pethick C. J., 2004, ARA&A, 42, 169
- Yakovlev et al. (2008) Yakovlev D. G., Gnedin O. Y., Kaminker A. D., Potekhin A. Y., 2008, in Bassa C., Wang Z., Cumming A., Kaspi V., eds., AIP Conf. Proc. V. 983. 40 Years of Pulsars: Millisecond Pulsars, Magnetars and More. Am. Inst. Phys., Melville, NY, p. 379
- Yakovlev et al. (2001) Yakovlev D. G., Kaminker A. D., Gnedin O. Y., Haensel P., 2001, Phys. Rep., 354, 1