Long-term photometric monitoring of Messier 5 variables:
II. Blazhko stars
Abstract
The light curves of 50 RRab (RR0) stars in M5 collected in Paper I are investigated to detect Blazhko modulation. 18 Blazhko stars are identified, and modulation is suspected in two additional cases. The mean pulsation period of Blazhko stars is 0.04 d shorter than the mean period of the entire RRab sample in M5. Among the RRab stars with period shorter than 0.55 d the incidence rate of the modulation is as high as 60 per cent. The mean colours of Blazhko stars overlap with the colours of first overtone RRc (RR1) pulsators. The mean magnitudes of Blazhko stars are on the average 0.05-mag fainter than those of the RRab stars with stable light curves. Blazhko stars tend to be situated close to the zero-age horizontal branch at the blue edge of the fundamental-mode instability strip in M5. We speculate that this specific location hints that the Blazhko effect may have an evolutionary connection with the mode switch from the fundamental to the overtone-mode pulsation.
keywords:
stars: horizontal branch – stars: oscillations – stars: variables: RR Lyr – globular clusters: individual: M5.1 Introduction
The light-curve modulation of RRab stars (Blazhko effect) is one of the most outstanding problems of stellar pulsation theory, which has remained unsolved despite continuous observational and theoretical efforts. Recent, accurate, ground based and space observations (Jurcsik et al., 2008b; Chadid et al., 2010; Szabó et al., 2010) reveal more and more details of the snapshots of the modulations’ properties. However, contrary to the remarkable stability of the light curves of non-modulated RRab stars, the modulation properties of Blazhko variables may show significant changes on time-scales of years and decades e.g. in the cases of RR Gem (Sódor, Szeidl & Jurcsik, 2007), RR Lyr (Szeidl, 1976) and XZ Cyg (LaCluyzé et al., 2004). The only way to study these long-term changes is to combine archival data with modern observations. Globular clusters, which have been already observed regularly on a time base longer than a century, are ideal targets for following the variations of the modulation properties of Blazhko stars, provided that the modulation is strong enough to be detected in photographic data.
An accurate knowledge of the Blazhko-star population in globular clusters also yields an important information for determining the incidence of this phenomenon. Recent surveys show that about half the RRab stars exhibit light-curve modulation in some samples (Jurcsik et al., 2009b; Chadid et al., 2009), while previous estimates gave only 10–30 per cent.
M5, one of the closest globular clusters with about 100 RR Lyrae stars having been continuously observed during the 20th century, is one of the few possible targets for these studies. Blazhko stars are quite numerous in M5 based on previous photographic and CCD investigations. Already Oosterhoff (1941, hereafter Oo41 ) noted that the light curves of V2, V4, V14, V18, V27, V52, V63 and V72 in M5 were not stable; they showed irregular or RW Dra-type variability.111The star RW Dra, previously known as 87.1906 Dra (Szeidl et al., 2001) was the first RR Lyrae star to have long-period phase oscillations identified (Blazhko, 1907). The phenomenon is now referred to as the Blazhko effect. Blazhko effect was also identified by Kukarkin & Kukarkina (1971, hereafter KK71) in V2, V14, V18, V58 and V63. Using photographic observations, Goranskij (1976, 1980a, 1980b) determined Blazhko modulation periods for V2, V14 and V63. Based on their CCD observations, Reid (1996, hereafter R96) and Kaluzny et al. (2000, hereafter K00) noted light-curve variability of V2, V4, V5, V8, V14, V27, V56, V65, V89 and V97.
A comprehensive study of the Blazhko stars in M5 is, however, still missing. In Szeidl et al. (2010, Paper I) we collected all the photometric data of M5 variables in order to study the period changes of RR Lyrae stars. These data are utilized here to detect and study Blazhko variables.


2 Data and method
The homogenized (see section 2.3 of Paper I) light curves of the RRab stars in M5 were carefully examined to identify variables showing light-curve instability. Due to crowding problems, this was not possible for all the RRab stars in our sample. Variables lying in too crowded areas and/or having close bright companions could not be measured accurately enough to detect light-curve variability without doubt. This was especially true if no CCD observation of the variable was available. From the 65 RRab stars for which phase variation diagrams were constructed in Paper I, this was the case for 15 stars (V6, V13, V17, V25, V26, V36, V37, V54, V74, V83, V85, V90, V91, V92 and V96). These stars were denoted by the letter ‘’ in the ‘Remarks’ column of Table 4 in Paper I. The combined photographic and CCD light curves of the remaining 50 RRab stars were studied using different methods in order to detect light-curve variations and to determine modulation periods if it was possible. When CCD observations from different sources were also available, these data were investigated separately.
Different segments of the data were checked and analysed. If light-curve variability was suspected in any part of the data, Fourier analyses of the light curves and the maximum brightness/maximum timing data were also applied. The maximum brightness/phase data of globular-cluster variables are, however, very sparse (one-two data per season if any), and give useable information only in very few cases (e.g. in V19).
We searched for modulation-frequency signals in the vicinity of the low-order pulsation frequency components () corresponding to the same modulation frequency (). The modulation period () was then determined by a non-linear process that fitted the pulsation and some of the modulation frequencies ( and ) and their amplitudes and phases simultaneously to the data.
A Blazhko classification was assigned if at least one of the following criteria was fulfilled:
-
•
changes in the light curve’s amplitude, shape and/or phase were detected,
-
•
at least three modulation frequencies, corresponding to the same modulation period, appeared around the frequencies of the pulsation components in the residual spectrum of one subset of the light-curve data,
-
•
frequencies, corresponding to the same modulation period, appeared in the residual spectra of different subsets of the observations.
We note, however, that without accurate, extended, CCD photometric observations the results obtained from inhomogeneous, photographic data have to be regarded as somewhat uncertain. Even though the available CCD observations of the M5 variables show clear evidence of light-curve modulation in some cases, they do not allow the determination of the Blazhko period for any of the variables. Another problem is that the photographic data are seriously affected by daily, monthly and yearly aliases, which may result in an erroneous Blazhko period.
If a modulation period could be determined, its reality was visually checked using animations of the light curves in different phases of the modulation. The animated light curves of the M5 Blazhko variables and the data sets that were used are available at the url: http
:www.konkoly.hu/24/publications/M5.
3 Blazhko stars in M5
We identified 20 Blazhko candidates among the 50 RRab variables that were studied. The properties of the individual stars are discussed below.


Light curves of V18 for the 1965–1993 period.
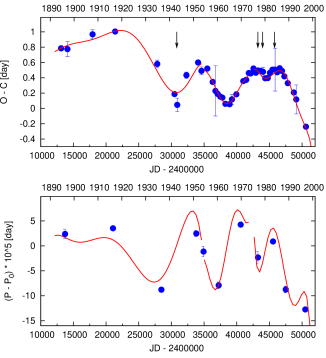
V1 There is a slight difference between the shape of minima observed by R96 and K00. The maximum brightness in the R96 data varies between 14.41 and 14.45-mag. The star is far from the centre, so it can be measured accurately on the photographic plates. The residual spectrum of the combined photographic data between JD 2441447 and JD 2449104 (1972–1993) shows a large-amplitude (0.05-mag) signal at cd-1. We found 522 d as the probable period of the modulation for this time interval. The modulation is dominated by min phase oscillations. This result is supported by the analysis of the variation of the seasonal values of the entire photometric data (1935–1997) as shown in Fig. 1. Phase oscillations with a period of 512 d fit the observed 0.02-d variation of the seasonal data reasonably well. The CCD data do not contradict this modulation period. The pulsation period of V1 remained constant during the time base of more than 100 years of the observations.
V2 The star is well separated. The pulsation period did not show any systematic changes during the hundred years of the observations, but irregular period changes of the order of d were detected. CCD data from K00 show different descending branches. Already Oo41 noted differences between two maxima. A modulation period of 132.38 d was determined by Goranskij (1976). We have found clear evidence of the modulation in three segments of the combined photographic data. Between 1971 and 1986, V2 exhibited a very strong modulation with a 136.5-d period. The pulsation amplitude varied between 0.6 and 1.3-mag; the detected changes in the maximum light were 0.6-mag and 75-min in brightness and phase, respectively. The scarce observations from 1966 and 1968 showed a large-amplitude (1.1-mag) light curve, without any evidence of modulation. Between 1956 and 1965 the modulation properties were similar to those found for the 1971–1986 interval, but due to the scarceness of the data, this result is less certain. We also found some indication of the modulation in the data from 1934 to 1955 but with half the period that was found in the other data segments. The pulsation amplitude did not change significantly; it was around 0.8-mag in this part of the data. Any amplitude modulation larger than 0.1-mag was not present, but the amplitude of the phase modulation of the light curve was as large as 60 min.
The residual spectra of V2 in the vicinity of the main pulsation frequency are shown for different segments of the data in Fig. 2 .

V4 This is the shortest-period RRab star in M5, close to the cluster centre, in a relatively crowded region. Contamination of close companion stars makes the photographic photometry noisy. Oo41 noted RW Dra-type variation of the light curve. The CCD light curve published in R96 indicates phase variation of the rising branch. The pulsation amplitude is larger in R96 than in the K00 data. The pulsation period had been steadily increasing prior to 1970, then a rapid period jump of about 0.00005 d occurred. We searched for a modulation period in the combined photographic data prior to and after the period jump. Between JD 2442553 and JD 2449104 we found clear signals of modulation with a 110-d period (see Fig. 3). The light curve was dominantly phase modulated. The light-curve modulation before 1970 was not so evident, however, a 107-d solution was possible.
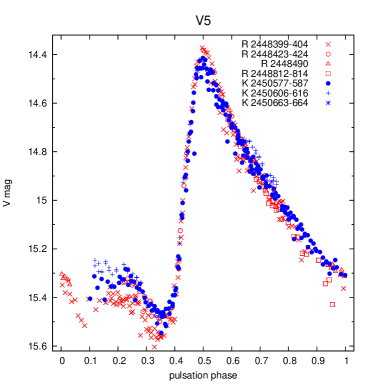
V5 The photographic data are very noisy because of crowding. R96 noted some evidence of light-curve variability. The R96 light curve has somewhat larger amplitude than the K00 one. Based on the combined CCD V data shown in Fig 4, V5 is a possible Balzhko star. The pulsation period was decreasing during the time span of the observations with one of the largest, steady, period-change rates observed in M5.
V8 The light-curve variability in the phases of the descending branch and at the base of the ascending branch was already noticed by R96. Differences around minimum light are also indicated by the K00 data. The amplitude of the CCD light curves from different observations varies between 0.85 and 1.0-mag. The star is well separated, therefore these variations are regarded as real. The residual signals appear at similar, 0.0155–0.0150 cd-1 separations from in the 1971–1977 and 1978–1993 data, indicating that the modulation period is about 64 d (Fig. 5). We failed to detect periodic light-curve modulation in the photographic data before 1971. The pulsation period has been steadily increasing but the period increase is not linear.


V14 Goranskij (1980a) determined a 75-d Blazhko-modulation period for V14. The CCD (R96, K00) light curves show strong amplitude modulation. The maximum-brightness variation is 0.7-mag in the band. The pulsation-period variation is strong and irregular, which makes the analysis of the light curve difficult. The star can be easily measured; the photographic data are not biased. A 47.8-d (0.021 cd-1) modulation period was determined for the 1971–1981 interval (see upper panel in Fig. 6). Although strong light-curve modulation was present in the other parts of the photographic data also, a modulation period close to 48 d was not found in any other subset. A 63.8-d modulation period fits the 1949–1959 data reasonably well. The residual spectrum of this data set is shown in the bottom panel of Fig. 6. The CCD data do not contradict either the 50 or the 64-d modulation period.
V18 The star is far from the centre, but a close companion (IV 75; Arp, 1962) at 6” distance with brightness similar to V18 at minimum light may contaminate the photometric data of low-resolution observations.
Oo41 noticed considerable changes in the shape and amplitude of the light curve, which were attributed to probable Blazhko effect in KK71. The pulsation-period variation of the star is very complex as can be seen in Fig. 7. The total range of the period variation is larger than 0.0001 d and abrupt period changes occur on time-scales of several thousands of days. The seasonal light curves of all the photographic and band CCD data are plotted in Fig. 8. The observations from different sources are denoted by different symbols. The pulsation light curve of V18 varies significantly from one season to the next, while the scatter of the light curves in the individual panels does not exceed what is expected from the inhomogeneous, photographic data. The band CCD light curves of Storm et al. (1991), Cohen & Matthews (1992) and K00 (not plotted in Fig. 8) also show significant variations.
The amplitude of the pulsation was smaller than 0.5-mag in 1977 and 1979, while no light variability was detected in 1943 and 1984 at all. There are three stars close to V18: IV74, IV75 and IV76 with 14.60, 15.82 and 17.19 magnitude, respectively (Arp, 1962). The mean magnitude of V18 measured in the 1984 Las Campanas observations is, however, 15.35-mag. This brightness value is close to the mean brightness of V18 in any other season, but it is significantly different from the magnitudes of the neighbouring constant stars. Therefore, we exclude the possibility that wrong identification of V18 can account for the constancy of its light curve in these years.
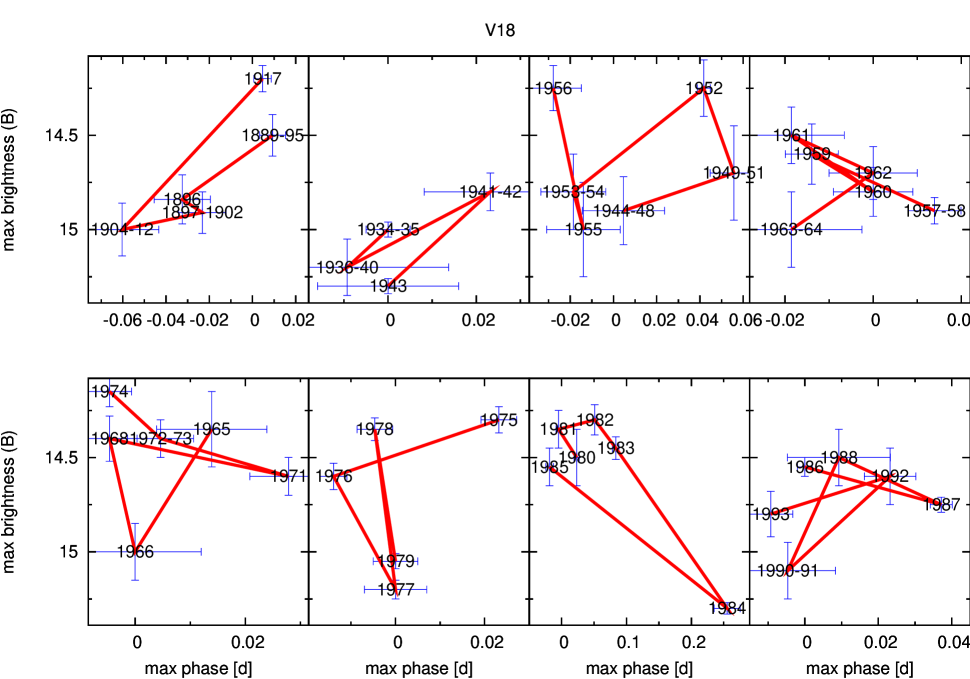
As the seasonal light curves of V18 do not show large inhomogeneity, the modulation cycle has to be relatively long, about hundreds of days. However, we failed to determine any modulation period when analysing the light curves of different segments of the data. The phase modulation cannot be separated from the irregular period changes (note the different periods of each column in Fig. 8). The residual spectrum of any data subset, which is long enough for analysis, is dominated by signals arising from the phase variation and/or the period change. The analysis of the amplitude variation using the maximum brightness data does not give any definite solution for the modulation period, either. The maximum brightness–maximum phase plots of the seasonal light curves also do not help to determine the modulation period (see Fig 10). We conclude that the modulation properties and the pulsation period of V18 vary probably on a similar time-scale, making the determination of the modulation period from the available data impossible.
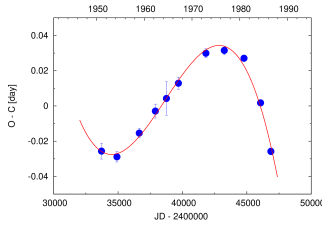
V19 Light-curve modulation is probable according to the CCD data (Storm et al., 1991, K00). The pulsation-period variation is complex, but it can be fitted with a smooth cubic function for the period between 1952 and 1987 as shown in Fig. 11. If this part of the combined observations is transformed in time to eliminate the period variation as described in Paper I, the modified data show clear evidence of an amplitude modulation with a d period. Fig. 12 shows the amplitude spectrum of the maximum brightness data between 1952 and 1987, and the data phased with the largest-amplitude frequency, 0.0254 cd-1 (39.4 d). The star is far from the centre with no close companion affecting the photometry.
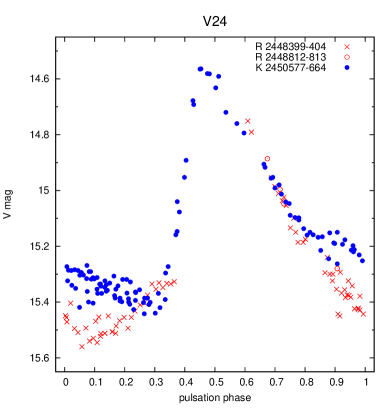
V24 The minima of the R96 and K00 CCD light curves differ conspicuously in phase and magnitude as shown in Fig. 13. It clearly indicates that the light curve of V24 is not stable. No maximum light was measured in R96. The star lies in a crowded region, the photographic data are seriously defective. The pulsation-period variation is irregular, because abrupt and continuous period changes both occur.
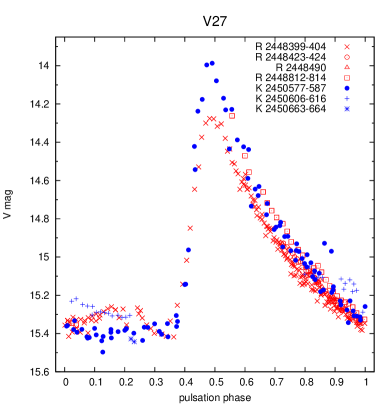
V27 The CCD data shown in Fig. 14 confirm the Blazhko effect of V27, which has already been recognized by Oo41. Because of crowding problems and irregular fluctuations of the pulsation period, no conclusive result for the modulation period can be drawn from the photographic data.

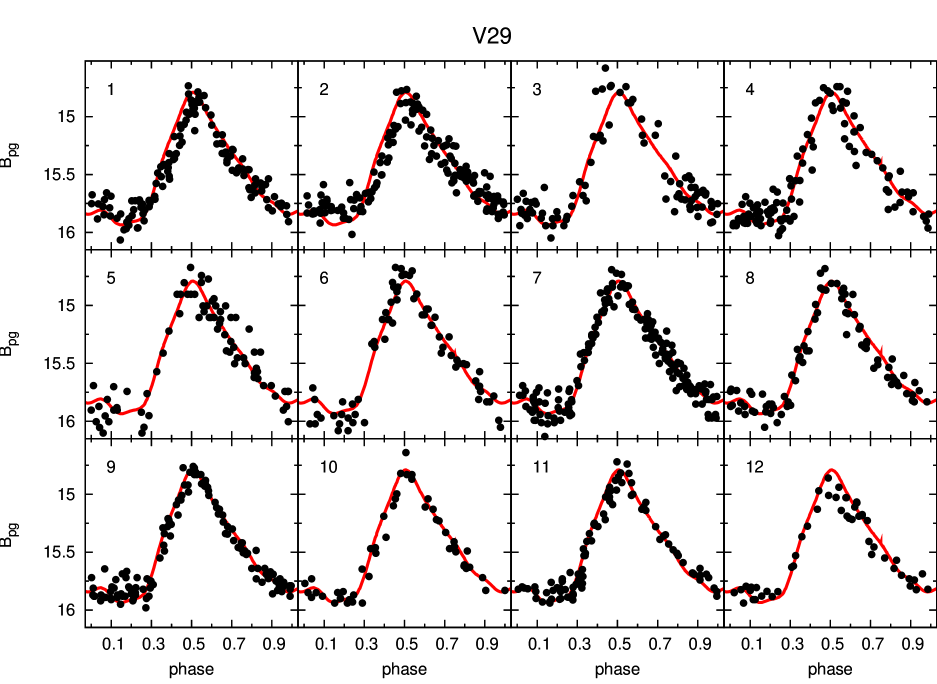
V29 A separate star, far from the cluster centre. The CCD light curve (K00) has a somewhat anomalous shape and small amplitude. The anomalous shape of the light curve was already recognised by Oo41. V29 is the second shortest-period RRab star in M5 ( d). Light curves belonging to the 12 subsets of the photographic observations are shown in Fig. 15. Variation especially on the upper part of the ascending branch can be suspected. The pulsation period of V29 decreased by 0.00006 d during the century-long time interval of the observations as shown in Fig. 1 of Paper I. During the second half of the observations, an d fluctuation was superimposed on the gradual period decrease. This is illustrated in the top panel of Fig. 16, which is a plot of the data from 1946 to 1993. Though no significant light-curve variation is detected, the Fourier parameters of the 2–3 year subsets of the photographic data show variations larger than their uncertainties would indicate (Fig. 16). No clear correlation between the variations of the Fourier parameters is evident; however, the changes in the ligh-curve parameters of Blazhko stars can be quite complex in some cases (see e.g. fig. 8 in Jurcsik et al. (2006) and fig. 12 in Jurcsik et al. (2008a)). Therefore, we suppose that V29 is probably a Blazhko variable, with modulation either with a period very close to one year or on a very long ( d) time-scale.
V30 The CCD amplitude of K00 is 0.05-mag smaller than that in the Storm et al. (1991) data. The star is far from the centre. Maximum-brightness variation in the photographic and CCD (Storm et al., 1991) data between 1971 and 1993 is also probable. The Fourier spectrum of this data set indicates a modulation frequency of 0.0011 cd-1 (900 d), however, a yearly alias solution (621 d) is equally possible (see Fig. 17). The pulsation period of V30 was constant during the century-long time base of the observations.
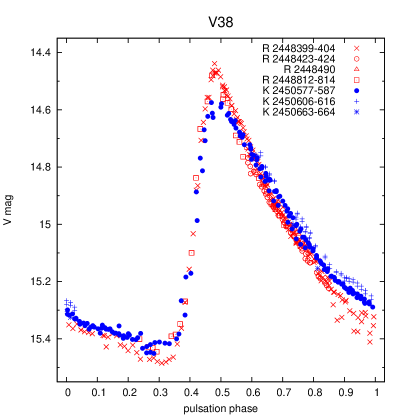
V38 The light curves are different in the R96 and K00 data as shown in Fig. 18. Companions at 5”–10” affect some of the photometric data. Because of irregular fluctuations in the pulsation period, we failed to find the period of the modulation from the photographic data. The pulsation period varied irregularly with a d amplitude.
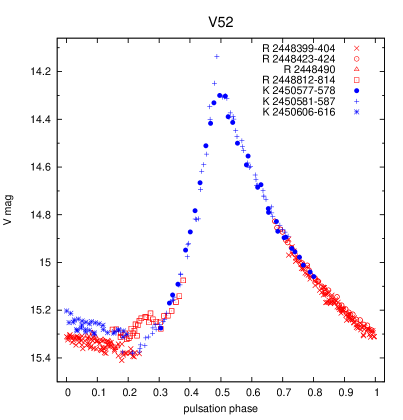
V52 Very faint stars are close to V52, a brighter star is at 12” distance. The light curve of V52 is somewhat anomalous, with smaller amplitude and less steep rising branch than that other RR Lyrae stars with similar period have. The pulsation-period variation is complex; abrupt and continuous changes of the period are detected. Oo41 classified the star as irregular. The CCD data shown in Fig. 19 indicate light-curve variability. The Fourier spectrum of the residual photographic data between 1974–1993 show modulation-frequency components at , and with cd-1 (95 d) (Fig. 20). The modulation is the most prominent in the phase and steepness of the rising branch.
V56 The CCD light curves of R96 and K00 have different shapes and amplitudes. The maximum-brightness variation is about 0.2-mag in band. A very faint close companion does not affect the photometry seriously. The photographic data show strong maximum-brightness variation, too. Modulation-frequency components corresponding to the same, a 115-d modulation period appear in the residual spectra of both the 1971–1993 and 1952–1963 photographic data, however, a 170-d alias solution cannot be excluded (Fig. 21). The CCD data do not contradict the 115-d modulation period. The period changes indicate long-term, cyclic variation.
V58 A separate star, far from the cluster centre. No CCD observation is available. Coutts & Sawyer Hogg (1969) classified V58 as irregular, while KK71 noted its Blazhko effect. The photographic data indicate modulation with a 59-d period (Fig. 22). Strong phase and amplitude modulations are detected. The pulsation period of V58 has monotonously decreased by 0.00002 d during the one-hundred-years of the observations.
V63 The star is far from the centre, there is no special source of photometric distortion. RW Dra-type variability was recognized by Oo41, and Goranskij (1980b) determined a 146.8-d Blazhko period of the amplitude variation. The CCD data from K00 cover only the maximum and descending branch of the light curve with mag differences. Modulation with a 46-d period can be detected in two different parts of the photographic observations (Fig. 23). Strong amplitude and phase modulations of the light curve are evident in both data sets. The pulsation period has been steadily increasing, but the instantaneous periods show large scatter probably connected to the Blazhko modulation of the star.
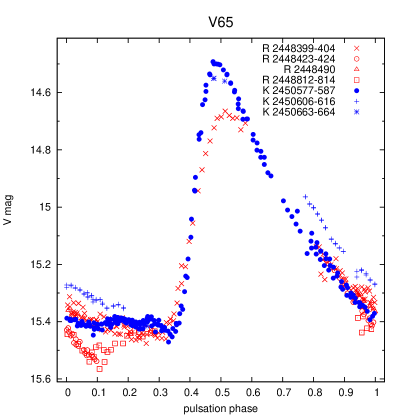
V65 A close (3”) companion with brightness similar to V65 at minimum light makes the photographic data unsuitable for detecting light-curve variability. The CCD data show light-curve variation both at maximum and minimum light (Fig. 24). The range of the pulsation period variation was about 0.000025 d; continuous and rapid changes were observed.
V72 A separate star at large distance from the cluster centre. Oo41 classified the star as irregular. No CCD observation of V72 is available. The pulsation period increased 0.00014 d abruptly sometime between 1917 and 1934, when no observation was obtained. Since 1934, the pulsation period has not changed systematically, but variations of about 0.05 d were detected in the yearly data (Fig. 25). The Fourier spectra of the residuals of two different segments of the data (1977–1991 and 1955–1968) have the largest-amplitude signals close to the main pulsation frequencies, which can be attributed to either pulsation-period variation or long-period Blazhko modulation of the light curve. The dominant signals are, however, at the same ( cd-1) separation from in both residual spectra as shown in Fig. 26. Therefore, we conclude that some of the scatter in the of V72 is the consequence of light-curve modulation with about a 1200-d period.
V97 The CCD light curve (R96) shows larger than 0.3-mag amplitude variation, and indicates that the period of the modulation is longer than 50 d. Photographic data are confined to the Oo41 and the Konkoly 1-m (Paper I) observations. Though crowding affects the photographic data seriously, a modulation period of about 211-d (or its yearly alias corresponding to 499 d) is presumed in the Konkoly data. Due to the sparseness of the observations, no definite conclusion on the pulsation-period variation of the star can be drawn.
4 Discussion
4.1 General properties of the Blazhko variables in M5
We searched for the Blazhko effect in the collected photometric data of 50 RRab stars in M5. As a result, we found clear evidence of the Blazhko effect in 18 cases, and, with less certainty, in two additional cases. However, small-amplitude modulation cannot be excluded in the remaining 30 RRab stars either, especially in the ones that lack CCD observations. Therefore, the detected 40 per cent incidence rate is a lower limit of the true occurrence of Blazhko stars in M5. This is in good agreement with the results of the recent, high-accuracy surveys of RRab stars: 47 and 40 per cent incidence rates of modulated light curves have been found in a sample of short-period ( d) variables (Jurcsik et al., 2009b) and in the Kepler field (Kolenberg et al., 2010; Benkő et al., 2010), respectively.
The modulation periods could be determined for 13 stars. The results are summarized in Table 1. The variable, the time interval of the data used to identify the modulation, the pulsation and the modulation periods, the amplitudes of the amplitude and the phase modulations, the intensity-averaged mean brightness (see Paper I) and the type of the pulsation-period change are given in the columns.
The formal errors of the modulation periods are 0.1–0.2 and 1–2 d for variables with Blazhko periods shorther and longer than about 100 d, respectively. However, the incompleteness of the data sampling resulted in alias solutions which were equally acceptable in some cases. The alias solutions corresponded to modulation periods that differed by tens/hundreds of days. If the selection of the modulation period was somewhat ambiguous, this was noted in the previous section, and the other possible modulation periods were also given.
The modulation properties are simply read from the folded light curves. Thus they give only rough estimates of the amplitudes of the amplitude and phase modulations, which might, in fact, be even larger for some of the Blazhko stars.
The mean magnitudes are derived from the CCD data of a narrow modulation-phase bin. They are estimated to be accurate within about 0.01–0.03 mag. The uncertainties of the mean magnitudes arise from zero-point errors/differences in the CCD data, from the incomplete phase coverage and from the possible changes in the mean brightness in the different phases of the Blazhko cycle ( mag).
The period distribution of the Blazhko variables is different from the distribution of the total sample of RRab stars in M5. The Blazhko effect favours shorter periods. The mean period of all of the RRab stars is 0.546 d, but for the Blazhko variables it is only 0.504 d. In the sample of RRab variables with periods shorter than 0.55 d and photometric data suitable for detecting light-curve variability, the occurrence rate is as high as 60 per cent. This is not a unique property of M5; Preston (1964) already recognized that ‘there may be a tendency for such variables to occur at slightly shorter periods than the class as a whole.’
In Fig. 27 the mean magnitudes and the amplitudes of M5 RR Lyrae stars are plotted against pulsation period and the colour index. Data are taken from Table 4 in Paper I. The observed largest amplitudes of Blazhko stars are plotted. The periods of the first-overtone variables are fundamentalized for direct comparison. The Blazhko stars occupy the short-period range of RRab stars, and are adjacent to the first-overtone RRc variables. Their colours overlap with those of the RRc stars. In fact, among the eleven bluest RRab stars with mean colour indices falling in the regime occupied by the RRc stars, all but one (V83) are identified as Blazhko variables. The poor quality of the photometry of the one, exceptional star (denoted by asterisk in Fig. 27), does not allow detection of any light-curve variability of this star.
| star | time interval [JD] | period [d] | modulation property | period change | ||||
| pulsation | modulation | amp(B) [mag] | phase [min] | |||||
| V1 | 2441447 – 2449104 | 0.521787 | 521.9 | 0.1 | 15 | 15.103 | stable | |
| V2 | a | 2440985 – 2446592 | 0.526260 | 136.5 | 0.6 | 75 | 15.093 | irreg. |
| b | 2435629 – 2438968 | 0.526277 | 129.7 | 0.6 | 75 | |||
| c | 2427540 – 2435310 | 0.526262 | 66.7 | 0.1 | 60 | |||
| V4 | a | 2442598 – 2449104 | 0.449618 | 110.1 | 0.1 | 45 | 15.047 | irreg. |
| b | 2434122 – 2438193 | 0.449671 | 106.9: | 0.3: | 30: | |||
| (V5:) | 2448399 – 2450664 | 0.545851 | 0.1(V) | - | 15.107 | decreasing | ||
| V8 | a | 2443631 – 2449104 | 0.546243 | 64.5: | 0.1 | 15 | 15.085 | irreg.⋄ |
| b | 2440985 – 2443286 | 0.546237 | 66.5: | 0.2 | - | |||
| V14 | a | 2440985 – 2444767 | 0.487188 | 47.8 | 0.5 | 50 | 15.080 | irreg. |
| b | 2433068 – 2436762 | 0.487159 | 63.8 | 0.5 | 50 | |||
| V18 | 2411148 – 2444767 | 0.464060 | 500 | 1.5 | 60 | 15.075 | irreg. | |
| V19 | 2434122 – 2447298 | 0.469987 | 39.4 | 0.4 | - | 15.088 | irreg. | |
| V24 | 2448399 – 2450664 | 0.478445 | 0.1∗(V) | 100∗ | 15.068 | irreg. | ||
| V27 | 2431259 – 2449104 | 0.470312 | 0.3(V) | - | 14.995 | irreg. | ||
| (V29:) | 2448399 – 2450664 | 0.451427 | 0.1: | 15.127 | decreasing† | |||
| V30 | 2440985 – 2448745 | 0.592176 | 901/621 | 0.2 | - | 15.067 | stable | |
| V38 | 2440985 – 2444767 | 0.470419 | 0.15(V) | 15.090 | irreg. | |||
| V52 | 2442126 – 2449104 | 0.501518 | 94.5 | 0.2: | 45 | 14.976 | irreg. | |
| V56 | a | 2440985 – 2449104 | 0.534695 | 115.1 | 0.5 | 30 | 15.116 | irreg. |
| b | 2434122 – 2438193 | 0.534690 | 114.2 | 0.6 | 45 | |||
| V58 | a | 2440985 – 2449104 | 0.491249 | 59.3 | 0.4 | 30 | – | decreasing |
| b | 2433068 – 2439979 | 0.491254 | 58.9 | 0.4 | 30 | |||
| V63 | a | 2440985 – 2449104 | 0.497684 | 46.4 | 0.4 | 30 | 15.06: | increasing† |
| b | 2432000 – 2439979 | 0.497680 | 46.6 | 0.3 | 30 | |||
| V65 | 2448399 – 2450664 | 0.480671 | 0.2∗(V) | 15.085 | irreg. | |||
| V72 | a | 2443225 – 2448394 | 0.562276 | 1199.7 | 0.1 | 80 | – | irreg. |
| b | 2435251 – 2439979 | 0.562270 | 1230.8 | 0.1 | 80 | |||
| V97 | 2442598 – 2449104 | 0.544623 | 211:/499: | 0.4 | 60 | 15.042 | insuff. data | |
| ⋄the period is increasing, but the period change is not linear | ||||||||
| †irregular fluctuations superimposed | ||||||||
| ∗variation in minimum light | ||||||||

Another interesting feature of the location of the Blazhko stars is that they tend to have faint mean-brightness values. The mean values of the brightness of the Blazhko and the regular RRab stars are and mag, respectively. No similar result has been previously shown. However, in most studies of globular-cluster Blazhko stars, the mean brightness has been determined without any distinction of the pulsation/modulation phase coverage of the data. These mean magnitudes may be seriously affected by the incomplete light-curve coverage that is typical in photometric observations of globular-cluster variables. In our previous studies of the field Blazhko variables (e.g. in Jurcsik et al., 2008a) it was shown that the mean brightness determined using a complete pulsation light curve at only one Blazhko phase does not differ more than mag from the true mean brightness. The mean-brightness values of Blazhko variables are determined in this way here, so they can be regarded as relatively accurate.
These specific features of the Blazhko stars raise the possibility that the onset of the Blazhko phenomenon is induced by evolution. One may speculate that the pulsation of RRab stars evolving blueward becomes unstable against the Blazhko effect (whatever it is) just preceding the mode switch to first-overtone pulsation. A possible relation between the Blazhko and the double-mode stars has been already proposed by Nemec (1985). However, detailed modelling of the mode switch from fundamental to overtone mode is still lacking.
Reviewing the variable populations of the globular clusters rich in RR Lyr stars, one finds that they are either rich in Blazhko stars (NGC362, NGC 3201, M5, Cen) or in double-mode variables (IC4499, M15) or in both (M3, M68). Blazhko phenomenon is quite common among the galactic-field RRab stars (Jurcsik et al., 2009b), but double-mode pulsators are rare. The occurrence of double mode and/or Blazhko stars in the different stellar populations, however, does not show clear correlation with any of their properties e.g. metallicity, HB-type, Oosterhoff-type. While Blazhko stars appear in all the globular clusters with large RR Lyrae population, variables showing fundamental-mode and first-overtone pulsation simultaneously are known basically only in M3, M15, M68, IC4499. Searching for the properties that foster the appearance of double mode or Blazhko modulation would be an important issue in disclosing any possible connection between these phenomena. There is even a unique variable, V79 (Goranskij et al., 2010) in M3, which shares the properties of both the double-mode and the Blazhko phenomena. V79 was a double-mode pulsator for 15 years, between 1992 and 2007. However, observations made in 2008–2009 showed it to be pulsating in the fundamental mode with a 65-d modulation period. Thus this is a good example of a star that confirms Nemec’s (1985) proposal.
In Paper I it was already shown that variables with irregular changes in their pulsation period all show the Blazhko effect, provided they have photometric data suitable for detecting light-curve variability. From the 20 Blazhko variables listed in Table 1, two do not show any period change, one has an increasing period with irregular fluctuations superimposed, one has a period that increases, but not at a uniform rate, two have periods that decrease steadily, one has strong irregularity superimposed on its gradual period decrease and 12 show nothing but irregular period fluctuations. (The remaining star does not have enough observations for characterizing its period-change behaviour.) Clearly, it can be concluded that the occurrence of the Blazhko modulation is usually accompanied by irregular fluctuations of the pulsation period and vice versa. We note that Stothers (1980) proposed a model that could account for both the irregular period changes and the Blazhko effect. He attributed them to hydromagnetic effects in the atmosphere of the pulsating star.
4.2 Special properties of some of the Blazhko variables in M5
The amplitude of the modulation of V18 is so large that sometimes it suppresses the pulsation totally. A similar example is V442 Her (Schmidt & Lee, 2000) with pulsation amplitude varying between 1.4 and 0.2-mag in the band. Modulation periods could not be derived for either star. In both stars, significant changes of the light-curve shape and amplitude occur from one season to the next, while the seasonal light curves, spanning days, are surprisingly homogeneous. The pulsation-period variations are extremely large; random period changes of the order of d are detected in both stars. Another globular-cluster variable that exhibits light-curve changes from one season to the next is the short-period RRab star, V15, in the Oosterhoff-type I cluster M4 (Clementini et al., 1994). It seems that in these special cases the Blazhko effect manifests itself in strong, random, abrupt changes of the light curves, lacking any clear periodic behaviour. This type of the modulation definitely cannot be explained by the appearence of non-radial-mode oscillations with frequencies close to the pulsation frequencies.
Other Blazhko stars with a special character are V29 and V72. These stars show hardly any amplitude variation, but their pulsation phase vary considerably on time-scales of some hundreds to thousands of days. The galactic-field analogue of these stars is RS Boo (Nagy, 1998), with mag amplitude and min phase modulations during its 530-d modulation cycle. The long-term pulsation-period variation of each of these stars is relatively simple: it is steadily decreasing for V29, fits two constant periods differing by d for V72, and has increased throughout the 110 years time base of the observations222http://rr-lyr.ast.obs-mip.fr for RS Boo. For V29 and V72 some fluctuations are superimposed on the global trend of their period variations (see also Paper I). The modulations of these Blazhko stars are dominated by cyclic or periodic phase variations. An important issue would be to determine why in some Blazhko stars the modulation is dominated by amplitude variations, while in others it is dominated by phase oscillations.
Significantly different frequencies of the modulation have been derived for different epochs for two Blazhko stars (V2 and V14), which cannot be explained by continuous changes of the modulation period. The ratios of the detected modulation periods are close to 2:1 and 4:3 for V2 and V14, respectively. Another case of strong multiperiodicity of the modulation has been documented in Sódor et al. (2010, CZ Lacertae). The modulation frequencies detected in CZ Lac were very close to 3:4 and 4:5 resonances. Rich modulation frequency patterns with multiplets of the same modulation frequency were revealed in extended, accurate observations of some Blazhko stars (MW Lyr and V1127 Aql in Jurcsik et al., 2008a; Chadid et al., 2010). In these cases the dominant modulation corresponded to the shortest frequency component of the multiplets. However, the examples of V2, V14 and CZ Lac show that in some Blazhko stars, from time to time, different components of a hidden modulation frequency multiplet may emerge. If these modulations correspond to elements of series of equidistant-spacing multiplets, their frequency ratios are close to fractions of small integer numbers. This indicates that the observed modulation-frequency values may not always correspond to the ‘base frequency’, i.e. the shortest frequency component of a multiplet. One must be cautious in interpreting the data.
4.3 Pulsation and modulation periods and period changes
Using a large sample of Blazhko variables, including stars from the galactic field, globular clusters, the galactic bulge, the LMC and the Sagittarius-dwarf galaxy, Jurcsik et al. (2005) showed that the larger the pulsation frequency of a Blazhko star is, the larger its modulation frequency can be. The modulation versus pulsation frequencies of the M5 Blazhko variables are plotted in Fig. 28, and it appears that a similar trend might occur in M5. However, the ranges of the observed pulsation and modulation frequencies are much smaller in M5 than in the sample investigated by Jurcsik et al. (2005). Most probably, if a relation between the pulsation and the modulation frequencies indeed exists, its actual form strongly depends on the global parameters of the stellar population studied (e.g, luminosity, chemical composition, age, etc.).
| star | [d] | [d] | [d] | [d] | [] | ||
| RR Gema | 0.3973 | 4.0 | 7.2 | 0.07 | 96 | 0.2 | 5.26 |
| DM Cygb | 0.4199 | 0.5 | 10.6 | 0.07 | -554 | -1.4 | -21.94 |
| RW Drac | 0.4429 | 11.0 | 41.8 | 0.5 | -48 | -0.5 | -0.51 |
| M5 V4d | 0.4496 | 5.3 | 110 | 3.2 | -250 | -6.0 | -1.04 |
| XZ Cyge | 0.4665 | 15.0 | 58 | 1.0 | -54 | -0.7 | -0.43 |
| RV UMaf | 0.4681 | 0.5 | 90 | 0.5 | -519 | -10.0 | -2.70 |
| XZ Drag | 0.4765 | 5.0 | 76 | 4.0 | 505 | 8.0 | 3.19 |
| M5 V58d | 0.4913 | 0.5 | 59 | 0.4 | -666 | -8.0 | -5.53 |
| M5 V63d | 0.4977 | 0.4 | 46.5 | 0.2 | -535 | -5.0 | -5.73 |
| M5 V2d | 0.5263 | 1.7 | 133 | 6.8 | -1582 | -40.0 | -6.26 |
| M5 V56d | 0.5347 | 0.5 | 115 | 0.9 | 840 | 18.0 | 3.92 |
| M5 V8d | 0.5462 | 0.6 | 65.5 | 2.0 | -2790 | -33.0 | -23.3 |
| M5 V72d | 0.5623 | 0.6 | 1200 | 31 | -2414 | -520.0 | -1.12 |
| References:a Sódor, Szeidl & Jurcsik (2007); b Jurcsik et al. (2009a); c Szeidl private comm.; | |||||||
| d this paper; e LaCluyzé et al. (2004); f Hurta et al. (2008); g Jurcsik et al. (2002). | |||||||

The long time-base of the observations of the M5 variables also made it possible to determine the modulation properties at different epochs for some variables. Significant changes in the modulation properties were already detected in RR Lyr (Szeidl, 1976), RR Gem (Sódor, Szeidl & Jurcsik, 2007), XZ Cyg (LaCluyzé et al., 2004) and CZ Lac (Sódor et al., 2010). In these stars the strengths of the amplitude and the phase modulations as well as the pulsation and the modulation periods vary. These changes are probably connected either to multi-periodicity of the modulation or to abrupt and continuous changes of the pulsation period. In Table 2 we summarize the detected changes in the pulsation and the modulation periods for all those variables, which have data at least for two different epochs. We note, however, that in those cases when the observed period changes have been determined for several epochs (e.g. XZ Dra, XZ Cyg, RW Dra, RV UMa), no strict relation between the pulsation- and the modulation-period changes of the variables holds. The connection between the period changes reflects some tendency rather than an exact relation. Therefore, results obtained from two-epoch data have to be taken with caution.
The columns of Table 2 give the pulsation and the modulation periods, the absolute values of their changes calculated from the periods given in Table 1 or taken from the literature, the normalized relative period variations, and the relative period and frequency variations for seven M5 and six field RRab stars, listed in order of increasing pulsation period. Examining these data we failed to find any regular pattern, but some general trends are evident. First, it seems that in general, there is an anticorrelation between the directions of the pulsation and the modulation period changes, i.e. a negative sign of is more common than a positive one. Secondly, it can be noticed that the relative period variations () and their normalized values tend to have larger absolute values for variables with longer pulsation periods than for shorter period ones.
The pulsation-period variation of one of the Blazhko stars, V56, can be described with a long, periodic/cyclic variation. This gives a unique possibility to test the binary origin of the long-period variation. If this were caused by the light-time effect the pulsation and modulation periods should have to show similar variation, because is the function of the elements of the orbit for any periodic signal (Coutts, 1971a). The observed normalised relative period variation of the pulsation and the modulation periods of V56 is, however, much larger than 1, it is 840 contradicting the orbital origin of the cyclic, long-period variation. However, keeping in mind that random variations in the modulation periods may override the supposed synchronous variations of the pulsation and the modulation periods, this result is not in fact conclusive.
5 Conclusions
Although Blazhko stars are usually numerous in globular clusters, which are rich in RR Lyrae stars, we hardly know anything about their properties because of a lack of data suitable for studying them. Results have been restricted to deriving the Blazhko periods, but even they have been successfully obtained only in a few cases, e.g. in M3 (Benkő et al., 2006). In this paper the RRab population of M5 are reviewed using all the available photometric data of the variables, in order to identify the Blazhko stars and to study their behaviour. Modulation periods were determined for 13 out of the 20 Blazhko stars that were identified. The long time base of the observations also made it possible to record changes in the observed properties of some of the Blazhko stars.
The most important results of this study can be summarized as follows:
-
•
Blazhko stars tend to be located in the short-period, low-luminosity region of the fundamental-mode instability strip. Their s overlap with the domain occupied by the first-overtone pulsators.
-
•
The pulsation-period variation of most of the Blazhko stars is slightly or significantly irregular.
-
•
There is no clear connection between the pulsation and the modulation period changes of the Blazhko stars, both parallel and antiparallel changes are detected.
Finally, we note that the possibilities of studying globular-cluster Blazhko stars are still unexploited. Although these studies would need relatively large observational efforts, the homogeneity of such samples would be helpful for determining what properties of the RR Lyrae stars predestine them to become Blazhko variables.
Acknowledgments
The constructive, helpful comments of the referee, Katrien Kolenberg are much appreciated. The financial support of OTKA grant K-068626 is acknowledged. C. Clement thanks the Natural Science and Engineering Council of Canada for financial support. Zs. H. thanks the ‘Lendület’ program of the Hungarian Academy of Sciences for supporting his work.
References
- Arp (1962) Arp, H., 1962, ApJ, 135, 311
- Bailey (1917) Bailey, S. I., 1917, Harvard Ann., 78, 103
- Benkő et al. (2006) Benkő, J., Bakos, G., Nuspl, J., 2006, MNRAS, 372, 1657
- Benkő et al. (2010) Benkő, J. et al, 2010, MNRAS, in press
- Blazhko (1907) Blazhko, S., 1907, AN, 175, 325
- Chadid et al. (2009) Chadid, M. et al., 2009, AIPC, 1170, 235
- Chadid et al. (2010) Chadid, M. et al., 2010, A&A, 510, 39
- Clementini et al. (1994) Clementini, G., Merighi, R., Pasquini, L. Cacciari, C., Gouiffes, C., 1994, MNRAS, 267, 83
- Cohen & Gordon (1987) Cohen, J.G., Gordon, G.A., 1987, ApJ, 318, 215
- Cohen & Matthews (1992) Cohen, J.G., Matthews, K., 1992, PASP, 104, 1205
- Coutts & Sawyer Hogg (1969) Coutts, Ch.M., Sawyer Hogg, H., 1969, Publ. David Dunlap Observatory 3(1), 1
- Coutts (1971a) Coutts, Ch. M., 1971, in Strohmeier, W. ed, New Directions and New Frontiers in Variable Star Research, Proc. IAU Coll. No.15, Veröff. der Remeis-Sternwarte Bamberg IX.(Nr.100.), 238
- Goranskij (1976) Goranskij, V. P., 1976, Per. Zvezdy Pril. 2, 323
- Goranskij (1980a) Goranskij, V. P., 1980a, Astr. Tsirk. 1096, 3
- Goranskij (1980b) Goranskij, V. P., 1980b, Astr. Tsirk. 1111, 4
- Goranskij et al. (2010) Goranskij, V., Clement, C. M., Thompson, M., 2010, in Sterken, C., Samus, N. and Szabados, L. eds, Variable Stars, the Galactic halo and Galaxy Formation, Published by Sternberg Astronomical Institute of Moscow University, Russia., p.115
- Hurta et al. (2008) Hurta, Zs., Jurcsik, J., Szeidl, B., Sódor, Á., 2008, AJ, 135, 957
- Jurcsik et al. (2002) Jurcsik, J., Benkő, J. M., & Szeidl, B., 2002, A&A, 396, 539
- Jurcsik et al. (2005) Jurcsik, J., Szeidl, B., Nagy, A., Sódor, Á., 2005, Acta Astr. 55, 303
- Jurcsik et al. (2006) Jurcsik, J. et al., 2006, AJ, 132, 61
- Jurcsik et al. (2008a) Jurcsik, J. et al., 2008a, MNRAS, 391, 164
- Jurcsik et al. (2008b) Jurcsik, J. et al., 2008b, MNRAS, 393, 1553
- Jurcsik et al. (2009a) Jurcsik, J. et al., 2009a, MNRAS, 397, 350
- Jurcsik et al. (2009b) Jurcsik, J. et al., 2009b, MNRAS, 400, 1006
- Kaluzny et al. (2000) Kaluzny, J., Olech, A., Thompson, I., Pych, W., Krzeminski, W., Schwarzenberg-Czerny, A., 2000, A&AS, 143, 215 (K00)
- Kolenberg et al. (2010) Kolenberg, K. et al., 2010, ApJ, 713, L198
- Kukarkin & Kukarkina (1971) Kukarkin, B.V., Kukarkina, N.P. 1971, Perem. Zvezdy Pril., 1 (No.1), 1 (KK71)
- LaCluyzé et al. (2004) LaCluyzé, A. et al., 2004, AJ, 127, 16
- Nagy (1998) Nagy, A., 1998, A&A, 339, 440
- Nemec (1985) Nemec, J. M., 1985, AJ, 90, 204
- Oosterhoff (1941) Oosterhoff, P. Th., 1941, Leiden Ann., 17 No.4 (Oo41)
- Preston (1964) Preston, G. W., 1964, Ann. Rev. A&A, Vol 2., 23
- Reid (1996) Reid, I. N., 1996, MNRAS, 278, 367 (R96)
- Schmidt & Lee (2000) Schmidt, E. G., Lee, K. M., 2000, PASP, 112, 1262
- Shapley (1927) Shapley, H., 1927, Harvard Bull., 851, 15
- Sódor, Szeidl & Jurcsik (2007) Sódor, Á., Szeidl, B. Jurcsik, J., 2007, A&A, 469, 1033
- Sódor et al. (2010) Sódor, Á. et al., 2010, MNRAS, in press
- Storm et al. (1991) Storm, J., Carney, B.W., Beck, J.A., 1991, PASP, 103, 1264
- Stothers (1980) Stothers, R., 1980, PASP, 92, 475
- Szabó et al. (2010) Szabó, R. et al., 2010, MNRAS in press
- Szeidl (1976) Szeidl, B., 1976, in Fitch, W. S. ed, Multiple Periodic Variable Stars, IAU Coll. No. 29., ASSL, Vol. 60, p. 133
- Szeidl et al. (2001) Szeidl, B., Oláh, K., Barlai, K., Szabados, L., 2001, Communications from the Konkoly Observatory, No. 102
- Szeidl et al. (2010) Szeidl, B., Hurta, Zs., Jurcsik, J., Clement, C., Lovas, M., 2010, MNRAS, submitted (Paper I)