Analysis of dependence among size, rate and duration in internet flows
Abstract
In this paper we examine rigorously the evidence for dependence among data size, transfer rate and duration in Internet flows. We emphasize two statistical approaches for studying dependence, including Pearson’s correlation coefficient and the extremal dependence analysis method. We apply these methods to large data sets of packet traces from three networks. Our major results show that Pearson’s correlation coefficients between size and duration are much smaller than one might expect. We also find that correlation coefficients between size and rate are generally small and can be strongly affected by applying thresholds to size or duration. Based on Transmission Control Protocol connection startup mechanisms, we argue that thresholds on size should be more useful than thresholds on duration in the analysis of correlations. Using extremal dependence analysis, we draw a similar conclusion, finding remarkable independence for extremal values of size and rate.
doi:
10.1214/09-AOAS268keywords:
.,
,
,
and
t1Currently at Google, Inc.
t2Supported in part by NSF CRI 07-09081.
Cheolwoo Park, Felix Hernandez-Campos, J. S. Marron, Kevin Jeffay, F. Donelson Smith
1 Introduction and background
In today’s Internet approximately 90% of all data is transmitted between applications that rely on Transmission Control Protocol (TCP) connections to provide reliable, in-order delivery of that data. A number of important issues have been raised concerning the existence of correlations between the amount of data transferred over a TCP connection (its size) and the duration of the connection or the rate at which the data is transferred. Intuitively, we would expect there to be a strong positive correlation between the size of data and the transfer’s duration since larger amounts of data should require more time to transfer at any given transfer rate. Similarly, there should be a strong negative correlation between the transfer rate and the duration since faster transfer rates should result in shorter connection durations for any given data size. In this paper we revisit the issue of dependence among sizes, durations and rates.
It is the presence (or absence) of correlation between the amount of data transferred and the rate at which it is transferred that has the most important implications for networking operations. We might find that the amount of data transferred is largely independent of the rate at which it is transferred. This could happen because the amount of data transferred in a TCP connection is the result of an explicit request by a user for some data object of a certain size and having some intrinsic utility for that user. The transfer rate, however, is determined by independent network factors such as the bottleneck link bandwidth, the maximum window size, the round-trip time and the loss rate.
Suppose instead we find that size and rate are strongly correlated. What might the implications be? One obvious possibility is that this correlation was caused primarily by users’ behaviors in choosing the amount of data they transfer based on their expectations of the rate at which it would be transferred. To quote directly from one study that found empirical evidence of a strong positive correlation between size and rate: “This is strong evidence that user behavior, as evidenced by the amount of data they transfer, is not intrinsically determined, but rather, is a function of the speed at which files can be downloaded” [Zhang, Breslau and Shenker (2002), page 309]. “Thus, users appear to choose the size of their transfer based, strongly, on the available bandwidth” [Zhang, Breslau and Shenker (2002), page 313].
If it can be shown that network users do, in fact, mostly select data objects based on expectations of the data transfer rate, there may be significant implications for future network growth and provisioning. If faster network technologies are deployed at the network edge (e.g., fiber to the home), users may choose to download larger data objects than when using slower edge links (cable modems, DSL). This in turn opens the possibility of new applications and services that inherently require larger data objects (e.g., videos in web pages, HD-DVD downloads). Conversely, if high bandwidth is not available to users, they may choose to forgo accessing these large objects since their size implies longer durations, and that may outweigh other intrinsic values. Large investments in network-edge technologies and backbone capacity by Internet service providers (ISPs) and content providers may be influenced by their perceptions of how strongly users react to their experiences that relate the intrinsic value of large data objects to the rate at which they are transferred.
Unfortunately, analyzing correlations in real-world TCP connections is difficult. The few published studies have produced mixed and sometimes conflicting results; these studies are reviewed briefly in Section 2. The analysis of TCP correlations is complicated by several TCP design factors, so a gentle introduction to them is given in Section 3. In this paper we use different data sets described in Section 3 consisting of TCP traces from three networks: a backbone link in the Internet/2 core (the Abilene network), and two access links—one from Bell Labs and another from the University of North Carolina at Chapel Hill (UNC).
In our examination of these data sets, we used both Pearson’s correlation coefficient and a two-dimensional analysis of joint thresholds on both size and duration on a log scale. We used Pearson’s correlation because we wanted to compare our results with those of Zhang, Breslau and Shenker (2002), which motivated this study, and drew a different conclusion using this simple method. In Section 4 we examined both the collection of all TCP connections in the traces and the subset consisting of only those used for web browsing. The latter subset represents a particular type of network application where users make choices of which data content to transfer and, thus, we might expect to see more correlation of size and rate. In correlation analysis, the choices of threshold to segment the data have influences on the results and this issue is addressed using both real network traces and simulated data. The simulated data were generated from a bivariate normal distribution, which was different from the actual distribution of size and duration (or rate) on a log scale. However, the thresholding effect was still valid for the simulated data, which implies that it is not data specific.
Many application protocols, notably the HyperText Transfer Protocol (HTTP) used by web browsers and servers, reuse an already established TCP connection (called a persistent connection) to transfer many data objects of various sizes. Each of these data objects might be chosen individually by the user, while the total duration and number of objects transferred on a persistent connection is more typically the result of constraints on resources such as memory at the server or browser program. To understand the potential differences in correlation between rates and sizes of connections vs. rates and sizes of data objects, we extracted the sizes of individual data objects transferred and repeated the analysis. These results are presented in Section 5. Finally, in Section 6, we applied an extremal dependence analysis method proposed by Hernández-Campos et al. (2005) to study the dependence among size, duration and rate. Section 7 gives conclusions based on our results and discusses their implications.
2 Related work
The first large-scale investigation of correlations among size, rate and duration in TCP was done by Zhang, Breslau and Shenker (2002). The data they analyzed came from packet traces from a mixture of network access and backbone links. The total data set represented over 20 billion packets. Their results are expressed in terms of correlations within TCP flows. In their analysis, they defined one flow for each unidirectional transmission of packets between the endpoints of a connection. In a very large number of network application protocols, data objects are transferred in only one direction of flow in the connection, while only small packets containing acknowledgments and control information are transferred in the reverse flow direction. Because of this issue, we focused in this study on TCP connections (bidirectional transfers of data between endpoints in an established TCP connection). We use connections instead of flows because they correspond more closely to the user and application concepts of complete data transfers.
Correlations among the logarithms of flow size, rate and duration were computed because of the wide range and skewed distributions of these metrics. Thresholds on durations were used to segment the data. For flows with durations longer than 5 seconds, they found the following results:
-
[]
-
Slight negative correlation between duration and rate (range across data sets of to ),
-
Slight positive correlation between size and duration (0.10 to 0.296), and
-
Strong positive correlation between size and rate (0.835 to 0.885).
The strong correlation of size and rate was also found when other values of the duration threshold were used. For flows with durations longer than 1 second, the correlations ranged from 0.65 to 0.77 and for those longer than 30 seconds, the range was 0.90 to 0.95. This increasing correlation strength with increasing duration threshold appeared to reinforce their case for users’ behavior that was dependent on expectations about available network transfer rates.
Lan and Heidemann (2006) also investigated the correlations among size, rate and duration in Internet flows using packet traces from regional and national backbone networks. They used the same definitions of flows (two unidirectional flows for each TCP connection), size, duration and rate as Zhang, Breslau and Shenker (2002) and computed correlations using Kendall’s method (which they claim is more robust to outliers and non-normality than Pearson’s method). Without using any threshold on duration or when using the same thresholds on duration (1 second, 5 seconds and 30 seconds) as Zhang, Breslau and Shenker (2002), they also found that size and rate were strongly correlated. Interestingly, when they used size as a threshold to segment the data, they found that size and rate correlations essentially disappeared or became very weak. They also found that most of the flows with durations longer than 30 seconds were actually relatively small in size (70% were smaller than 10 kB). By examining many of the flows in detail, they concluded that even flows with relatively long durations can be sufficiently small in size so that TCP protocol mechanisms are the primary source of correlations. Further, they found that the correlation of size and rate was strongly influenced by the TCP mechanisms even with sizes above 10 kB.
A third study that considered the correlation of size with rate and duration is presented by Lu et al. (2005). In this study, active measurements were done using the PlanetLab network to transfer various sizes of data using TCP connections and record the transfer times. As in the prior two studies, they found a strong correlation between size and rate (0.80 to 0.95) for file transfers using sizes that ranged from 5 kB to 1 GB. Their analysis concluded that most of the correlation was due to startup overheads and “residual” effects of TCP protocol mechanisms.
Taken together, the results from these three studies raise the possibility that a strong correlation exists between size and rate but not between size and duration in TCP connections. The results are, however, not completely consistent among studies. Further, it is not clear whether the correlations are best explained by TCP protocol effects or as the result of user choices and actions.
3 Data sets and methods
The one-hour Abilene-I trace was collected at a 2.5 Gbps link between Indianapolis and Cleveland. The capture took place on August 14, 2002, between 9 AM and 10 AM. It represents TCP connections among hundreds of universities and research institutions using a very heterogeneous set of technologies at the network’s edge. The link that was traced for the Bell Labs data connected the Murray Hill facility (a population of about 450 technical and administrative staff) to the Internet. The trace captures 168 hours of operation between May 19 and May 25, 2002. While the traced link was a 100 Mbps Ethernet carrying the Lab’s aggregated traffic to its router, the router’s outbound link to the Internet was limited to 9 Mbps.
The third trace was a one-hour trace of the 1 Gbps Ethernet link connecting the campus of the University of North Carolina at Chapel Hill (UNC) with its Internet router (this router’s outbound link to the Internet operated at 2.5 Gbps speed). The capture took place on April 30, 2003 at 7 PM. A population of over 40,000 users including students, faculty, and administrators from academic departments, research institutions, and a medical complex used this link for Internet connectivity. These three traces are contemporary with Zhang, Breslau and Shenker (2002). While they are somewhat old, the primary features of TCP that control transfer rate (i.e., slow start and congestion avoidance) remain basically unchanged. Furthermore, the bandwidths available to today’s home and wireless users are rapidly approaching those available to the users of the networks considered in our study (i.e., 10 to 100 Mbps).
The summary statistics for these three traces are given in Table 1. We identified the subset of our TCP connections that are likely to have been used for the web protocol HTTP. The summary statistics for the TCP and HTTP connections are also given in Table 1. As Table 1 clearly shows, we are using large samples (over one million in every case) of TCP and HTTP connections in this analysis. Further, Table 1 shows that these TCP connections are transferring large amounts of data including substantial proportions of web (HTTP) traffic.
| TCP | HTTP | ||||
| Trace | Packets | Connections | Bytes | Connections | Bytes |
| Abilene | 887.47 Million | 1,318,661 | 334.27 GB | 1,003,817 | 69.38 GB |
| Bell Labs | 27.93 Million | 2,313,744 | 80.80 GB | 1,967,442 | 27.26 GB |
| UNC | 109.80 Million | 1,433,924 | 120.35 GB | 1,055,823 | 37.33 GB |
We applied a number of trace processing tools used in Hernández-Campos (2006) to extract the necessary data on sizes, durations and rates. We eliminated connections with 0 second durations (a single packet). For each TCP connection we define its duration as the difference between the timestamps of the first and the last packet seen for this connection in the trace. The size of a TCP connection is the total number of bytes transferred by this connection (in both directions). The log (base 10) of both duration and size are computed for each TCP connection and used in the analysis.
Next we provide a brief, high-level introduction to the mechanisms in the TCP protocols [see Kurose and Ross (2007)] that may introduce correlations among size, rate and durations. Our purpose in this discussion is to clarify why it may be necessary to use certain thresholds in the analysis.
TCP sends data using a dynamically changing congestion window , which limits the maximum amount of unacknowledged data in the network to packets. Since acknowledgments from the receiver take a minimum of one round-trip time, , to reach the sender of the data, TCP cannot send data faster than . When the connection is established, the size of is first set to one packet (typically 1460 bytes of data), and it is doubled after each window of packets is fully acknowledged. This means that the rate of a TCP connection during startup is correlated with the size of the data transferred, since the more data there is to transfer, the greater the opportunity TCP has to further increase and therefore the rate. If a TCP connection is used to transfer an amount of data such that it continues to double every time interval, , then there are correlations among size, rate and duration. This, however, is correlation caused purely by TCP behavior and does not reflect any influence by users’ choices of data objects based on experienced transfer rates.
The window-doubling mechanism is used until either (a) there is a packet loss, (b) reaches a configured maximum at the sender (up to 1 MB), or (c) reaches the size of the receiver’s current buffer space available to hold packets (64 kB or less). Under normal (no loss) conditions, TCP transitions to increasing by 1 packet for each fully acknowledged window of packets after the threshold described in (b) above is reached. However, TCP cannot send at a rate that would cause the receiver’s buffer space to overflow, so the amount of unacknowledged data the sender can send into the network is constrained to be MIN (, receiver’s buffer space). If becomes larger than the receiver’s buffer space, the actual sending rate of the connection cannot increase and, therefore, the rate becomes stable and independent of the size of the data transferred. We have considered so far the rate of data units sent from the start of a TCP connection. The dependency between size and rate changes when the start of the data transfer is some point in the middle of a connection (e.g., the second and later data transfers in a persistent web browser connection). In this case, can be much larger at the start of the transfer than in the case of a transfer at the beginning of the TCP connection.
We cannot use measurements of rate and sizes near the beginning of a connection, since TCP itself, without any user interaction, creates a strong correlation between size and rate. This TCP induced correlation tends to not be present in longer transfers because of the limiting effect of relatively small receiver buffer space. Thus, analyzing measurements of larger data transfers is the correct way to study possible correlations with data size. Thresholds on duration alone are not sufficient. Based on TCP connection startup mechanisms, we argue that thresholds on size should be more useful than thresholds on duration in the analysis of correlations.
4 Correlation analysis of TCP connections
In this section we examine correlations of size, rate and duration considering the total size of data transferred on individual TCP connections. We compute Pearson’s correlation coefficients of the log of these three variables as in Zhang, Breslau and Shenker (2002) because of the large range and heavy tailed distribution. We first consider the correlation of size and duration where the definitions of those metrics are those given in Section 3. One observation from the prior work reviewed in Section 2 is that the choice of threshold to segment the data has influences on the results. We address this issue by performing an analysis of thresholds in two dimensions (size and duration) considered jointly. The main idea is to embed thresholds used in prior work in a larger, more complete analysis where we can study the effect as thresholds are varied in two dimensions.
 |
| (a) All Abilene connections, . |
 |
| (b) All Bell Labs connections, . |
 |
| (c) All UNC connections, . |
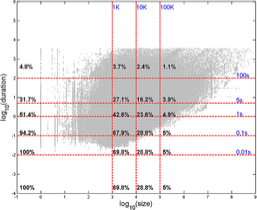
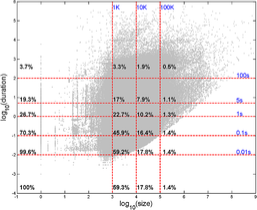
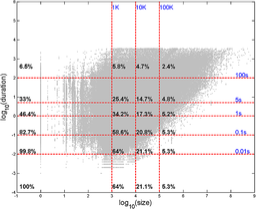
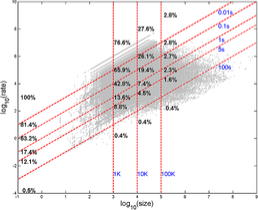
Figure 1 gives scatter plots of (duration) vs. (size) where each point represents one TCP connection found in the respective trace. Also shown on the plots are horizontal lines (showing how the population of TCP connections is divided into subpopulations by duration thresholds) and vertical lines (showing how the population is divided by size thresholds). All points above a horizontal line represent TCP connections with durations greater than the indicated threshold. Note that in Figures 1(a) and (c) no (duration) value is greater than 3.5 because these two traces are only 3600 seconds in duration. The Bell Labs trace was more than 2 orders of magnitude longer so (duration) values were observed.
All points to the right of a vertical line represent TCP connections with total size greater than the indicated threshold. The intersections of the threshold lines with each other or with the horizontal (bottom) and vertical (left) axes define subpopulations that include all the points above (longer duration) and to the right (larger size) of the intersection point. Near each such intersection is a number that gives the percentage of the total population that falls in the subpopulation.
| Duration | Size | Size | Size | Size | |
|---|---|---|---|---|---|
| (seconds) | 0 kB | 1 kB | 10 kB | 100 kB | |
| Abilene | 0.081 | 0.183 | 0.204 | 0.121 | |
| 0.010 | 0.225 | 0.281 | 0.254 | ||
| 0.180 | 0.253 | 0.301 | 0.295 | ||
| 0.415 | 0.445 | 0.376 | 0.310 | ||
| 0.453 | 0.465 | 0.376 | 0.310 | ||
| 0.453 | 0.465 | 0.376 | 0.310 | ||
| Bell Labs | 0.070 | 0.030 | 0.106 | 0.128 | |
| 0.159 | 0.190 | 0.214 | 0.139 | ||
| 0.210 | 0.177 | 0.177 | 0.134 | ||
| 0.396 | 0.324 | 0.235 | 0.198 | ||
| 0.434 | 0.432 | 0.278 | 0.198 | ||
| 0.436 | 0.433 | 0.278 | 0.198 | ||
| UNC | 0.204 | 0.145 | 0.287 | 0.305 | |
| 0.351 | 0.420 | 0.408 | 0.386 | ||
| 0.361 | 0.459 | 0.408 | 0.411 | ||
| 0.394 | 0.552 | 0.471 | 0.413 | ||
| 0.451 | 0.572 | 0.480 | 0.413 | ||
| 0.452 | 0.572 | 0.480 | 0.413 |
The size-duration correlation (computed as the Pearson’s correlation coefficient on a log scale) for each of the subpopulations shown in Figure 1 is given in Table 4. Considering all connections (duration and size ), we find only a weak positive correlation between size and duration that is remarkably consistent across traces (0.453, 0.436 and 0.452). When using only the 5-second duration threshold from Zhang, Breslau and Shenker (2002), we find a wider range (0.10, 0.159 and 0.351) but generally weaker correlation.
| Duration | Size | Size | Size | Size | |
|---|---|---|---|---|---|
| (seconds) | 0 kB | 1 kB | 10 kB | 100 kB | |
| Abilene | |||||
| Bell Labs | |||||
| UNC | |||||
We next examined the size-duration correlation for only those TCP connections used for HTTP protocols (i.e., for connections more likely to be associated with a user involved in web browsing). Table 4 gives the log–log correlation coefficients for size and duration for HTTP connections along with the percentage of connections contained in each subpopulation. The results show slightly larger but still weak positive correlations that are very comparable to those for all TCP connections.
Overall, these results confirm the conclusions from prior studies [Lan and Heidemann (2006), Zhang, Breslau and Shenker (2002)] that there is only weak correlation between size and duration for TCP connections, even when considering only those typically used for web browsing. Furthermore, our analysis showed that these conclusions are essentially independent of both size and duration thresholds.
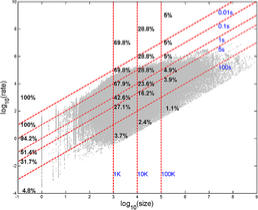
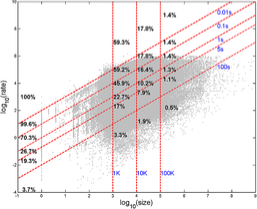
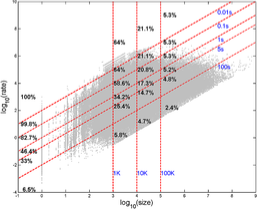
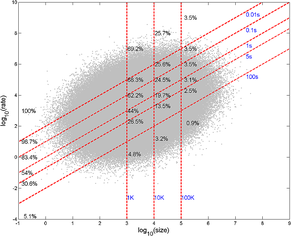
Size–rate relationships for all TCP connections are shown in Figure 2. The horizontal axis is (size) as before, but the vertical axis is (rate) computed as
| (1) |
The vertical lines represent the same size thresholds as before, but the duration threshold lines now slope upward to the right of the plot. Because of the minus sign in equation (1), the order of the threshold lines is reversed. The intersections of the size and rate threshold lines with each other or with the horizontal and vertical axes define subpopulations that include all the points below (longer duration) and to the right (larger size) of the intersection point (note that the intersection of the vertical threshold lines with the top horizontal axis defines a subpopulation based on size). Using this different orientation, we see in Figure 2(a) (Abilene) that 51.4% of the connections had durations of more than 1 second and 28.8% had a size of more than 10 kB. The subpopulation of connections with durations greater than 1 second and size greater than 10 kB was 23.6% of the total population.
 |
| (a) All Abilene connections, . |
 |
| (b) All Bell Labs connections, . |
 |
| (c) All UNC connections, . |
| Duration | Size | Size | Size | Size | |
|---|---|---|---|---|---|
| (seconds) | 0 kB | 1 kB | 10 kB | 100 kB | |
| Abilene | 0.490 | 0.332 | 0.340 | 0.484 | |
| 0.490 | 0.332 | 0.340 | 0.484 | ||
| 0.529 | 0.369 | 0.341 | 0.484 | ||
| 0.768 | 0.663 | 0.530 | 0.514 | ||
| 0.883 | 0.829 | 0.747 | 0.676 | ||
| 0.969 | 0.949 | 0.928 | 0.902 | ||
| Bell Labs | 0.211 | 0.083 | 0.077 | 0.263 | |
| 0.215 | 0.085 | 0.077 | 0.263 | ||
| 0.369 | 0.253 | 0.148 | 0.263 | ||
| 0.614 | 0.542 | 0.377 | 0.362 | ||
| 0.683 | 0.600 | 0.444 | 0.424 | ||
| 0.901 | 0.879 | 0.802 | 0.672 | ||
| UNC | 0.319 | 0.114 | 0.163 | 0.311 | |
| 0.323 | 0.116 | 0.164 | 0.311 | ||
| 0.459 | 0.195 | 0.200 | 0.313 | ||
| 0.761 | 0.603 | 0.464 | 0.348 | ||
| 0.863 | 0.752 | 0.615 | 0.474 | ||
| 0.959 | 0.941 | 0.911 | 0.832 |
The size–rate correlation coefficients for each of the subpopulations shown in Figure 2 are given in Table 4. Considering all connections, we found only weak positive correlations between size and rate across the three traces (0.49, 0.211 and 0.319). When we used a 5-second duration threshold, however, we found generally strong positive correlation with coefficients of 0.883, 0.683 and 0.863. When the duration threshold was increased to 100 seconds, the correlation appeared to be even stronger (0.969, 0.901 and 0.959). Even more interesting was the observation that for connections with durations over 5 seconds, the correlation became weaker as this subpopulation was further segmented by larger values of the size thresholds. For example, in the UNC trace, the size–rate correlation for connections lasting longer than 5 seconds was reduced from 0.863 to 0.615 by considering only those transferring more than 10 kB and further reduced to 0.474 for a 100 kB threshold. Further, if we applied a threshold only on size of 100 kB, the correlation became even weaker in all traces (0.484, 0.263 and 0.311), leading to a completely different conclusion about the relationship between size and rate than in Zhang, Breslau and Shenker (2002).
| Duration | Size | Size | Size | Size | |
|---|---|---|---|---|---|
| (seconds) | 0 kB | 1 kB | 10 kB | 100 kB | |
| Abilene | 0.351 | 0.230 | 0.214 | 0.376 | |
| 0.351 | 0.230 | 0.214 | 0.376 | ||
| 0.397 | 0.275 | 0.215 | 0.376 | ||
| 0.733 | 0.644 | 0.430 | 0.404 | ||
| 0.874 | 0.827 | 0.703 | 0.585 | ||
| 0.968 | 0.936 | 0.902 | 0.844 | ||
| Bell Labs | 0.093 | 0.057 | 0.040 | 0.224 | |
| 0.097 | 0.058 | 0.040 | 0.224 | ||
| 0.274 | 0.222 | 0.111 | 0.224 | ||
| 0.606 | 0.554 | 0.339 | 0.337 | ||
| 0.698 | 0.636 | 0.418 | 0.417 | ||
| 0.920 | 0.901 | 0.805 | 0.668 | ||
| UNC | 0.176 | 0.142 | 0.156 | 0.286 | |
| 0.179 | 0.144 | 0.158 | 0.286 | ||
| 0.341 | 0.230 | 0.204 | 0.291 | ||
| 0.718 | 0.657 | 0.508 | 0.339 | ||
| 0.837 | 0.798 | 0.664 | 0.506 | ||
| 0.962 | 0.952 | 0.922 | 0.860 |
Table 4 gives the log–log correlation coefficients for size and rate for only those connections likely to have been used for web access (HTTP protocols). From examining the correlation coefficients for the entire population and the subpopulations defined by different thresholds on HTTP connections, we found essentially the same results as when considering all connections—duration thresholds lead to strong positive correlations between size and rate, and size thresholds lead to weak correlations, especially for the largest sizes. Thus, our results hold even for connections used in web access where user decisions might have a larger influence.
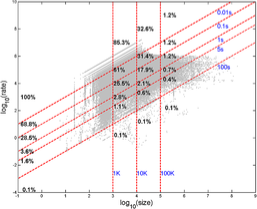
To investigate the performance of the thresholds for log–log correlation in a more general context, we considered a simulated bivariate Gaussian data set with characteristics similar to the (size) and (duration) pairs found in all connections from the UNC trace. In particular, the same sample size was used, and the mean vector and covariance matrix were estimated from the pairs ((size), (duration)). The randomly generated values for sizes and durations were used in equation (1) to produce a scatter plot of the ((size), (rate)) bivariate distribution as shown in Figure 3 with the corresponding correlation coefficients for each subpopulation given in Table 4.
| Duration | Size | Size | Size | Size | |
|---|---|---|---|---|---|
| (seconds) | 0 kB | 1 kB | 10 kB | 100 kB | |
| Simulated | 0.319 | 0.228 | 0.162 | 0.123 | |
| 0.383 | 0.256 | 0.170 | 0.124 | ||
| 0.506 | 0.351 | 0.218 | 0.141 | ||
| 0.657 | 0.525 | 0.343 | 0.203 | ||
| 0.748 | 0.655 | 0.473 | 0.293 | ||
| 0.859 | 0.826 | 0.713 | 0.516 |
To illustrate that thresholds used for correlations are generally unstable, the same analysis used above was applied to the simulated data. The duration thresholds of 5 seconds, as used by Zhang, Breslau and Shenker (2002), resulted in a correlation of 0.748. This is slightly smaller than the range of (0.83–0.88) they reported. The size thresholds of 100 kB resulted in the far smaller correlation of 0.123.
This shows that the dramatic differences in correlation, caused by the different types of thresholds, are not data set specific. In particular, it shows that the threshold effect we found on the empirical data is not caused by their non-Gaussian distributions of sizes and durations. If they were, it would be difficult to generalize the relationships among sizes, durations and rates obtained from our analysis due to different thresholding effects. Even for this simulated log-normal data, this same effect would be expected.
In fact, this finding is not surprising and can be analytically shown. Correlation in a singly truncated bivariate normal distribution was considered in Aitkin (1964), and moments and parameter estimation of a truncated bivariate normal distribution was studied in Rosenbaum (1960). Also, correlation under linear constraints on the bivariate range of the data in a multivariate normal distribution can be found in Johnson and Kotz (1972). Let be random variables whose joint density is the bivariate normal with means , variances , and correlation coefficient . Then, the truncated (at ) bivariate normal density is given by , where . If , then
for the truncated bivariate normal at .
In summary, the type of thresholds used critically impacts the correlation as expected. The important issue of which threshold was shown in Section 3 to be a choice of threshold on size.
5 Correlation analysis of application data units
Our conclusion from the results reported in Section 4 is that there is no strong (log–log) correlation of size and rate or size and duration either in all TCP connections or only in those associated with web browsing (HTTP protocols). It may be the case, however, that considering the duration and size of an entire TCP connection is too coarse a granularity to see the effects of user behavior. There is a fundamental distinction between the amount of data transferred over a TCP connection and the size of a data object. Many application protocols, notably HTTP, reuse an already established TCP connection to transfer many data objects of various sizes (a persistent connection). Each of the data objects transferred might reflect a user’s choice while the total duration and number of objects and bytes transferred on a persistent connection is more typically the result of constraints on resources such as memory at the server or browser program. Further, the duration of a persistent connection may be dominated by application-level synchronizations that can have a significant effect (for example, a web browser waiting for the server’s response, human “think times” between requests, or application processing times between sending data objects). We can reduce the impact of all these effects by considering only the size and duration of the actual transmissions of individual data objects. The purpose of the analysis reported in this section is to examine the possibility that correlations between size and rate may exist for individual data objects where they do not exist for entire TCP connections.
To understand the potential differences in correlation between rates and sizes of connections vs. rates and sizes of data objects, we extracted the sizes of individual data objects transferred from our traces and repeated the analysis. Methods have been developed to process packet-header traces and identify the packets belonging to individual objects (e.g., files, email messages) exchanged within a TCP connection. Specifically, we used extensions of the methods first described by Smith et al. (2001) to identify the packets for all data objects in the three traces used in this study. Since these data objects are specific to the applications that use them, we refer to them as application data units (ADUs).
For each ADU we defined its duration as the difference between the timestamps of the first and the last packets seen for this ADU in the trace. The size of an ADU was the total number of bytes in the packets that belong to it. Thus, size and duration of an ADU characterize the individual data objects independent of how many were exchanged in a TCP connection. As we did in Section 4, we considered both the population of all ADUs transferred on TCP connections and the subpopulation of only those ADUs used in web browsing HTTP protocols. In reporting the results, we omit the details of size-duration correlations and concentrate on the size–rate results, but the complete analysis is provided at http://www-dirt.cs.unc.edu/NetDepend/. For the size-duration correlations (both all ADUs and those in HTTP protocols) we found generally the same results as for full connections—there was only weak positive correlation, typically in the range 0.10 to 0.50.
| Duration | Size | Size | Size | Size | |
|---|---|---|---|---|---|
| (seconds) | 0 kB | 1 kB | 10 kB | 100 kB | |
| Abilene | |||||
| Bell Labs | |||||
| UNC | |||||
Table 5 shows the log–log correlation coefficients for all ADUs in the three traces along with the percentage of connections contained in each subpopulation. When considering all ADUs, we found moderately stronger positive size–rate correlation with coefficients 0.679, 0.662 and 0.626, consistent with the fact that we eliminated additional factors that affect the duration of TCP connections. When a duration threshold of 5 seconds was applied, the positive correlation of size and rate became very strong (0.963, 0.927 and 0.909). When we applied instead a size threshold of 100 kB, we found only very weak correlations (0.18, 0.257 and 0.109).
Figure 4 shows the scatter plots for those ADUs in TCP connections used for HTTP protocols in the three traces of (rate) vs. (size) with the usual threshold lines. The corresponding log–log correlation coefficients are given in Table 6. The log–log correlation coefficients for size and rate over all HTTP data units were 0.356, 0.249 and 0.346, showing much weaker positive correlation than for all ADUs. When a duration threshold of 5 seconds was applied, the positive correlation became very strong (0.979, 0.946 and 0.926). If we applied instead a size threshold of 100 kB, we found correlations ranging from very weakly negative ( and ) to very weakly positive (0.124).
Overall, these results show that there is little correlation between size and rate when considering object sizes (especially those larger than about 100 kB) and not just total TCP connection sizes. This is a new result and, we believe, is a stronger result because it reflects more directly the properties of data objects which users might choose to transfer (or not transfer) based on their expected transfer rates.
6 Extremal dependence analysis
It has been shown in a number of places [see Hernández-Campos et al. (2004) and references therein for example] that distributions for Internet flows are heavy tailed. This fact casts doubt on the use of Pearson’s correlation for understanding correlation among the largest values, since it only represents an average of values close to the mean, which can be insensitive to a very few relatively large values. In this section we consider an alternative dependence measure that focuses on the largest values of the bivariate random variables (size/rate, size/duration) with heavy tailed distribution. It is based on the idea that the extremes may carry distinctive dependence information, which is not seen from moderate values for bivariate heavy tailed data. Extremal dependence analysis assesses the tendency of large values of components of a random vector with heavy tailed distribution to occur simultaneously. The information from extremal dependence analysis can be qualitatively different from Pearson’s correlation. In addition, understanding the extremes is particularly interesting since we intuitively expect users to be more conscious of network performance when transferring the largest object. If we show the absence of such a feature in our data sets, it would indicate that no such effect is significant when considering a broad population of users and network conditions.
There has been a growing interest on measuring tail dependence between two random variables; see Hernández-Campos et al. (2005), Ledford and Tawn (1996, 1997), Resnick (2004), Zhang (2008) and the references therein. These methods are capable of providing a more stable and robust approach than the usual Pearson’s correlation. Recently Zhang (2008) considered the quotient correlation as an alternative measure to Pearson’s correlation. It can be viewed as the correlation coefficient in extreme value theory and provides more intuitive information where the tail behavior of data matters. It shows more efficiency over other linear correlation measures when nonlinear dependence occurs. A study of the tail behavior and nonlinear relationships among size, duration and rate using the quotient correlation would be interesting and we intend to do a thorough analysis in the future.
 |
| (a) Abilene data units (HTTP), . |
 |
| (b) Bell Labs data units (HTTP), . |
 |
| (c) UNC data units (HTTP), . |
| Duration | Size | Size | Size | Size | |
|---|---|---|---|---|---|
| (seconds) | 0 kB | 1 kB | 10 kB | 100 kB | |
| Abilene | 0.356 | ||||
| 0.576 | |||||
| 0.679 | |||||
| 0.921 | |||||
| 0.979 | |||||
| 0.986 | |||||
| Bell Labs | 0.249 | ||||
| 0.631 | |||||
| 0.761 | |||||
| 0.887 | |||||
| 0.946 | |||||
| 0.931 | |||||
| UNC | 0.346 | ||||
| 0.534 | |||||
| 0.649 | |||||
| 0.882 | |||||
| 0.926 | |||||
| 0.968 |
Usual methods in the context of extreme value theory require the distribution of the coordinatewise sample maxima under certain centering and scaling to converge to a product measure. This makes it hard to find meaningful results about the tail behavior of the product of two random variables due to their broad definitions. We use a new advance in statistical methodology proposed by Hernández-Campos et al. (2005), Resnick (2004) in this paper because it is based only on assuming multivariate regular variation of the observation vector and is a distribution moment instead of the measure of a region in the positive quadrant.
In the following subsections we briefly introduce our approach and give results from applying it to the data sets used in our study. Our primary purpose is to determine if a similar conclusion about the relationship between size and rate described in the previous two sections can be obtained using a completely different statistical methodology based on extreme value theory.
6.1 Background
In extreme value theory the concept of extremal (or asymptotic) independence is designed to make the asymptotic, limiting distribution of extremes a product distribution. Extremal independence implies that for a bivariate random vector with a heavy tailed distribution, the probability of both variables being large simultaneously is negligible in comparison to the probability of one of them being large. In other words, extreme values of the two variables tend to occur separately, not simultaneously. See Beirlant et al. (2004) for a formal introduction of extremal independence, and Resnick (2002) for an overview of recent work in this area.
 |
| (a) Scatter plot. |
 |
| (b) ICRT transform. |
 |
| (c) Polar coordinates plot with a 5% threshold. |
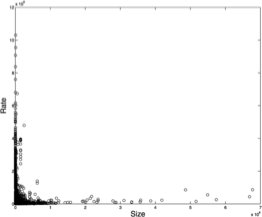
In Figure 5(a), rate versus size of the UNC connection trace is displayed as an example of extremal independence. There are some connections with a very large size (rate), but not unusually large rates (sizes, respectively). Thus, the large values of size and rate do not tend to occur together, which implies the extremal independent case. This phenomenon was called “axis hugging” in Hernández-Campos et al. (2005) since the data tend to hug the axes, and there is a very large empty region in the upper right corner of the plot. This is in line with the results provided in the previous two sections. This phenomenon can be found in other areas. For example, in finance an important issue is whether large changes in exchange rate returns for different currencies tend to occur together or separately; see Coles, Heffernan and Tawn (1999), Poon, Rockinger and Tawn (2001), Resnick (2004). Environmental statistics, including the study of extrema of sea and wind conditions, is another area where extremal (in)dependence analysis is likely to be useful; see de Haan and de Ronde (1998), Ledford and Tawn (1996, 1997).
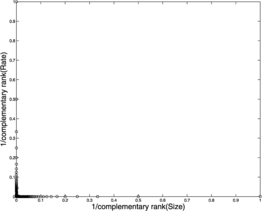
From here on we explain our extremal dependence analysis procedure step by step. One practical problem in applying the concept of extremal dependence is that the two variables should be on similar scales or transformed to the standard case where the marginal distribution tails of two variables are asymptotically equivalent and regularly varying with index ; see Hernández-Campos et al. (2005). As seen in Figure 5(a), scaling is not comparable in this example because the variables are of different orders of magnitude. Furthermore, there are many large values in some directions, and fewer in others. To make axes comparable, Hernández-Campos et al. (2005) suggested two ways for the estimation in the nonstandard case, the Inverse Complementary Rank Transform (ICRT) and angular rank methods. The angular rank method needs extra effort of tail index normalization, which brings much uncertainty. Therefore, we use the ICRT, which is based on the complementary ranks for both marginal distributions simultaneously, but in a way that preserves the critical bivariate structure [de Haan and de Ronde (1998), Einmahl, de Haan and Piterbarg (2001), Huang (1992)]. Figure 5(b) shows the scatter plot of the transformed data from (a). The ICRT was applied to both marginal distributions of size and rate.
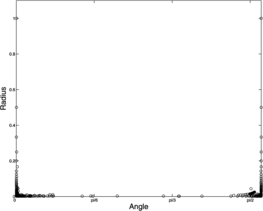
After the ICRT transformation the data are represented in polar coordinates and then thresholded to the subset with largest radius components. Thresholds are needed because we are interested in the behavior of the more extreme values of two variables. Extreme values are defined as the large radius components of polar coordinates and the thresholds determine “how large” they should be. For example, assuming that there are 1 million data points, a 0.01% threshold selects the subset of the 100 largest radii, while a 10% threshold selects the largest 100,000 radii. Then the distribution of the angles corresponding to the exceedances is studied for indications of extremal independence. Figure 5(c) shows the data in polar coordinates with a 5% threshold. An important consequence of the polar coordinate representation is simple quantification of the idea of “axis hugging.” In particular, distributions that have extremal independence are characterized by most of the angles (horizontal axis) being close to the endpoints of the interval as observed in Figure 5(c). On the other hand, distributions that have large values occurring simultaneously will have a different distribution of angles, in particular, with a greater frequency of angles near the middle of the range .
The Extremal Dependence Measure (EDM), introduced in Hernández-Campos et al. (2005), quantifies the concepts of extremal dependence and axis hugging, by measuring dependency between large values of two variables. EDM is defined through a set of angles , which are obtained from polar transformations of the data:
Here the parameter is the number of observations whose modulus is greater than some threshold value.
Using the selected set, we then compute the EDM, which measures the dependence between two variables as described above. The basis of the EDM is the mean squared distance from the data angles to , the center of the range of possible values, but it is linearly adjusted so that its values correspond to familiar values for the usual correlation. In particular, when the data points hug the axes (essentially extremal independence), most of the angles are near 0 or , so , and . When the data points lie near the 45 degree line, and (extremal dependence). One more indicator for interpretation of EDM comes from the fact that when the data have angles that are nearly uniformly distributed on , a simple calculation shows that and . We use the uniform distribution to interpret EDM, because it is in between the cases of extremal dependence and independence.
6.2 Data analysis
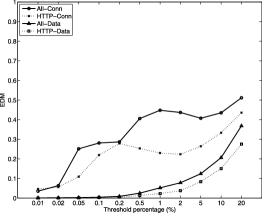
We applied EDA to the data sets used for this study and obtain EDM values but present here only the results for the size–rate analysis. In addition to EDM, a careful study of the full distribution of angles would provide useful information. The complete analysis for all the data sets can be found at http://www-dirt.cs.unc.edu/NetDepend/. We used a range of percentages of the data sets, selecting the largest 0.01%, 0.02%, 0.05%, 0.1%, 0.2%, 0.5%, 1%, 2%, 5%, 10% and 20% subpopulations of connections when their joint size and rate values are transformed to polar coordinate space. Figure 6 shows the EDM values as a function of the subpopulation size expressed as the percentages given above. Each plot shows results for four cases: all connections, only HTTP connections, all ADUs, and only ADUs from HTTP. With only one exception, the largest 10% of connections in each case show a tendency toward extremal independence between size and rate since , which is smaller than the uniform reference value of . This suggests less piling at the ends than for the uniform.
The exception is for all connections in the Abilene trace where the results might be considered inconclusive. Even the largest 20% of connections have EDM values indicating extremal independence (a few cases might be considered inconclusive). In no case is there an EDM value that would indicate any strong extremal dependence between size and rate (), even in the largest 20% of joint size and rate values. The results for size and duration were similar except with a few more values falling into the inconclusive range.
7 Conclusion
Our major results are as follows:
-
[]
-
We found that correlation between size and duration is much weaker than one might expect.
-
In contrast to Zhang, Breslau and Shenker (2002), we did not find strong correlation between size and rate in TCP transfers. This result holds for the total size of data transferred in all TCP connection, for the total size only in web connections and for the sizes of individual data objects (e.g., file sizes).
(a) Abilene. 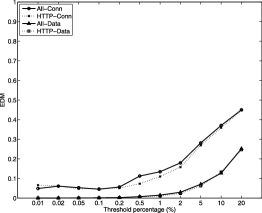
(b) Bell Labs. 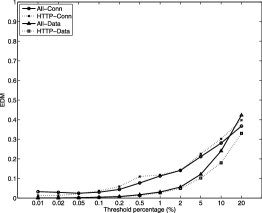
(c) UNC. Figure 6: EDM of rate–size correlation for Abilene, Bell Labs and UNC traces. -
We explained our differing conclusion by examining the impact of thresholding variables on the log–log correlation coefficient. We showed that the finding of correlation in Zhang, Breslau and Shenker (2002) was primarily due to the use of a duration threshold, which artificially created a strong correlation. Based on TCP connection startup mechanisms, we argue that thresholds on size should be more useful than thresholds on duration in the analysis of correlations.
-
Our extremal dependence analysis also showed a tendency toward extremal independence between size and rate.
An important observation from the results presented here is that there is no reason to believe that size and rate are strongly correlated in TCP connections. This conclusion was strengthened by showing that the same lack of strong correlation between size and rate exists even when considering the entire size of data transferred in all TCP connections, the sizes only in HTTP connections or the sizes of individual data objects (e.g., file sizes). It was also strengthened by studying the dependence with two very different methods of statistical analysis. As a consequence, our results indicated that available transfer rates had no measurable effect on object selection. In other words, we did not find that users are less willing to download larger objects as their available bandwidth decreases. Our observation is about the statistics for the entire population, which is the important part of traffic modeling, not about whether some users are responsive to available bandwidth. We are not claiming that users never make such choices. We have all made such choices ourselves. We claim only that we found no conclusive evidence that this was a common element of user behavior in networked applications. The near independence of size and rate may have important implications for network operators about technology deployment decisions, especially at the network edge. Further, we are not claiming that our findings about correlation of size and rate in TCP connections hold for the Internet of today. The traces examined in this study are quite old (circa 2002) relative to the pace of change in Internet technology and applications since then. While examining this issue with recent traces is the subject of future work, TCP’s slow start and congestion avoidance remain unchanged and we have no reason to expect any fundamental change in user behavior in response to network bandwidth.
Our primary contributions in this paper concern best practices in the use of statistical methods for studying Internet flows and we demonstrated that care in applying statistical methodology is essential. We saw that different interpretations of the data are possible depending on the choice of thresholds. We recommend that when thresholds are used to segment data sets, the analysis should consider the joint effects of the thresholds in a manner similar to the two-dimensional analysis of duration and size used here. We also recommend the use of EDA as a method to examine the relationships among the subset of larger values of a joint distribution (e.g., size and rate).
Acknowledgments
The authors would like to thank the Editor and two referees for suggestions that helped very much to improve this article.
References
- Aitkin (1964) Aitkin, M. (1964). Correlattion in a singly truncated bivariate normal distribution. Psychometrika 29 263–270. \MR0170412
- Beirlant et al. (2004) Beirlant, J., Goegebeur, Y., Segers, J. and Teugels, J. (2004). Statistics of Extremes: Theory and Applications. Wiley, Chichester. \MR2108013
- Coles, Heffernan and Tawn (1999) Coles, S., Heffernan, J. and Tawn, J. (1999). Dependence measures for extreme value analyses. Extremes 2 339–365.
- de Haan and de Ronde (1998) de Haan, L. and de Ronde, J. (1998). Sea and wind: Multivariate extremes at work. Extremes 1 7–45. \MR1652944
- Einmahl, de Haan and Piterbarg (2001) Einmahl, J., de Haan, L. and Piterbarg, V. (2001). Nonparametric estimation of the spectral measure of an extreme value distribution. Ann. Statist. 29 1401–1423. \MR1873336
- Hernández-Campos (2006) Hernández-Campos, F. (2006). Generation and validation of empirically-derived tcp application workloads. Unpublished Ph.D. dissertation, Univ. North Carolina at Chapel Hill, Dept. Computer Science.
- Hernández-Campos et al. (2004) Hernández-Campos, F., Marron, J. S., Samorodnitsky, G. and Smith, F. D. (2004). Variable heavy tails in internet traffic. Journal of Performance Evaluation 58 261–284.
- Hernández-Campos et al. (2005) Hernández-Campos, F., Jeffay, K., Park, C., Marron, J. S. and Resnick, S. (2005). Extremal dependence: Internet traffic applications. Stoch. Models 21 1–35. \MR2124357
- Huang (1992) Huang, X. (1992). Statistics of bivariate extreme values. Ph.D. thesis, Tinbergen Institute Research Series 22, Erasmus Univ. Rotterdam, Postbus 1735, 3000DR, Rotterdam, The Netherlands.
- Johnson and Kotz (1972) Johnson, N. L. and Kotz, S. (1972). Distributions in Statistics: Continuous Multivariate Distributions. Wiley, New York. \MR0418337
- Kurose and Ross (2007) Kurose, J. F. and Ross, K. W. (2007). Computer Networking: A Top-Down Approach. Addison Wesley, Boston, MA.
- Lan and Heidemann (2006) Lan, K.-C. and Heidemann, J. (2006). A measurement study of correlations of internet flow characteristics. Computer Networks 50 46–62.
- Ledford and Tawn (1996) Ledford, A. W. and Tawn, J. A. (1996). Statistics for near independence in multivariate extreme values. Biometrika 83 169–187. \MR1399163
- Ledford and Tawn (1997) Ledford, A. W. and Tawn, J. A. (1997). Modelling dependence within joint tail regions. J. Roy. Statist. Soc. Ser. B 59 475–499. \MR1440592
- Lu et al. (2005) Lu, D., Qiao, Y., Dinda, P. A. and Bustamante, F. E. (2005). Characterizing and predicting tcp throughput on the wide area network. In Proceedings of IEEE International Conference on Distributed Computing Systems 2005, 414–424.
- Poon, Rockinger and Tawn (2001) Poon, S.-H., Rockinger, M. and Tawn, J. (2001). New extreme-value dependence measures and finance applications. In CEPR Discussion Paper No. 2762. Available at Social Science Research Network: http://ssrn.com/abstarct=267283.
- Resnick (2002) Resnick, S. (2002). Hidden regular variation, second order regular variation and asymptotic variation. Extremes 5 303–336. \MR2002121
- Resnick (2004) Resnick, S. (2004). On the foundations of multivariate heavy tailed analysis. J. Appl. Probab. 41A 191–212. \MR2057574
- Rosenbaum (1960) Rosenbaum, S. (1960). Moments of a truncated bivariate normal distribuion. J. Roy. Statist. Soc. Ser. B 23 405–408. \MR0132630
- Smith et al. (2001) Smith, F. D., Hernández-Campos, F., Jeffay, K. and Ott, D. (2001). What tcp/ip protocol headers can tell us about the web. In Proceedings of ACM SIGMETRICS 2001 Conference 245–256.
- Zhang, Breslau and Shenker (2002) Zhang, Y., Breslau, L., V., P. and Shenker, S. (2002). On the characteristics and origins of internet flow rates. In Proceedings of ACM SIGCOMM 2002 Conference 309–322.
- Zhang (2008) Zhang, Z. (2008). Quotient correlation: A sample based alternative to pearson’s correlation. Ann. Statist. 36 1007–1030. \MR2396823