C. Tortora
Colour and stellar population gradients in galaxies
Abstract
We discuss the colour, age and metallicity gradients in a wide sample of local SDSS early- and late-type galaxies. From the fitting of stellar population models we find that metallicity is the main driver of colour gradients and the age in the central regions is a dominant parameter which rules the scatter in both metallicity and age gradients. We find a consistency with independent observations and a set of simulations. From the comparison with simulations and theoretical considerations we are able to depict a general picture of a formation scenario.
keywords:
galaxies : evolution – galaxies : elliptical and lenticular, cD.1 Introduction
Different physical processes might rule the galaxies’ properties at the global galaxy scale, or act at sub-galactic scales (e.g. the nuclear regions vs outskirts), such that they are expected to introduce a gradient of the main stellar properties with the radius that shall leave observational signatures in galaxy colours. In fact, color gradients (CGs) are efficient markers of the stellar properties variations within galaxies, in particular as they mirror the gradients of star ages and metallicities (Tortora et al. 2010a, T+10 hereafter). CGs are primarily a tool to discriminate the two broad formation scenarios (monolithic vs hierarchical), but more importantly they provide a deeper insight on the different mechanisms ruling the galaxy evolution. As these mechanisms depend on the galaxy mass scale, the widest mass (and luminosity) observational baseline is needed to remark the relative effectiveness of the different physical processes (such as merging, AGN, supernovae, stellar feedback, etc) and their correlation with the observed population gradients.
We will discuss the colour, age and metallicity gradients for a huge sample of local SDSS early- and late-type galaxies (ETGs and LTGs, hereafter) from Blanton et al. (2005b, B+05 hereafter), and analyze the trends with mass. The observed trends are interpreted by means of quite different physical phenomena at the various mass scales. See T+10 for further details111We have used the structural parameters given by B+05 to derive the color profile of each galaxy as the differences between the (logarithmic) surface brightness measurements in the two bands, and . The CG is defined as the angular coefficient of the relation vs , where is the effective radius..
We assume a set of “single burst” synthetic stellar models from Bruzual & Charlot (2003), with age and metallicity () free to vary. From the fitting to the observed colours we estimate the galaxy age, , and the stellar mass222We define the age and metallicity gradients as and , where with are the estimated age and metallicity at and , respectively..
2 Colour gradients
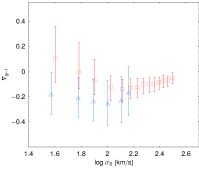
We start from showing in Fig. 1 the results for the CGs as a function of stellar mass and velocity dispersion for the whole galaxy sample. The gradients as a function of velocity dispersion look negative almost everywhere. Although our sample does not include very massive galaxies (), our results seem to show a stable trend at the large mass scales, pointing to even shallower gradients. We note here that the smaller range shown by as a function of in the left panel of Fig. 1 is mainly due to the mix of the ETGs and LTGs. While, the correlation with stellar mass show that, starting from the massive/bright end, the CGs become steeper, with the steepest negative gradients corresponding to . From there, the gradients invert the trend with luminosity and mass, becoming positive at .


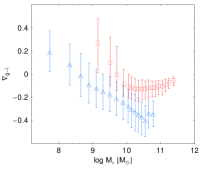
From Fig. 2, we see that LTGs show a monotonic decreasing trend, while a U - shaped function is found for ETGs with the gradients definitely decreasing with the mass for , and a mildly increasing for larger mass values. This mass scale is roughly compatible with the typical luminosity (and mass) scale for ETG dichotomy in the galaxy structural properties (Capaccioli et al. 1992) or for star-forming and passive systems (Kauffmann et al. 2003). Nevertheless, for a fixed stellar mass we observe that ETGs gradients are, on average, shallower than LTG ones. The same two - fold trend is shown for ETGs gradients as function of the velocity dispersion, while no trend is observed for LTGs gradients.
3 Age and metallicity gradients
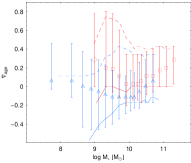
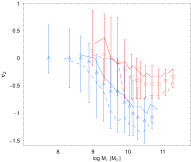
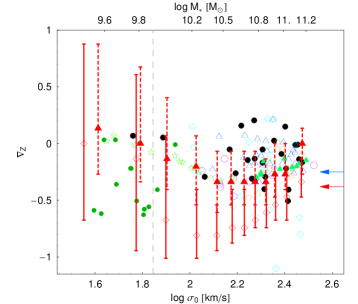
As shown in Fig. 3, for LTGs the is about zero both with mass (and with , see T+10), strongly suggesting that CGs should not depend on age gradients of the galaxy stellar population. Actually, is instead strongly dependent on , with the lowest metallicity gradients () at the largest masses. ETG age gradients seem basically featureless when plotted against where we find with typical median values of . On the other hand, the metallicity gradients show some features with decreasing for , and increasing for larger velocity dispersion, reaching the shallowest values () at and at the very low (i.e. ) where . This peculiar trend is mirrored by a similar dependence on the stellar mass. This two-fold behaviour is also significant when we plot as a function of the stellar mass: decreases at , and increases in more massive systems. We have also found that and strongly depend on galaxy age: in particular, if we separate the sample in systems with older and younger than central stars, we obtain different age and metallicity gradient trends as shown in Fig. 3. Older systems have gradients which are shallower than younger (in particular for ETGs) and bracket the average trend of the whole samples.
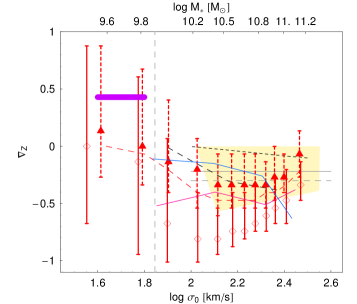
In the left panel of Fig. 4 we proceed to a more detailed comparison of our findings with a set of literature works which make use of a more sophisticated analysis, although usually associated to smaller samples (e.g. Rawle et al. 2009, Spolaor et al. 2009). In particular, we concentrate on the ETG sample. When considering objects with , the agreement with the other studies (generally dealing with old systems) is remarkably good.
4 Discussion and conclusions
We have found some peculiar trends for CGs as a function of stellar mass, which are mainly driven by metallicity gradients, although age gradients have a not negligible role. ETGs, have gradients which are null at and become steeper at , where the trend get inverted and tend to be shallower at very large masses. LTGs have null colour and metallicity gradients at , which steepen with stellar mass and at fixed mass metallicity gradients are steeper than the ones in ETGs. The scatter in gradients is driven by the central galaxy age, since centrally older (younger) systems are found to have shallower (steeper) metallicity gradients.
From the comparison with a set of simulations, which rely on different physical phenomena (e.g., see for ETGs right panel in Fig. 4), we are able to point out the main physical phenomena at different mass scales. Our results seem to support the idea that the metallicity trend versus the stellar mass for LTGs is mainly driven by the interplay of gas inflow and winds from supernovae and evolved stars (2004). These processes tend to increase the central metallicity and prevent the enrichment of the outer regions. Therefore more massive systems have on average larger central metallicities which correspond to steeper negative gradients. Low mass ETGs show the same correlation (see also the results from the simulation in Tortora et al. 2010b), which suggest that these systems might experience similar phenomena as LTGs (see the comparison with the different supernovae feedback recipes in Fig. 4). Moreover, the absolute value of of ETGs is lower than for the LTGs, probably as a consequence of the dilution of the gradient due to the higher-density environment where ETGs generally are located. At very low masses ( and ) the turns to even positive values, which are compatible with the expanding shell model from Mori et al. (1997). At larger masses, the shallow metallicity gradients of ETGs suggest that these have experienced merging (at a rate that could increase as a function of the stellar mass) which have diluted the . Such events might have taken place in earlier phases of the galaxy evolution, as indicated by the presence of null age gradients in old systems (not shown here, but see Bekki & Shioya 1999, 2004, Hopkins et al. 2009a). While, systems with younger cores are expected to show positive gradients (as found in Hopkins et al. (2009a)). After the initial gas rich-merging events that might produce both a larger central metallicity and a positive age gradient (2004), subsequent gas poor-merging may dilute the positive age gradient with time as well as make the metallicity gradients to flatten out (Hopkins et al. 2009a). However, a further mechanism that may act to produce the shallower (or almost null) color and metallicity gradients in old massive ETGs, with and (Fig. 4), might be due to the strong quasar feedback at high redshift (Tortora et al. 2009), while steeper metallicity gradients at lower masses could be linked to less efficient AGNs.
Acknowledgements.
CT is supported by the Swiss National Science Foundation.References
- Blanton et al. (2005b) Blanton M. R. et al. 2005, AJ, 129, 2562 (B+05)
- Bekki & Shioya (1999) Bekki K., & Shioya Y. 1999, ApJ, 513, 108
- Bruzual & Charlot (2003) Bruzual A. G. & Charlot S. 2003, MNRAS, 344, 1000
- Capaccioli et al. (1992) Capaccioli M., Caon N. & D’Onofrio M. 1992, MNRAS, 259, 323
- Chabrier (2001) Chabrier G. 2001, ApJ, 554, 1274
- Dekel & Birnboim (2006) Dekel A. & Birnboim Y. 2006, MNRAS, 368, 2
- Hopkins et al. (2009a) Hopkins P. F. et al. 2009, ApJS, 181, 135
- Kauffmann et al. (2003) Kauffmann G. et al. 2003, MNRAS, 341, 54
- Kawata (2001) Kawata D. 2001, ApJ, 558, 598
- Kawata & Gibson (2003) Kawata D. & Gibson B. K. 2003, MNRAS, 340, 908
- (11) Kobayashi C. 2004, MNRAS, 347, 740
- Mori et al. (1997) Mori M. et al. 1997, ApJ, 478, 21
- Rawle et al. (2009) Rawle T.D., Smith R.J. & Lucey J.R. 2010, MNRAS, 401, 852
- Spolaor et al. (2009) Spolaor M. et al. 2009, ApJ, 691, 138
- Tortora et al. (2009) Tortora C. et al. 2009, MNRAS, 396, 61
- Tortora et al. (2010a) Tortora C. et al. 2010a, MNRAS, 407, 144 (T+10)
- Tortora et al. (2010b) Tortora C. et al. 2010b, arXiv:1009.2500