Hierarchical formation of bulgeless galaxies:
Why outflows have low angular momentum.
Abstract
Using high resolution, fully cosmological smoothed particle hydro-dynamical simulations of dwarf galaxies in a cold dark matter ( CDM) Universe, we show how high redshift gas outflows can modify the baryon angular momentum distribution and allow pure disc galaxies to form. We outline how galactic outflows preferentially remove low angular momentum baryons, due a combination of a) star formation peaking at high redshift in shallow dark matter potentials, an epoch when accreted gas has relatively low angular momentum, b) the existence of an extended reservoir of high angular momentum gas in the outer disc to provide material for prolonged SF at later times and c) the tendency for outflows to follow the path of least resistance which is perpendicular to the disc. We also show that outflows are enhanced during mergers, thus expelling much of the gas which has lost its angular momentum during these events, and preventing the formation of “classical”, merger driven bulges in low mass, field galaxies. Stars formed prior to such mergers form a low surface brightness, extended stellar halo component, similar to those detected in nearby dwarfs.
keywords:
galaxy evolution-galaxy formation-cosmology.1 Introduction
The angular momentum of disc galaxies is thought to originate from tidal torques imparted by surrounding structures in the expanding Universe (Peebles, 1969; Barnes & Efstathiou, 1987), prior to proto-galactic collapse. Disc galaxies will form if gas gains a similar amount of angular momentum as the dark matter in this process, and if this angular momentum is subsequently retained as the gas cools to the centres of dark matter halos and settles into a disc (Fall & Efstathiou, 1980). Gas subsequently fragments and forms stars. Within cold dark matter (CDM) cosmology this picture of the origin of galactic angular momentum is believed to hold even as galaxies are built hierarchically, with the added assumption that mergers result in building bulge components as discs are destroyed by violent relaxation (Barnes & Hernquist, 1996).
However, detailed modelling has highlighted problems with this scenario. In simulations, gas cools to the centre of the earliest collapsing structures making them very centrally concentrated. Dynamical friction occurring during the mergers of such systems results in significant loss of angular momentum (Navarro & Steinmetz, 2000; Maller & Dekel, 2002). This problem has largely been overcome in simulations by increasingly effective recipes for feedback from supernovae (Thacker & Couchman, 2000; Stinson et al., 2006; Governato et al., 2007), and increased resolution that decrease spurious angular momentum losses (Mayer et al., 2008; Sales et al., 2010). Despite this encouraging progress, decreasing the impact of dynamic friction does not solve all the problems of galaxy formation which relate to angular momentum within hierarchical structure formation. In addition, the angular momentum distribution of baryons in real galaxies differs significantly from the distribution within dark matter halos (van den Bosch et al., 2001; Dutton & van den Bosch, 2009). Even if angular momentum were fully conserved, CDM halos have a low angular momentum tail (Bullock et al., 2001). Recent simulations show that galaxies formed in a CDM Universe have realistic disc sizes (Brooks et al., 2010), however the close coupling of dark matter and gas while acquiring their angular momentum implies that baryons should also have a substantial low angular momentum component, which is generally believed to be reflected in the bulge components (van den Bosch, 2001; Stinson et al., 2010). Yet many real galaxies have no bulge; of galaxies with stellar mass of M⊙ have a Sersic index of less than 1.5 (Dutton, 2009) and many more massive galaxies do not have classical bulges (Kormendy et al., 2010; Fisher & Drory, 2010). Pure disc structures reflect an underlying angular momentum distribution which is seemingly at odds with theories of galaxy formation within the accepted CDM paradigm (Bullock et al., 2001; van den Bosch, 2001). Furthermore, in a hierarchical CDM Universe, mergers drive gas toward the centre of DM halos, making the formation of low angular momentum bulge stars an apparently inevitable consequence. The persistence and degree of these problems means that the manner in which disc galaxies attain their angular momentum distribution has been considered one of the major long standing challenges to the CDM paradigm.
The removal of low angular momentum gas in galactic outflows is one viable solution to explain the discrepancy in angular momentum distributions between dark matter and baryons (Dekel & Silk, 1986; Binney et al., 2001) and the main focus of this work. Several lines of evidence suggest that supernova driven galactic winds are able to expel large amounts of gas from galaxies during the galaxy formation process (Mathews & Baker, 1971; Veilleux et al., 2005). Galactic winds have been observed, and extensively studied in local star forming galaxies (e.g. Lynds & Sandage 1963; Axon & Taylor 1978; Martin 1999; Ohyama 2002; Martin et al. 2005; Rupke et al. 2005), or inferred from the metallicity distribution of stellar populations in low mass galaxies (Kirby et al., 2011). Outflows are expected to be more common at high redshift where star formation is more active (Madau et al., 1996). Indeed, outflows have been detected at high redshift from Lyman-break selected galaxies (Pettini et al., 1998; Simcoe et al., 2002; Shapley et al., 2003; Adelberger et al., 2005), as well as gravitationally lensed galaxies (Pettini et al., 2000).
We recently simulated dwarf galaxies which match a wide range of observed dwarf galaxy properties, including the absence of a bulge and cored DM distribution that causes a linearly rising rotation curve with no inner “peak” (Governato et al. 2010; G10 hereafter). The simulated galaxies lie simultaneously on the Tully-Fisher relation, and the size-luminosity relation (Brooks et al., 2010). Using techniques which closely mimic observations, the galaxies have been shown to have mass distributions and stellar masses which are consistent with galaxies in the THINGS survey (Oh et al. (2010), Figure 5) of similar rotational velocity and fall on the baryonic Tully-Fisher relation, as derived by McGaugh (2005). Most importantly, the simulated dwarfs also match the distribution of angular momentum of stars observed in pure disc galaxies, differing significantly from that of the dark matter halo in which they are embedded (see Figure 4 of G10, as well as Figure 8 of this paper). These properties indicate that our simulations can provide unique insights into the acquisition and retention of angular momentum of disc galaxies. Here we provide an overview of the various interlinked processes which determine the angular momentum distribution of stars in our simulated bulgeless disc galaxy. In particular we outline why the significant amount of gas which is expelled from the galaxy is primarily low angular momentum material.
In Section 2, we review the code and the simulation initial
conditions. We present the properties of our simulated galaxy in
Section 2.1, highlighting resolution issues as well as the
effects of allowing gas to cool to dense regions before forming
stars. We plot star formation rates and outflow rates, as well as
their ratio (the “mass loading”) in Section 3. We show
that the outflows have a strong bias toward low angular momentum in
Section 4. We outline the reasons for outflows having
preferentially low angular momentum material: early accreted material
has low angular momentum, yet needs to escape a relatively low
potential well (Section 4.1); the existence of an extended
reservoir of high angular momentum gas (Section 4.2); with
outflows being perpendicular to the disc (Section 4.3). We
also show that the starburst triggered in the late merger expels the
bulk of the gas which lost its angular momentum during this event
(Section 4.4). Our summary and discussion follows in Section 5.
2 The Simulation.
At z 0 the virial mass of the halo in the dark matter only run of our simulated galaxy is 3.7 1010M⊙ (the virial mass is measured within the virial radius Rvir, the radius enclosing an overdensity of 100 times the cosmological critical density). The halo was selected within a large scale, low resolution, simulation run in a concordance, flat, -dominated cosmology: , =0.76, , , and (Spergel et al., 2003; Verde et al., 2003). We evolved the simulation using the fully parallel, N-body+smoothed particle hydro-dynamics (SPH) code GASOLINE which self consistently models gas hydrodynamics and cooling, star formation, stellar mass loss, energy feedback from supernovae, metal enrichment and gas diffusion together with structure formation within theCDM model. A detailed description of the code and of the simulations is available in the literature (Wadsley et al., 2004; Governato et al., 2010; Shen et al., 2010). The version of the code used in this study includes radiative cooling and accounts for the effect of a uniform background radiation field on the ionization and excitation state of the gas. The cosmic ultraviolet background is implemented using the Haardt-Madau model (Haardt & Madau, 1996), we use a standard cooling function for a primordial mixture of atomic hydrogen and helium at high gas temperatures, but we include the effect of metal cooling for T 104 (Bromm et al., 2001; Mashchenko et al., 2008). The possible effects of including H2 metal line cooling and SF linked to H2 abundance and some preliminary results are briefly discussed in §5.
Star formation occurs when cold gas reaches a given threshold density (Stinson et al., 2006), which is dependent on the volume of the star forming regions that can be resolved (Saitoh et al., 2008; Robertson & Kravtsov, 2008; Tasker & Bryan, 2008). We used 100 amu/cm3 in the main run analysed here. The adoption of a higher density threshold for star formation (most previous studies used 0.1amu/cm3) has the effect of limiting SF to gas clumps similar in mass to real star forming regions and of increasing drastically the amount of energy per unit mass released into the gas directly affected by supernova feedback. This higher threshold is justified by the high mass and spatial resolution of this run that allow individual star forming regions to be resolved. Star formation then proceeds at a rate proportional to , i.e. locally enforcing a Schmidt law. The adopted feedback scheme is implemented by releasing thermal energy from supernovae into the gas surrounding each star particle (Stinson et al., 2006). The energy release rate is tied to the time of formation of each particle (which effectively ages as a single stellar population with a Kroupa IMF). To model the effect of feedback at unresolved scales, the affected gas has its cooling shut off for a time scale proportional to the Sedov solution of the blastwave equation, which is set by the local density and temperature of the gas and the amount of energy involved. In the main run described in this study this translates into regions of 150 to 400 pc in radius being heated by feedback from multiple, overlapping supernovae, and having their cooling shut off for typically 5-10 million years. However, even during high z starbursts only a few percent of the gas in the disc plane is heated by supernova feedback to temperatures 40,000 K. The effect of feedback is to regulate star formation efficiency as a function of mass (Brooks et al., 2007). Only two other parameters are needed, the star formation efficiency (SF = 0.1) and the fraction of supernova energy coupled to the inter stellar medium (ISM) (eSN = 0.4). Similar values have been used in previous works by this group (Governato et al., 2007). However, here we slightly increased SF from 0.05 to 0.1 to ensure a better normalization to the local Schmidt law. We explored values of eSN as high as 0.6 and cooling shutoff times changing by a factor of a few to verify that results are robust to small changes in the description of SF.
2.1 The Galaxy: Resolution and Cosmic Variance
The simulation presented here is part of an ongoing campaign to study the formation and evolution of galaxies in a CDM cosmology. Recent work has highlighted the role of numerical resolution in driving the structural properties of simulated galaxies and specifically their internal mass distribution (Mayer et al., 2008; Governato et al., 2010). We analysed the simulated galaxy used in this study at different resolutions and showed that our key results are retained at high resolution regimes, which have spatial resolution less than pc and gas particle mass less than a few M⊙ (G10). Yet we emphasise the importance of resolving star forming regions by allowing gas to collapse to high density regions during these merger events. For example a high SF threshold DG1MR forms about 3108 M⊙ in stars. This relatively low star formation efficiency leads to an Mstars/Mhalo ratio of 1/200, which is close to what is measured for nearby small galaxies with resolved kinematics and photometry (Oh et al., 2010). On the other hand a 0.1 amu/cm3 threshold allows eight times more stars to form (see G10, online material). Adopting high resolution significantly decreases SF also in halos with mass 1011 M⊙ (Governato et al, in prep, Mayer et al in prep), reducing the overproduction of stars (Brooks et al., 2010) and bringing them close to estimates for more massive galaxies (Guo et al., 2010) that predict Mstars/Mhalo 0.04-0.05. The importance of resolving star forming regions was also demonstrated by the results from a constrained merger simulation done by Teyssier et al. (2010). The more localised star formation within an inhomogeneous inter stellar medium is crucial in our model in terms of allowing large scale outflows to be generated (G10).


From the simulation we generated frequent outputs in order to
determine outflow rates and the properties of the gas prior to being
blown out. To this end, we use DG1MR from G10, which has outputs every
Myrs, and has an effective resolution particles in
a 25 Mpc box, with gravitation softening of 110pc and initial
stellar mass of M⊙. The morphology (that of a
bulgeless dwarf irregular galaxy), star formation rate, final stellar
and baryon fraction, MHI/LB, rotation velocity, magnitude and
color show little change between DG1 and DG1MR. These properties
contrast significantly compared to the same simulation run with a low
threshold for star formation (DG1LT), which does not generate large
scale outflows. Details of the properties of the galaxies DG1, DG1MR
and DG1LT using techniques which mimic observations were presented in
G10. DG1MR has M, ,
MM⊙, scalelength Rkpc,
rotational velocity Vkms-1, and ratio of neutral hydrogen to B-band luminosity MHI/L.
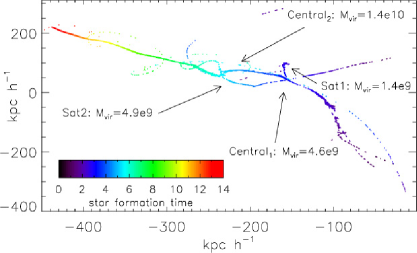
Bulges are commonly asserted to be formed in mergers, with galaxies which have more mergers, or mergers with larger mass ratios, assumed to have larger bulges (e.g. Barnes & Hernquist 1996; Hopkins et al. 2010). In CDM cosmologies, merger histories of low mass galaxies are equally as diverse and rich as high mass galaxies, yet it is only in low mass field galaxies where bulgeless discs are common (Dutton, 2009) (dwarf satellites often have spheroidal morphologies e.g. Mayer et al. 2001). To validate the CDM model, simulations should form low mass field galaxies with low B/D ratios and rising rotation curves starting from most realizations of cosmological initial conditions. It is important to highlight that the success of our analysed galaxy is not a result of a particular, special merging history. We showed in G10 the results of two simulations which had very different merging histories, highlighting that we have not selected a particularly quiescent simulated galaxy. In Figure 1, we plot a type of merger tree for the simulation analysed in this study, which shows the birth position within the simulation box of every star which ends up in the final galaxy at z=0. We are tracing the birth of stars as the galaxy falls through the simulation box. The axes are the x and y co-ordinates of the simulation box, shown in co-moving kpc. The colors are the birth time of stars. We see in this plot the merger events which involve satellites which are large enough to host stars. Two significant merger events in particular can be seen at Gyrs and Gyrs. Prior to merging, Sat1 has a virial mass of M⊙, gas mass of M⊙ and stellar mass of M⊙, with the central galaxy having virial mass of M⊙, gas mass of M⊙ and stellar mass of M⊙ at a corresponding time. Also evident are the passages of Sat2 around the central galaxy and hence its merging period which extends for Gyrs between Grys and final coalescence at Gyrs . Prior to merging, Sat2 has a virial mass of M⊙, gas mass of M⊙ and stellar mass of M⊙, while the central galaxy has virial mass of M⊙, gas mass of M⊙ and stellar mass of M⊙ at a corresponding time.
3 Star Formation and Outflows
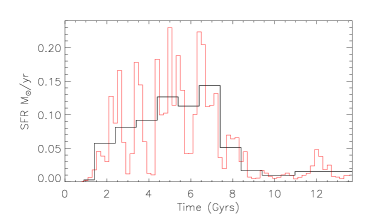
In Figure 2 we plot the star formation rate as a function of time for our simulated galaxy. In red, we show the star formation using 200 Myr bins. The bursty nature of star formation is apparent. The black line shows 1 Gyr bins, to allow a better match to the time resolution we have for our outflows in subsequent plots. Star formation shows bursts, some of which are associated with mergers, with a high star formation rate at Gyrs associated with Sat1, and then peaks again at Gyrs. This final increase in the star formation rate is associated with the last major merger (Sat2), which has a mass ratio of . Subsequent to the end of this merger, the star formation rate decreases significantly, and is quite low for the final Gyrs but continues to be bursty.

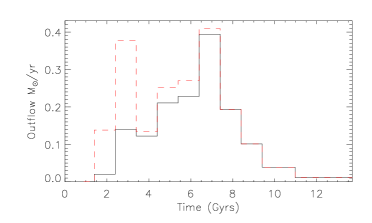
The outflow rate, in M, is shown in Figure 3. The black line shows the outflows from the central galaxy. The red dashed line adds outflows from the two most significant satellites accreted during the galaxy’s evolution, marked Sat1 and Sat2 in Figure 1. Outflows are calculated in a very simple manner: any gas which is bound and within at any output timestep, but is outside of the final galaxy at , is assumed to have been expelled, where is the radial distance to the furthest young star (age Myrs) from the centre of the galaxy. Typically, is . Our results are not sensitive to this choice, so long as the radius is well beyond the star forming region which means that we do not miss gas which is being expelled, and is not too close to , which can result in gas which is not bound being falsely identified as outflows. We only include gas which does not return to the galaxy at later times in our definition of outflows in this study. Using 28 outputs which are Myrs apart, each outflow particle is traced through every output to find the maximum “jump” in radial distance from the centre. The jump in radius is invariably associated with a temperature that shows that the gas particle was heated by supernova energy. The time of the radial and temperature jump determines the outflow time for the particle.
We note that the degree and direction of outflows in our simulation is not directly imposed, as in other feedback schemes (e.g Springel & Hernquist 2003; Oppenheimer & Davé 2006), but occur naturally due to thermal pressure exerted on gas in our formulation of supernova feedback.
The general shape of the outflows histogram is similar to the star formation rate, including a particularly prominent peak in outflows during the coalescence of the last major merger event at time Gyrs . This correspondence between a merger induced starburst and subsequent outflows is discussed in Section 4.4.
The ratio of the outflows from the central galaxy to the star formation rate is called the “mass loading” or the “loading factor”. The log of the ratio of the outflows from the central galaxy to the star formation rate is shown in Figure 4 (squares). The mean mass loading from the central galaxy throughout the simulated galaxy’s evolution is 2.3, with a significant increase associated with the merger at Gyrs. We will see that a high mass loading is a crucial ingredient that determines the final angular momentum content of our simulated galaxy. In Figure 4 we also show the mass loading of the outflows from the major satellite, Sat2 (crosses), which merges to the central galaxy at . This highlights that outflows also occur from the satellites which are massive enough to from stars. From here on, we analyse properties of outflows from the central galaxy, or main progenitor, at each time and simply refer to “outflows”.
In Figure 5 we plot the cumulative mass of such identified outflows as a function of circular velocity at the time of expulsion. It is apparent that significant amounts of gas is expelled while the galaxy is still relatively low mass, but that the galaxy continues to accrete material and grow. To highlight this, we plot the evolution of the ratio of outflows to the total mass of the galaxy (Mfrac) in Figure 6. This plot shows a peak in the fraction of mass being ejected at early times, between Gyrs, when the potential of the proto galaxy is relatively low and the outflow rate is high. A subsequent steady decline in Mfrac is halted only during the last merger at Gyrs, during which large outflows occur.
4 Selective removal of low angular momentum in outflows
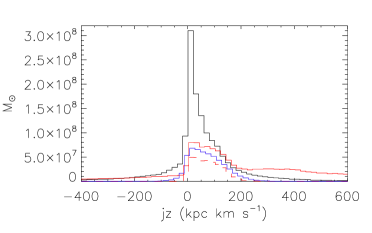
As a consequence of the strong outflows 70% of the baryons are expelled by winds during the galaxy’s evolution, and there is a significant bias toward low angular momentum in the expelled gas. Figure 7 compares the distribution of gas which has been ejected in outflows (black line) to the distribution of all baryons within the virial radius of the galaxy at , showing gas (red), HI gas (red dashed), and stars (blue). Here, is the component of the angular momentum whose vector is perpendicular to the disc. The angular momentum of the outflowing gas is determined at the timestep prior to its heating and ejection from the central galaxy. The shape of the angular momentum distribution of the ejected material differs strongly from the material which makes up the galaxy at . The outflow comprises a large low angular momentum peak. The outflows also display a significant tail of negative angular momentum material. By contrast, the warm/hot gas in the galaxy at contains high angular momentum material, while the cold (HI) gas and stars have very little negative angular momentum material and relatively little low angular momentum material. We note that a very similar result occurs when total angular momentum is plotted, which we omit for brevity.
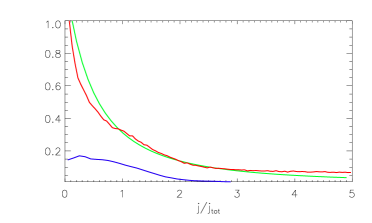
In order to make a more direct link to observations, Figure 8 shows the angular momentum distribution, , for “observable” baryons, defined as a combination of stars and cold (HI) gas in order to mimic van den Bosch et al. (2001), who plot such a distribution for several observed galaxies. Here, is the mean angular momentum of these “observable” baryons, and the angular momentum is derived using , where is the radius and the circular velocity. We also plot the distribution of all baryons as they would be in the absence of outflows (red line). That is to say, the distribution of outflows, as measured just prior to the time of ejection, plus all baryons within the virial radius at . This distribution is also normalised by the same of the disc baryons, in order to allow direct comparison with the blue line which represents the distribution of observable baryons. A very different distribution is apparent between what is observed at , and the total baryonic component in absence of outflows. In particular a large amount of low angular momentum gas is present due to the expelled low angular momentum gas, as well as a high angular momentum tail of warm/hot gas.
Also shown on this plot is the distribution of angular momentum, normalised by the mean angular momentum, for a typical dark matter halo, as characterised in Bullock et al. (2001) and used in van den Bosch et al. (2001). The total baryons which would have been in the galaxy in the absence of outflows (red line) have a very similar shape to this distribution, although we note that the normalization, , that we used was the mean angular momentum of the disc baryons. Normalising by the mean of the total angular momentum of baryons which would have been in the galaxy at would shift the distribution to the left. Nevertheless, the shape of the distribution of all baryons which would have been in the galaxy in the absence of outflows, and that of dark matter halos, are remarkably similar, highlighting the role that outflows play in causing the distribution of observed baryons to differ so sharply from their host halos.
We now identify the processes which result in the strong bias toward low angular momentum of outflows that we have identified. In combination they result in the ejection of low angular momentum material and a significant alteration of the angular distribution of baryons, and in particular the distribution of stars and cold (HI) gas within galaxies compared to their host dark matter halos.
4.1 Early accreted material has low angular momentum.
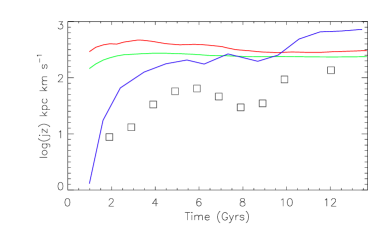
Material which falls into the central regions of proto-galaxies at the earliest times has been subjected to the least amount of torquing from the large scale structure (Ryden, 1988; Quinn & Binney, 1992). Material falling in at later times has higher angular momentum. This results in early outflows having less angular momentum than later outflows, and introduces a bias whereby low angular momentum material is preferentially expelled. Figure 9 shows the evolution of of outflows (squares), calculated at the time of ejection, as well as the inflows (blue line) at a corresponding time. Also shown is the evolution of for the baryons (red line) and dark matter (green line) which end up in the galaxy at . A similar plot results when total angular momentum is plotted in this manner. The central galaxy, or main progenitor, is used as a reference frame at all times, and as we stated above, outflows are those ejected from the central galaxy, while inflows, described below, are also to the central galaxy.
After spinning up, the dark matter material which ends in the galaxy at essentially retains its angular momentum. The baryons which end up in the galaxy at have also retained their angular momentum. At the early times, it is low angular momentum material that has been accreted and is hence available for blow out and this is reflected in the very low angular momentum of material which is ejected at early times. Only gas which has been accreted can be ejected, so a large bias is clear between ejected gas and the gas which will end up in the galaxy at . The low star formation rates and relatively high blowout rates (i.e. the high mass loading, see Figure 4) means that a large fraction of low angular momentum material is not forming stars. As outer, high angular momentum shells of gas are accreted, they make up a larger fraction of the angular momentum distribution of gas than they would if none of the earlier accreted gas were expelled. This naturally alters the distribution of gas angular momentum compared with dark matter. Low star formation efficiency and high gas fractions mean that blown out gas has preferentially low angular momentum.
The blue line traces the angular momentum of inflowing gas at each time. We define inflowing material as gas which has reached for the first time, in order to make a fair comparison with the outflowing material as we have defined it (recall that is the radial distance to the furthest young star from the centre of the galaxy at each time). Clearly, inflowing gas has significantly higher angular momentum than the outflows at all times. At late times, the inflowing material has higher angular momentum than the mean of all gas which is within the virial radius at , reflecting the fact that later accreted material has high angular momentum.
Lower potential wells at early times favour higher blowout rates, at a time when lower angular momentum material is being accreted.
4.2 Extended reservoir of high angular momentum material.
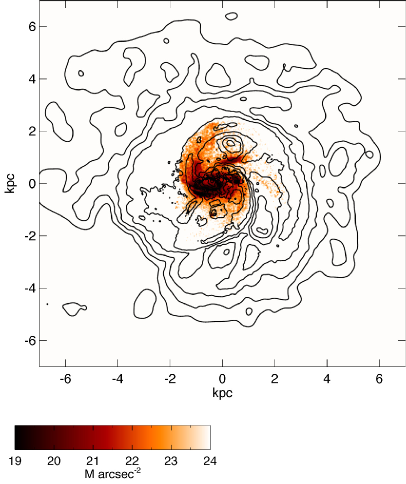
Star formation only occurs in the inner regions of the galaxy where the gas reaches sufficiently high densities. Extended HI gas discs are found around local isolated low mass galaxies (Broeils & Rhee, 1997). Such low mass, isolated galaxies have gas dominating their baryonic mass fractions, with values typically above , and as high as (Schombert et al., 2001; Geha et al., 2006) There is evidence that extended HI discs occur in intermediate (Puech et al., 2010) and high redshift galaxies (Daddi et al., 2010). Further, there is evidence for the existence of warm/hot gas in the halos of disc galaxies (Spitzer, 1956; Spitzer & Jenkins, 1975; Sembach et al., 2003). In our simulations, gas beyond the star formation region serves as a repository of high angular momentum material. Typically, between 30% and 40% of gas within the virial radius of our simulated galaxy lies within the star forming region at a given time. Figure 10 shows the face-on B-band surface brightness map of the galaxy at , over plotted by an HI contour map. The extent of the star forming region, from which outflows are driven, is reflected in the B-band map, while the extended nature of the HI is evident. At this time, 47% of all gas is beyond the star forming region. Gas within the star forming region has average specific angular momentum of kpc kms-1 while gas beyond the star forming region has kpc kms-1. Looking at just the HI gas at this time, 20% of HI is beyond the star forming region, and has kpc kms-1. Gas which gains energy directly from supernovae thus has relatively low angular momentum, so simply modelling this gas which is within the star forming regions as being blown out will preferentially remove low angular momentum gas.
4.3 Outflows perpendicular to the disc.
Our simulations, as well as observations of outflows, indicate that as gas is expelled, it can also entrain gas which is in outer regions of the galaxy, and sweep it out with the outflows (Stewart et al., 2000; Schwartz & Martin, 2004; Veilleux et al., 2005). The relative importance of these two modes of outflow are not well constrained. Direct expulsion from inner regions appears to be the dominant mode (Bland-Hawthorn et al., 2007), and is also the main mechanism of gas removal in our simulations. Here we show that that, consistent with observations (Heckman et al., 1987; Bland & Tully, 1988; Shopbell & Bland-Hawthorn, 1998; Veilleux & Rupke, 2002; Bland-Hawthorn et al., 2007) and other theoretical models (Mac Low & Ferrara, 1999; Pieri et al., 2007), the outflows from the central regions are preferentially perpendicular to the plane of the disc.
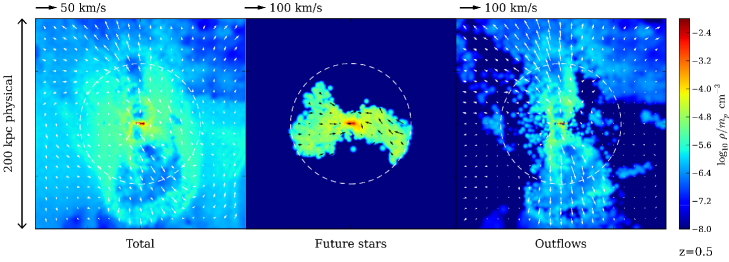
Figure 11 shows the direction of gas flows from our galaxy at , when a minor starburst occurs. The color gas density map shows the edge on view of the galaxy, with velocity vectors overplotted showing the direction and magnitude of the gas velocity. The virial radius is marked by a dashed white line. The right hand panel shows the outflows, and reveals that they follow the path of least resistance perpendicular to the disc. These outflows thus preferentially entrain material in regions which are perpendicular to the disc. The highest angular momentum material, which is in the extended gas disc surrounding the star forming regions, is the least affected by the outflows. We measure a low value for the mean angular momentum in the plane of the disc of this material which is identified as outflows, with kpc kms-1, while total angular momentum is high, kpc kms-1, as the material is getting driven to large radii, perpendicular to the plane, at high velocities. Here, we have used .
By contrast, gas which feeds star formation falls on the galaxy from a direction which is in the plane of the disc, and away from the outflows. The central panel of Figure 11 shows the edge on galaxy, again at , but this time only gas which will form stars by is plotted, again with vectors indicating the velocity of the gas. The gas which feeds star formation is clearly shown to flow primarily from the plane of the disc. This gas has a relatively high planar angular momentum, kpc kms-1, which is a large fraction of this material’s total angular momentum kpc kms-1. This contrasts to the outflowing material, but also to gas which is in the galaxy at this time and which remains in the galaxy as gas at , i.e. material which is neither being ejected nor feeding star formation. Such “retained” gas has kpc kms-1, with total angular momentum, kpc kms-1.
4.4 What about mergers?
One of the characteristic features of CDM cosmologies is the merger of galaxies. This process is ubiquitous, and essentially scale free (e.g. Cole et al. 2000; Fakhouri et al. 2010), meaning that low mass field galaxies which preferentially become discs dominated will have in general similar merging histories as high mass galaxies, which have bulges and may be dominated by spheroidal star systems. Mergers are widely expected to result in bulges. In earlier simulations of galaxy formation which suffered from overcooling, proto-galaxies rapidly formed central baryonic concentrations through dynamical friction (Navarro & White, 1994) This problem was exacerbated in low resolution simulations, which have denser central regions (Mayer et al., 2008). As explained above, feedback from supernovae prevents a dense bulge forming in the central regions of the proto-galaxies in these current simulations. Further, as demonstrated in Stewart et al. (2009), direct accretion of stars is insignificant in low mass galaxies, whose mergers are dominated by gas. The stars which are accreted in the mergers, tend to get thrown into high energy orbits during the interaction, meaning that the resulting spheroid is not centrally concentrated. A diffuse stellar halo rather than centrally concentrated bulge results from the scrambled trajectories of stars during the late major merger in our simulation. Indeed, at z=0, our simulated galaxy has an old (mean age 10.3 Gyrs), diffuse stellar spheroidal component which comprises only of the stellar mass of the simulated galaxy, even though it has no bulge. This is consistent with observed low mass galaxies in all environments which have old, dim spheroidal stellar populations in addition to their main body of stars (Vansevičius et al., 2004; Hidalgo et al., 2009; Stinson et al., 2009).
Simulations, (Governato et al., 2009; Hopkins et al., 2009) showed that, when mergers are gas rich and feedback is present, bulges can be as little as 10% of the resulting galaxy. In such gas rich mergers, no strong bar forms to drive gas to the central regions. Our simulated galaxy has a rich merger history including a merger with mass ratio of 3:1 which has a final coalescence . All mergers are gas rich, with gas to stellar mass ratio above one for all progenitors of our simulated galaxy. Several reasons ensure that a bulge does not form during these mergers. Firstly, only the inner cold gas is subject to being driven to the centre during the mergers. The surrounding gas is not affected, but we know that inner gas has preferentially low angular momentum. Secondly, in our simulation as in Hopkins et al. (2009), a bar does not form in gas dominated mergers, limiting the amount of gas driven toward the centre.
Thirdly, and most importantly, the feedback from the small fraction of such gas which forms stars in a burst expels a large fraction of the gas which has lost its angular momentum and has been driven toward the centre of the galaxy, as reflected in the high mass loading during this merging epoch, shown in Figure 4. This is clear from the dip in the line traced by squares in Figure 9, which indicates that the material which loses angular momentum material is removed during the merger. Star formation is primarily occurring in the very inner regions of the merging galaxies, and hence it is coupled to the very material that has lost angular momentum which is being blown out. The effective coupling of SF with large scale supernova driven outflows during merger induced star bursts is well supported observationally (Martin, 1999; Bland-Hawthorn et al., 2007) and is the extra ingredient in our models which allow us to form bulgeless merger remnants.
5 Discussion
In our simulated dwarf galaxies, we are able to resolve the process of energy injected from multiple overlapping supernovae, which occur in star forming regions coupled to dense gas. The thermal energy injected into the surrounding gas creates pressure, and is modelled to undergo a blastwave phase which drives galactic winds. We emphasise that neither degree nor direction of galactic winds are enforced a priori within our supernova feedback scheme. It is necessary for the spatial resolution to be significantly less than the scale length of the disc to capture these effects (Colín et al., 2010). More gas is expelled from our simulated galaxies than forms stars by , up to 70% of the original cosmic fraction. Yet, similar to observed isolated dwarfs (Geha et al., 2006), they remain gas dominated at all times, due to the continued cooling of gas into the disc and the low star formation rate. We have previously shown that our model results in simulated dwarf galaxies which match multiple properties of observed dwarf galaxies (Governato et al. 2010; Oh et al. 2010; Brooks et al. 2010). Future and ongoing work will include metal lines cooling at all temperatures, H2 cooling and its formation and destruction, and SF linked to the local H2 fraction (Booth et al., 2007; Robertson & Kravtsov, 2008; Gnedin et al., 2009). Preliminary results show that the high density SF threshold adopted here closely mimics the distribution of SF in simulations where SF is allowed only in gas with a high fraction of H2 (Christensen et al, in prep). The additional cooling by metals and H2 is counterbalanced by an increase in the SN efficiency (Pontzen et al, in prep). None of these details of localised star formation affect the galaxy scale processes which are highlighted in this current study. Here, we have outlined the reasons that the galactic winds in our simulated galaxies are strongly biased toward expelling low angular momentum gas. We identified the interlinked processes responsible for such bias, which naturally occur when feedback is effectively modelled in a hierarchically assembled galaxy in a CDM Universe, namely:
-
•
Low angular momentum material is accreted and rapidly expelled early, when SF peaks
-
•
A low potential at early times favours early gas ejection.
-
•
Later accreted material has higher angular momentum and forms a disc.
These ideas are similarly outlined by Dekel & Silk (1986); Binney et al. (2001), where a notion of expelling gas early is invoked to explain the angular momentum of disc galaxies. Early ejection of material is also postulated in recent models of Dutton & van den Bosch (2009) to explain the mass distribution of disc galaxies.
-
•
A reservoir of high angular momentum material exists beyond the star forming regions.
Disc galaxies have extended HI discs (Broeils & Rhee, 1997), as well as warm/hot gas in the halo (Spitzer, 1956; Spitzer & Jenkins, 1975; Sembach et al., 2003). These act as reservoirs of high angular momentum gas, which are beyond the star formation radius and thus not subject to being directly expelled from the galaxy.
-
•
Outflows occur perpendicular to the disc, entraining relatively low angular momentum material and preventing infall of material from regions above and below the disc plane.
Observations strongly indicate that galactic winds expel material perpendicular to galactic discs (Heckman et al., 1987; Shopbell & Bland-Hawthorn, 1998; Veilleux & Rupke, 2002; Bland-Hawthorn et al., 2007), as predicted by theory (Mac Low & Ferrara, 1999; Pieri et al., 2007). Gas which builds the disc at late times is accreted from regions that are relatively aligned to the disc plane.
-
•
Mergers or instabilities which cause gas to lose angular momentum trigger star bursts which expel most of this low angular momentum gas.
Star burst galaxies are generally associated with mergers, and are observed to have significant outflows (Heckman et al., 1990; Griffiths et al., 2000; Veilleux et al., 2005) in local galaxies and at high redshift (Pettini et al., 2000; Nestor et al., 2010), predominately driven from the inner starburst regions (Chevalier & Clegg, 1985; Strickland & Heckman, 2007), ensuring that it is the very material that has lost angular momentum during the merger which is being expelled. High velocity outflows from post-starburst galaxies are also observed at high redshift (Tremonti et al., 2007). The high mass loading in these events prevents large amounts of stars being formed from this material which had been driven toward the galaxy’s inner regions. Feedback from central black holes/Active Galactic Nuclei (AGN) would also aid in expelling material which has lost angular momentum and has been driven to the central regions. There is evidence to suggest that such feedback is directed perpendicular to the disc (Irwin & Sofue, 1992; Su et al., 2010), enhancing the processes outlined in this study.
-
•
A diffuse stellar halo rather than a centrally concentrated bulge results from the scrambled trajectories of stars during the late major merger in our simulation.
The stellar rather than gas component of mergers between progenitors which are massive enough to contain stars themselves, but which do not themselves have bulges, result in a diffuse halo component.
By expelling large amounts of preferentially low angular momentum gas from the galaxy, particularly at early times and during merger events, the shape of the angular momentum distribution of baryons is altered significantly from that of their parent dark matter halos. This allows the formation of bulgeless disc galaxies. Future work is needed to see if the same processes (possibly in conjunction with black hole/AGN related feedback which also emanates from central regions and thus expels low angular momentum gas) is able to explain the suppression of bulges in more massive halos and the formation of bright disc galaxies with small classical bulges (Kormendy et al., 2010; Peebles & Nusser, 2010).
Acknowledgments
CB and BKG acknowledge the support of the UKs Science & Technology Facilities Council (STFC Grant ST/F002432/1). CB and GS thank the DEISA consortium, co-funded through EU FP6 project RI-031513 and the FP7 project RI-222919 for support within the DEISA Extreme Comput- ing InitativeFG, and TQ were supported by NSF ITR grant PHY- 0205413. FG acknowledges support from a Theodore Dunham grant, HST GO-1125, NSF grant AST-0607819 and NASA ATP NNX08AG84G. AB acknowledges support from the Sherman Fairchild Foundation. Simulations were run at TACC, ARSC, and NAS. We acknowledge the computa- tional support provided by the UK s National Cosmology Supercomputer, COSMOS.
References
- Adelberger et al. (2005) Adelberger K. L., Shapley A. E., Steidel C. C., Pettini M., Erb D. K., Reddy N. A., 2005, ApJ, 629, 636
- Axon & Taylor (1978) Axon D. J., Taylor K., 1978, Nature, 274, 37
- Barnes & Efstathiou (1987) Barnes J., Efstathiou G., 1987, ApJ, 319, 575
- Barnes & Hernquist (1996) Barnes J. E., Hernquist L., 1996, ApJ, 471, 115
- Binney et al. (2001) Binney J., Gerhard O., Silk J., 2001, MNRAS, 321, 471
- Bland & Tully (1988) Bland J., Tully B., 1988, Nature, 334, 43
- Bland-Hawthorn et al. (2007) Bland-Hawthorn J., Veilleux S., Cecil G., 2007, Ap&SS, 311, 87
- Booth et al. (2007) Booth C. M., Theuns T., Okamoto T., 2007, MNRAS, 376, 1588
- Broeils & Rhee (1997) Broeils A. H., Rhee M., 1997, AAP, 324, 877
- Bromm et al. (2001) Bromm V., Ferrara A., Coppi P. S., Larson R. B., 2001, MNRAS, 328, 969
- Brooks et al. (2010) Brooks A., Solomon A., Governato F., McCleary J., MacArthur L., Brook C., Jonsson P., Quinn T., Wadsley J., 2010, ArXiv e-prints
- Brooks et al. (2007) Brooks A. M., Governato F., Booth C. M., Willman B., Gardner J. P., Wadsley J., Stinson G., Quinn T., 2007, ApJl, 655, L17
- Bullock et al. (2001) Bullock J. S., Kolatt T. S., Sigad Y., Somerville R. S., Kravtsov A. V., Klypin A. A., Primack J. R., Dekel A., 2001, MNRAS, 321, 559
- Chevalier & Clegg (1985) Chevalier R. A., Clegg A. W., 1985, Nature, 317, 44
- Cole et al. (2000) Cole S., Lacey C. G., Baugh C. M., Frenk C. S., 2000, MNRAS, 319, 168
- Colín et al. (2010) Colín P., Avila-Reese V., Vázquez-Semadeni E., Valenzuela O., Ceverino D., 2010, ApJ, 713, 535
- Daddi et al. (2010) Daddi E., Bournaud F., Walter F., Dannerbauer H., Carilli C. L., Dickinson M., Elbaz D., Morrison G. E., Riechers D., Onodera M., Salmi F., Krips M., Stern D., 2010, ApJ, 713, 686
- Dekel & Silk (1986) Dekel A., Silk J., 1986, ApJ, 303, 39
- Dutton (2009) Dutton A. A., 2009, MNRAS, 396, 121
- Dutton & van den Bosch (2009) Dutton A. A., van den Bosch F. C., 2009, MNRAS, 396, 141
- Fakhouri et al. (2010) Fakhouri O., Ma C., Boylan-Kolchin M., 2010, MNRAS, pp 857–+
- Fall & Efstathiou (1980) Fall S. M., Efstathiou G., 1980, MNRAS, 193, 189
- Fisher & Drory (2010) Fisher D. B., Drory N., 2010, ApJ, 716, 942
- Geha et al. (2006) Geha M., Blanton M. R., Masjedi M., West A. A., 2006, ApJ, 653, 240
- Gnedin et al. (2009) Gnedin N. Y., Tassis K., Kravtsov A. V., 2009, ApJ, 697, 55
- Governato et al. (2010) Governato F., Brook C., Mayer L., Brooks A., Rhee G., Wadsley J., Jonsson P., Willman B., Stinson G., Quinn T., Madau P., 2010, Nature, 463, 203
- Governato et al. (2009) Governato F., Brook C. B., Brooks A. M., Mayer L., Willman B., Jonsson P., Stilp A. M., Pope L., Christensen C., Wadsley J., Quinn T., 2009, MNRAS, 398, 312
- Governato et al. (2007) Governato F., Willman B., Mayer L., Brooks A., Stinson G., Valenzuela O., Wadsley J., Quinn T., 2007, MNRAS, 374, 1479
- Griffiths et al. (2000) Griffiths R. E., Ptak A., Feigelson E. D., Garmire G., Townsley L., Brandt W. N., Sambruna R., Bregman J. N., 2000, Science, 290, 1325
- Guo et al. (2010) Guo Q., White S., Li C., Boylan-Kolchin M., 2010, MNRAS, 404, 1111
- Haardt & Madau (1996) Haardt F., Madau P., 1996, ApJ, 461, 20
- Heckman et al. (1987) Heckman T. M., Armus L., Miley G. K., 1987, AJ, 93, 276
- Heckman et al. (1990) Heckman T. M., Armus L., Miley G. K., 1990, ApJS, 74, 833
- Hidalgo et al. (2009) Hidalgo S. L., Aparicio A., Martínez-Delgado D., Gallart C., 2009, ApJ, 705, 704
- Hopkins et al. (2010) Hopkins P. F., Bundy K., Croton D., Hernquist L., Keres D., Khochfar S., Stewart K., Wetzel A., Younger J. D., 2010, ApJ, 715, 202
- Hopkins et al. (2009) Hopkins P. F., Somerville R. S., Cox T. J., Hernquist L., Jogee S., Kereš D., Ma C., Robertson B., Stewart K., 2009, MNRAS, 397, 802
- Irwin & Sofue (1992) Irwin J. A., Sofue Y., 1992, ApJL, 396, L75
- Kirby et al. (2011) Kirby E. N., Lanfranchi G. A., Simon J. D., Cohen J. G., Guhathakurta P., 2011, ApJ, 727, 78
- Kormendy et al. (2010) Kormendy J., Drory N., Bender R., Cornell M. E., 2010, ApJ, 723, 54
- Lynds & Sandage (1963) Lynds C. R., Sandage A. R., 1963, ApJ, 137, 1005
- Mac Low & Ferrara (1999) Mac Low M., Ferrara A., 1999, ApJ, 513, 142
- Madau et al. (1996) Madau P., Ferguson H. C., Dickinson M. E., Giavalisco M., Steidel C. C., Fruchter A., 1996, MNRAS, 283, 1388
- Maller & Dekel (2002) Maller A. H., Dekel A., 2002, MNRAS, 335, 487
- Martin (1999) Martin C. L., 1999, ApJ, 513, 156
- Martin et al. (2005) Martin D. C., Fanson J., Schiminovich D. e. a., 2005, ApJl, 619, L1
- Mashchenko et al. (2008) Mashchenko S., Wadsley J., Couchman H. M. P., 2008, Science, 319, 174
- Mathews & Baker (1971) Mathews W. G., Baker J. C., 1971, ApJ, 170, 241
- Mayer et al. (2001) Mayer L., Governato F., Colpi M., Moore B., Quinn T., Wadsley J., Stadel J., Lake G., 2001, ApJ, 559, 754
- Mayer et al. (2008) Mayer L., Governato F., Kaufmann T., 2008, ArXiv e-prints, 801
- McGaugh (2005) McGaugh S. S., 2005, ApJ, 632, 859
- Navarro & Steinmetz (2000) Navarro J. F., Steinmetz M., 2000, ApJ, 538, 477
- Navarro & White (1994) Navarro J. F., White S. D. M., 1994, MNRAS, 267, 401
- Nestor et al. (2010) Nestor D. B., Johnson B. D., Wild V., Ménard B., Turnshek D. A., Rao S., Pettini M., 2010, ArXiv e-prints
- Oh et al. (2010) Oh S.-H., Brook C., Governato F., Brinks E., de Bloc E., Mayer L. Quinn T., Madau P., 2010, in prep
- Ohyama (2002) Ohyama Y. e. a., 2002, PASJ, 54, 891
- Oppenheimer & Davé (2006) Oppenheimer B. D., Davé R., 2006, MNRAS, 373, 1265
- Peebles (1969) Peebles P. J. E., 1969, ApJ, 155, 393
- Peebles & Nusser (2010) Peebles P. J. E., Nusser A., 2010, Nature, 465, 565
- Pettini et al. (1998) Pettini M., Kellogg M., Steidel C. C., Dickinson M., Adelberger K. L., Giavalisco M., 1998, ApJ, 508, 539
- Pettini et al. (2000) Pettini M., Steidel C. C., Adelberger K. L., Dickinson M., Giavalisco M., 2000, ApJ, 528, 96
- Pieri et al. (2007) Pieri M. M., Martel H., Grenon C., 2007, ApJ, 658, 36
- Puech et al. (2010) Puech M., Hammer F., Flores H., Delgado-Serrano R., Rodrigues M., Yang Y., 2010, AAP, 510, A68+
- Quinn & Binney (1992) Quinn T., Binney J., 1992, MNRAS, 255, 729
- Robertson & Kravtsov (2008) Robertson B. E., Kravtsov A. V., 2008, ApJ, 680, 1083
- Rupke et al. (2005) Rupke D. S., Veilleux S., Sanders D. B., 2005, ApJS, 160, 115
- Ryden (1988) Ryden B. S., 1988, ApJ, 329, 589
- Saitoh et al. (2008) Saitoh T. R., Daisaka H., Kokubo E., Makino J., Okamoto T., Tomisaka K., Wada K., Yoshida N., 2008, PASJ, 60, 667
- Sales et al. (2010) Sales L. V., Navarro J. F., Schaye J., Dalla Vecchia C., Springel V., Booth C. M., 2010, ArXiv e-prints
- Schombert et al. (2001) Schombert J. M., McGaugh S. S., Eder J. A., 2001, AJ, 121, 2420
- Schwartz & Martin (2004) Schwartz C. M., Martin C. L., 2004, ApJ, 610, 201
- Sembach et al. (2003) Sembach K. R., Wakker B. P., Savage B. D., Richter P., Meade M., Shull J. M., Jenkins E. B., Sonneborn G., Moos H. W., 2003, ApJS, 146, 165
- Shapley et al. (2003) Shapley A. E., Steidel C. C., Pettini M., Adelberger K. L., 2003, ApJ, 588, 65
- Shen et al. (2010) Shen S., Wadsley J., Stinson G., 2010, MNRAS, 407, 1581
- Shopbell & Bland-Hawthorn (1998) Shopbell P. L., Bland-Hawthorn J., 1998, ApJ, 493, 129
- Simcoe et al. (2002) Simcoe R. A., Sargent W. L. W., Rauch M., 2002, ApJ, 578, 737
- Spergel et al. (2003) Spergel D. N., Verde L., Peiris H. V., Komatsu E., Nolta M. R., Bennett C. L., Halpern M., Hinshaw G., Jarosik N., Kogut A., Limon M., Meyer S. S., Page L., Tucker G. S., Weiland J. L., Wollack E., Wright E. L., 2003, ApJs, 148, 175
- Spitzer (1956) Spitzer Jr. L., 1956, ApJ, 124, 20
- Spitzer & Jenkins (1975) Spitzer Jr. L., Jenkins E. B., 1975, ARAA, 13, 133
- Springel & Hernquist (2003) Springel V., Hernquist L., 2003, MNRAS, 339, 312
- Stewart et al. (2009) Stewart K. R., Bullock J. S., Wechsler R. H., Maller A. H., 2009, ApJ, 702, 307
- Stewart et al. (2000) Stewart S. G., Fanelli M. N., Byrd G. G., Hill J. K., Westpfahl D. J., Cheng K., O’Connell R. W., Roberts M. S., Neff S. G., Smith A. M., Stecher T. P., 2000, ApJ, 529, 201
- Stinson et al. (2006) Stinson G., Seth A., Katz N., Wadsley J., Governato F., Quinn T., 2006, MNRAS, 373, 1074
- Stinson et al. (2010) Stinson G. S., Bailin J., Couchman H., Wadsley J., Shen S., Nickerson S., Brook C., Quinn T., 2010, MNRAS, 408, 812
- Stinson et al. (2009) Stinson G. S., Dalcanton J. J., Quinn T., Gogarten S. M., Kaufmann T., Wadsley J., 2009, MNRAS, 395, 1455
- Strickland & Heckman (2007) Strickland D. K., Heckman T. M., 2007, ApJ, 658, 258
- Su et al. (2010) Su M., Slatyer T. R., Finkbeiner D. P., 2010, ApJ, 724, 1044
- Tasker & Bryan (2008) Tasker E. J., Bryan G. L., 2008, ApJ, 673, 810
- Teyssier et al. (2010) Teyssier R., Chapon D., Bournaud F., 2010, ArXiv e-prints
- Thacker & Couchman (2000) Thacker R. J., Couchman H. M. P., 2000, ApJ, 545, 728
- Tremonti et al. (2007) Tremonti C. A., Moustakas J., Diamond-Stanic A. M., 2007, ApJL, 663, L77
- van den Bosch (2001) van den Bosch F. C., 2001, MNRAS, 327, 1334
- van den Bosch et al. (2001) van den Bosch F. C., Burkert A., Swaters R. A., 2001, MNRAS, 326, 1205
- Vansevičius et al. (2004) Vansevičius V., Arimoto N., Hasegawa T., Ikuta C., Jablonka P., Narbutis D., Ohta K., Stonkutė R., Tamura N., Vansevičius V., Yamada Y., 2004, ApJL, 611, L93
- Veilleux et al. (2005) Veilleux S., Cecil G., Bland-Hawthorn J., 2005, ARAA, 43, 769
- Veilleux & Rupke (2002) Veilleux S., Rupke D. S., 2002, ApJL, 565, L63
- Verde et al. (2003) Verde L., Peiris H. V., Spergel D. N., Nolta M. R., Bennett C. L., Halpern M., Hinshaw G., Jarosik N., Kogut A., Limon M., Meyer S. S., Page L., Tucker G. S., Wollack E., Wright E. L., 2003, ApJs, 148, 195
- Wadsley et al. (2004) Wadsley J. W., Stadel J., Quinn T., 2004, New Astronomy, 9, 137