Damping of dHvA oscillations and vortex-lattice disorder in the peak-effect region of strong type-II superconductors
Abstract
The phenomenon of magnetic quantum oscillations in the superconducting state poses several questions that still defy satisfactory answers. A key controversial issue concerns the additional damping observed in the vortex state. Here, we show results of SR, dHvA, and SQUID magnetization measurements on borocarbide superconductors, indicating that a sharp drop observed in the dHvA amplitude just below is correlated with enhanced disorder of the vortex lattice in the peak-effect region, which significantly enhances quasiparticle scattering by the pair potential.
pacs:
74.25.Ha, 74.25.Uv, 74.70.DdThe recent observations of Shubnikov–de Haas (SdH) and de Haas–van Alphen (dHvA) oscillations in high-temperature copper-oxide superconductors Jaudet08 have drawn increasing attention to magnetic quantum oscillations (MQO) as a key technique for investigating the superconducting (SC) states of these materials at high magnetic fields. However, the usefulness of these studies depends crucially on the existence of a reliable quantitative theory for MQO in the vortex state of strong type-II superconductors, a theory which does not exist today even for conventional type-II superconductors Maniv01 . The demanding situation involved in developing such a theory may be illustrated by the extensive investigations performed on the nonmagnetic borocarbide superconductors YNi2B2C, and LuNi2B2C Terashima97 ; Isshiki08 ; Maniv06 ; Bergk09 . Terashima et al. Terashima97 applied the field-modulation technique to YNi2B2C, finding a strong suppression of the dHvA amplitude just below the entrance to the SC state, followed by a recovery of the signal at slightly lower fields, and a very smooth additional damping over a large field range below the SC transition. The small region of strong additional damping was found to correlate with that of a significant peak observed in the measured magnetization (the so-called peak-effect, PE). Remarkable persistence of the dHvA signal deep in the vortex state of LuNi2B2C has also been reported by Isshiki et al. Isshiki08 .
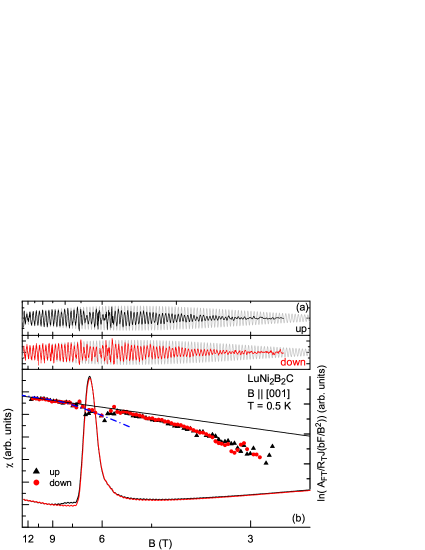
Similarly, large additional damping of the dHvA signal, coinciding with the onset of the PE, was recently observed in YNi2B2C by employing the cantilever torque technique Maniv06 , with the signal persisting at significantly lower fields (down to 3 T). Finally, in a series of dHvA measurements, carried out very recently on LuNi2B2C by the field-modulation technique Bergk09 , the salient features reported for YNi2B2C Terashima97 ; Maniv06 have been confirmed (Fig. 1).
The current theoretical approaches to MQO in the vortex state Maniv01 do not provide a consistent predictive framework for a quantitative interpretation of the intriguing experimental results. The mean-field theories based on a detailed exposition of the quasi-particle excitations obtained by solving the corresponding Bogoliubov–de Gennes equations for an ordered vortex lattice Dukan94 ; Norman95 ; Kita02 , provide deep insight into fine features of the Landau band structure, but lose their transparency very quickly and become heavily numerical at early stages of the analysis. A simple formula for the additional damping Maki91 , used frequently in the literature, has been shown to be essentially valid only in the limiting case of a random vortex distribution Maniv01 . The resulting additional damping rate of MQO seriously overestimates the rate calculated numerically (see Fig. 8 in Ref. Kita02 ) for an Abrikosov vortex lattice.
This may indicate that enhanced quasi-particle scattering by the SC pair-potential due to strong disorder of the vortex lattice in the PE region is responsible for the enhanced additional damping reported in Refs. Terashima97 ; Maniv06 ; Bergk09 . However, as proposed in Ref. Terashima97 , an increased ”phase-smearing” effect, i.e., broadening of Landau levels by the inhomogeneity of the internal magnetic field associated with displaced flux lines by random pinning centers, might also be responsible for the enhanced damping in the PE region.
In the present paper it is shown, by means of SR and complementary SQUID magnetization measurements, that phase smearing is much too small to account for the enhanced additional damping. It is also found that strong disorder of the vortex lattice, revealed by characteristic change of the SR line shape, is correlated with the strong suppression of the dHvA signal in the PE region, whereas the establishment of a well-ordered vortex lattice well below the PE region closely follows the weak additional damping of the dHvA signal, observed in this broad field-range. Both findings strongly support a scenario whereby quasiparticle scattering is enhanced by the disorder of the vortex lattice.
High-quality single crystals of LuNi2B2C and YNi2B2C were prepared by the flux-growth technique at Ames Laboratory, USA Can98 , and by the zone-melting method at the IFW Dresden, Germany Behr99 , respectively. The SQUID magnetization measurements were performed at the Dresden High Magnetic Field Laboratory, Germany, while the SR experiments were carried out at TRIUMF, Vancouver, Canada. The dHvA data exploited in the comparative analysis was extracted from previouse measurements employing the field-modulation technique on LuNi2B2C at K Bergk09 . A detailed discussion of their dHvA signal in the normal state and the electronic band structure is given in Ref. Bergk08 . Note, that due to technical reasons the SR measurements were carried out on samples similar (but not identical) to the ones where the dHvA effect was measured. Furthermore, it is not currently feasible to carry out SR measurements below 2 K in fields above 5 T. Thus, in order to allow cross-correlation between dHvA and SR measurements, the magnetization was also measured using a SQUID magnetometer on the same samples and at the same temperatures as employed in the SR experiments.
Transverse-field (TF) SR measurements up to 7 T were carried out on the M15 muon beam line at TRIUMF using the HiTime spectrometer, which consists of muon and positron detectors contained within a standard He-flow cryostat. The external field was directed parallel to the c-axis of each crystal. A fast Fourier transform (FFT) of the TF-SR signal closely resembles the internal magnetic-field distribution S13 . The measurements were typically done by cooling the sample in a fixed field to a temperature between 2 and 3 K, and then measuring the field dependence of the TF-SR signal. Specifically, measurements were performed on the LuNi2B2C single crystal after field-cooling in 3 and 7 T, and on YNi2B2C after field-cooling in 0.5 and 3 T. Several temperature-dependent measurements were also made. In addition, measurements were performed on each sample above at 20 K to visualize the broadening of the TF-SR line shape by nuclear moments and the field inhomogeneity of the external magnet.
A typical result from a series of systematic dHvA measurements on the flux-grown LuNi2B2C crystal Bergk09 is shown in Fig. 1 for field parallel to the c-axis. The drop seen in the Dingle plot of the dHvA signal (originating from the spherical Fermi surface Bergk08 ) just below the SC transition is nicely correlated with the PE seen in the magnetization envelope. This feature and the weak additional attenuation of the dHvA signal seen below the PE region, essentially agree with the results reported for YNi2B2C in Refs. Terashima97 ; Maniv06 . One should note that the extraction of the dHvA signal at the PE region is somewhat ambiguous, since a reliable determination of the non-oscillating PE background signal is challenging. In our analysis the background signal was subtracted by fitting suitable polynomials to different sections of the raw-data signal. The Dingle data was generated using step-by-step Fourier transforms over 3 oscillations. The corresponding error bar of the amplitude in the PE range is about 15 percent, ensuring our observation of a significant additional damping there. For other field orientations somewhat different damping of the dHvA signals at the PE region was found (see e.g. Fig. 7 in Ref. Bergk09 ).
The upper panel of Fig. 2 shows FFTs of the measured SR signals for LuNi2B2C, after field cooling to K in T, and the corresponding probability field distribution, , obtained by deconvoluting each FFT curve with respect to the (practically Gaussian) reference signal. The onset of a large broadening of and its reversed skewness in a small field range around T are apparent. The dramatic skewness reversal of the line shape is illustrated in the lower panel of Fig. 2, where the skewness parameter , with S13 is plotted for the various distribution functions. Note, that a negative is due to the presence of short-range triplet correlation in the absence of long-range order, characterizing a vortex-glass phase Menon . Thus, the onset of negative (around 5 T in Fig. 2) just below the PE region (Fig. 3) indicates that the vortex lattice is disordered in the entire PE region. Remarkably, the sharp change of is seen to correlate with the appearance of the PE and the additional damping of the dHvA oscillation shown in Fig. 1. The positive values of near unity in a broad field range below the PE reflect the occurrence of a well-ordered vortex lattice in this region, which is seen to correlate with the weak additional damping of the dHvA signal. One should be aware, however, of the kinetic nature of the PE, which is reflected by the history dependence of the measured SR data. For example, field-cooling in T followed by an increase in field to T results in a line shape with a negative (see Fig.2), whereas field-cooling in T followed by a reduction of the field to T results in a positive (not shown).
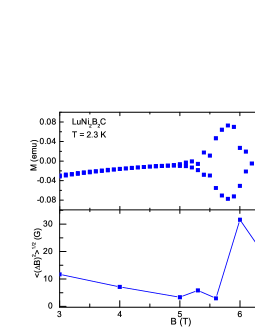
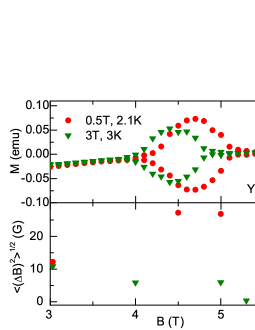
Finally, our isothermal SQUID magnetization measurements, performed on both LuNi2B2C and YNi2B2C samples, are shown in Figs. 3 and 4, respectively. The magnetization data around the PE regions are plotted together with the width of the TF-SR line shapes. The sharp maximum in the SR line-width, shown for both LuNi2B2C (Fig. 3) and YNi2B2C (Fig. 4), closely follows the PE in the corresponding magnetization curve. However, the magnitude and field range of the PE strongly depend on temperature. Consequently, the significant difference between TF-SR line widths observed after field-cooling in T to K and after field-cooling in T to K, are primarily due to temperature.
Summarizing our experimental results, significant line broadening and reversed skewness have been observed in SR measurements, both correlated with the observation of a PE and an enhanced damping of the dHvA oscillations. The origin of this remarkable correlation is most probably due to enhanced pinning-induced vortex-lattice disorder. However, the enhanced field inhomogeneity observed in the PE region, approximately 30 G (maximal field distribution width in the PE) in both LuNi2B2C and YNi2B2C (Figs.3,4), seems to be too small to attribute the additional damping of the dHvA amplitude to further broadening of the Landau levels by magnetic-field inhomogeneity.
The following analysis establishes this conclusion: Imagine a charged quasiparticle (with an effective mass ) moving freely in a two-dimensional spatial field profile , consisting of a large uniform part , plus a small nonuniform part . The distribution of is assumed to be completely random, so that its ensemble average is . The Landau-level width, , at the Fermi energy, , corresponding to the unperturbed cyclotron frequency, , due to the inhomogeneous broadening, is given in the semiclassical limit, , by Aronov95 : where . For a random vortex distribution near the correlation length is of the order of the minimal (magnetic) length, , and , with , so that:
| (1) |
The damping of the dHvA amplitude associated with the Landau-level broadening described above can be estimated from the Dingle factor: . This may be compared with the extra damping factor due to direct scattering of a quasiparticle by the pair potential in the random vortex distribution limit Maniv01 ; Maki91 , which takes the form:
| (2) |
where , and is the self-consistent Ginzburg–Landau expression for the amplitude of the SC order parameter. At the PE field position: , i.e., T, with T (at about 3 K), we find , so that combining Eq. (1) with Eq. (2) one has:
| (3) |
The Dingle plot obtained from Eq. (2), modified by thermal fluctuations Maniv06 , for reasonable values of the adjustable parameters and Bergk09 , is shown in Fig. 1 to agree well with the experimental Dingle plot in the PE region. Thus, Eq.(3) implies that the additional damping rate associated with the enhanced field inhomogeneity observed in the PE region is at least two orders of magnitude smaller than the observed damping rate shown in Fig. 1.
The above estimate indicates that in order to reasonably account for the striking drop observed in the dHvA amplitude at the PE region one should invoke the direct influence of the SC pair potential on the fermionic quasiparticles under quantizing magnetic field, rather than the indirect effect through the magnetic-field inhomogeneity induced by the SC currents. Within this interpretation the observed recovery of the dHvA signal below the PE region, shown in Fig. 1, is explained by the reduced additional damping of the dHvA amplitude in the Abrikosov vortex lattice Maniv01 ; Kita02 , as compared to that predicted for the random vortex distribution Maniv01 .
This research was supported by the Israel Science Foundation Grant No. 425/07, by Posnansky Research fund in superconductivity, and by EuroMagNET under the EU contract No. 228043. J. E. Sonier acknowledges support from the Natural Sciences and Engineering Research Council of Canada. Work at the Ames Laboratory was supported by the Department of Energy, Basic Energy Sciences under Contract No. DE-AC02-07CH11358.
This article is dedicated to the memory of Tal Maniv, our beloved son and grandson.
References
- (1) C. Jaudet et al., Phys. Rev. Lett. 100, 187005 (2008).
- (2) T. Maniv, V. Zhuravlev, I. D. Vagner, and P. Wyder, Rev. Mod. Phys. 73, 867 (2001).
- (3) T. Terashima et al., Phys. Rev. B 56, 5120, (1997).
- (4) T. Isshiki et al., Phys. Rev. B 78, 134528 (2008).
- (5) T. Maniv et al., Phys. Rev. B 73, 134521 (2006).
- (6) B. Bergk and J. Wosnitza, Low Temp. Phys. 35, 687 (2009).
- (7) S. Dukan and Z. Tesanovic, Phys. Rev. B 49, 13017 (1994); ibid Phys. Rev. Lett. 74, 2311 (1995).
- (8) M. R. Norman, A.H. MacDonald, and H. Akera, Phys. Rev. B 51, 5927 (1995); ibid 54, 4239 (1996).
- (9) K. Yasui and T. Kita, Phys. Rev. B 66, 184516 (2002).
- (10) K. Maki, Phys. Rev. B 44, 2861 (1991).
- (11) P.C. Canfield, P.L. Gammel and D.J. Bishop, Phys. Today, 51(10), 40 (1998).
- (12) G. Behr et al., J. Cryst. Growth 198/199, 642 (1999).
- (13) B. Bergk et al., Phys. Rev. Lett. 100, 257004 (2008).
- (14) J.E. Sonier, J.H. Brewer, and R.F. Kiefl, Rev. Mod. Phys. 724, 769 (2000).
- (15) G. I. Menon et al., Phys. Rev. Lett. 97, 177004 (2006).
- (16) Aronov et al., Europhys. Lett. 29, 239 (1995).