Evidence for a maximum jet efficiency for the most powerful radio galaxies
Abstract
We use new mid-infrared (mid-IR) photometry from the Spitzer Space Telescope to study the relations between low-frequency radio luminosity density , mid-IR (m rest-frame) luminosity , and optical-emission-line ([OII]) luminosity , for a complete sample of radio galaxies from the 3CRR, 6CE, 6C*, 7CRS and TOOT00 surveys. The narrow redshift span of our sample () means that it is unbiased to evolutionary effects. We find evidence that these three quantities are positively correlated. The scaling between and is similar to that seen in other AGN samples, consistent with both and tracing accretion rate. We show that the positive correlation between and implies that there is a genuine lack of objects with low values of at high values of . Given that traces accretion rate, while traces jet power, this can be understood in terms of a minimum accretion rate being necessary to produce a given jet power. This implies that there is a maximum efficiency with which accreted energy can be chanelled into jet power and that this efficiency is of order unity.
keywords:
galaxies: active - galaxies: jets - infrared: galaxies - radio continuum: galaxies - quasars: general - galaxies : nuclei1 Introduction
The currently most-accepted scheme for the structure of an active galactic nuclei (AGN), the unified model, consists of a supermassive black hole (SMBH), surrounded by an accretion disc and, in the same plane at larger distances, an axisymmetric distribution of gas and dust, usually referred to as a torus. Within the inner region of the obscuring torus lies an ensemble of highly ionized and dense gas clouds, where broad emission lines are produced, the broad line region (BLR). Outside the torus there is a region of low-ionization less dense gas clouds, the narrow line region (NLR) (e.g. Antonucci 1993, Urry & Padovani 1995).
The dust present in the putative obscuring torus blocks most radiation from the inner photoionizing source at optical, UV and soft X-ray wavelengths, but it is responsible for most of the AGN emission at mid-IR frequencies (e.g. Antonucci & Miller 1985, Blanco et al. 1990, Dopita et al. 1998, Tristram et al. 2007). The dust in the torus absorbs and re-radiates the emission from the core at these frequencies. Thus, mid-IR observations, for example those probing rest-frame wavelengths around 12 m, indirectly reveal radiation from regions close to the active nucleus. This is supported by observations that show the mid- to far-IR continuum emitted by powerful radio galaxies to be mainly due to AGN heating of circumnuclear dust (e.g. Dicken et al. 2009).
According to the most widely accepted model for the archetype structure of an AGN, in the accretion disc, and potentially in regions connected to the event horizon of the black hole itself, magnetized inflowing material enables processes capable of driving two opposed collimated outflows, known as the jets (e.g. Longair et al. 1973, Blandford & Konigl 1979, Meier et al. 2001). These jets push magnetised material out of the central region and feed lobes. The acceleration of ultrarelativistic charged particles produces synchrotron radiation, visible mainly at radio frequencies (e.g. Jones et al. 1974). Therefore, the radio luminosity due to jets is inherently related to the central engine that powers the AGN.
One of the most prominent features in the optical spectrum of an AGN is the [OII] emission line. It is produced in a very low density ionized medium, such as the NLR, when thermal photoelectrons collide with oxygen atoms and excite their lower energy levels. Even though de-excitation through downward radiation has a very low probability, in such a low density medium, collisions are much more sparse, so the downward radiation results in the emission of this forbidden-line. Since the BLR can be obscured by the dusty torus, depending on the galaxy’s orientation, and the NLR is always visible, [OII] is a good tracer of the underlying continuum emission in an AGN (e.g. Hes et al. 1993), although other narrow lines, e.g. [OIII], may be better [Simpson, 1998].
It is now well established that there is a correlation between the luminosity of the NLR and the radio luminosity for radio-loud objects and that this relation is independent of redshift (e.g. Rawlings & Saunders 1991, Willott et al. 1999). This supports the idea that the physical process behind radio jets is intrinsically linked to the source of the narrow lines via a common central engine (an accreting SMBH).
In this paper we explore these ideas further by showing how rest-frame luminosity, , as a probe of warm dust emission, correlates with , a tracer of jet power, and with , which we assume tracks the underlying continuum emission of the AGN.
Throughout this paper we adopt the following values for the cosmological parameters: , and . We use the convention .
2 Sample definition
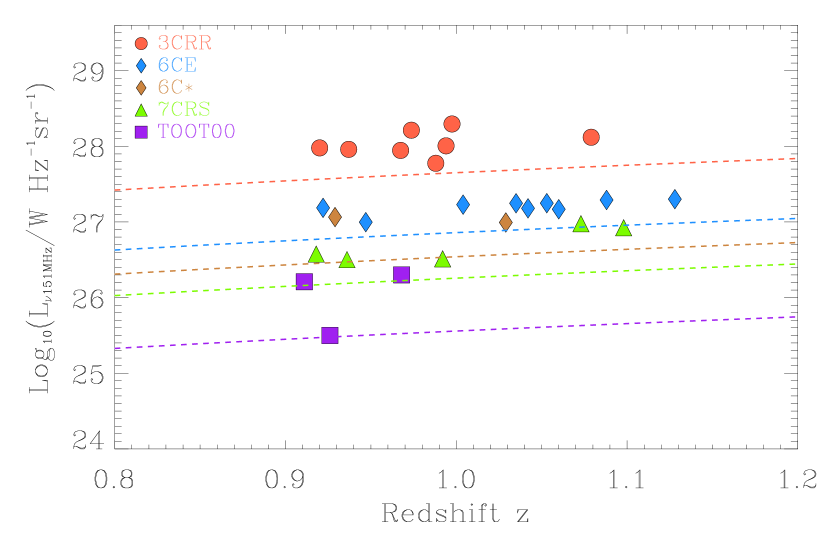
We select all of the narrow-line radio galaxies from the complete low-frequency selected radio samples 3CRR [Laing et al., 1983], 6CE [Eales et al., 1997, Rawlings et al., 2001], 6C* ( Blundell et al. 1998, Jarvis et al. 2001a,b), 7CRS [Lacy et al., 1999, Willott et al., 2003], and TOOT00 [Hill & Rawlings, 2003, Vardoulaki et al., 2009] surveys by requiring a narrow redshift span of . The low selection frequency of these samples (either 178 or 151 MHz) ensures that they are selected based on their optically thin lobe emission and thus in an orientation independent way. The narrow-line selection ensures that we are not including Blazars or type-I AGN, although 3C343 has since been classified as a QSO (Cleary et al. 2007). Assembling together galaxies from the different radio surveys, allows a wide range of radio luminosities () to be covered. At the same time, such a narrow width in redshift allows us to study correlations independent of possible evolutionary effects and any issues with assumed k-corrections. In the local Universe there is not enough cosmic volume to gather a reasonable number of luminous sources, whereas at high redshifts there are no statistically complete samples for the low flux limits that distant luminous sources require to be observed, therefore was chosen as a reasonable compromise. The span of our sample in the redshift–radio luminosity plane is shown in Figure 1.
Most of the radio galaxies in our sample are classified as FRIIs, i.e. they are brightest at the edges of the radio structure. The only exception is 3C343, which is core dominated and has since been identified as a quasar [Cleary et al., 2007], and 6CE1217+37 and 5C7.242, both of which could be classified as either an FRI or FRII.
3 Observations
The observations presented in this paper were made with the Multiband Imaging Photometer for Spitzer (MIPS) camera on the Spitzer Space Telescope which provides long-wavelength capability, under the programme ID30344 (PI. Jarvis). Our observations were carried out between August 2006 and August 2007. Our objects are relatively bright and short exposures were sufficient. For the quasars we observed for one cycle using 7 jitters of 10 seconds, resulting in a total exposure time of 70 seconds on source. For the radio galaxies we adopted a slightly different strategy; the 3CRR sources were observed with the same strategy as the quasars (i.e. 70 second total exposure time), while the less radio luminous objects from the 6CE, 7CRS and TOOT samples were observed for two 7-jitter cycles of 10 second per jitter, resulting in 140 seconds on source, to ensure significant detections, as previous observations have shown there to be a correlation between host galaxy mass/luminosity and the radio luminosity for radio galaxies (e.g. Willott et al. 2003; McLure et al. 2004). Some of the 3C radio galaxies already had adequate data in the archive, for MIPS these include 3C22, 3C184, 3C280, 3C268.1, 3C289 and 3C343 (ID74; PI Houck) and 3C356 (ID3329; PI Stern). The data reduction was performed using the standard pipeline version S15.0.5. We measured the 24m flux densities by using an aperture diameter of 6.12 pixels and a 1.61 aperture correction, to match the procedure used by the MIPS instrument team to derive calibration factors from standard star observations. Table 1 presents a summary of the characteristics of the selected sources.
| Object | Redshift | Ref ([OII]) | Opt. Class. | |||
|---|---|---|---|---|---|---|
| ) | ) | |||||
| (1) | (2) | (3) | (4) | (5) | (6) | (7) |
| 3C280 | 0.997 | 28.29 | 38.78 | 36.04 | B00 | G |
| 3C268.1 | 0.974 | 28.21 | 37.76 | 35.54 | M88 | G |
| 3C356 | 1.079 | 28.12 | 38.51 | 35.68 | B00 | G |
| 3C184 | 0.994 | 28.01 | 37.68 | 35.89 | M95 | G |
| 3C175.1 | 0.920 | 27.98 | 37.65 | 35.93 | M88 | G |
| 3C22 | 0.937 | 27.96 | 38.88 | 35.95 | B00 | G |
| 3C289 | 0.967 | 27.95 | 38.34 | 35.57 | B00 | G |
| 3C343 | 0.988 | 27.78 | 38.67 | 35.00 | L96 | QSO |
| 6CE1256+3648 | 1.128 | 27.30 | 38.08 | 35.17 | I02 | G |
| 6CE1217+3645 | 1.088 | 27.29 | 37.40 | 34.52 | I02 | G |
| 6CE1017+3712 | 1.053 | 27.25 | 37.93 | 35.61 | I02 | G |
| 6CE0943+3958 | 1.035 | 27.25 | 38.15 | 35.45 | I02 | G |
| 6CE1257+3633 | 1.004 | 27.23 | 37.75 | 35.07 | I02 | G |
| 6CE1019+3924 | 0.922 | 27.19 | 37.25 | 35.02 | I02 | G |
| 6CE1011+3632 | 1.042 | 27.18 | 37.98 | 34.86 | I02 | G |
| 6CE1129+3710 | 1.060 | 27.17 | 37.81 | 35.49 | I02 | G |
| 6C*0128+394 | 0.929 | 27.06 | 36.87 | 34.46 | J01 | G |
| 6CE1212+3805 | 0.947 | 27.00 | 37.17 | 35.14 | R01 | G |
| 6C*0133+486 | 1.029 | 26.99 | 36.76 | 35.00 | J01 | G |
| 5C6.24 (7CRS) | 1.073 | 26.98 | 37.75 | 35.51 | W02 | G |
| 5C7.23 (7CRS) | 1.098 | 26.92 | 37.71 | 35.12 | W02 | G |
| 5C7.82 (7CRS) | 0.918 | 26.57 | 37.35 | 34.80 | W02 | G |
| 5C7.242 (7CRS) | 0.992 | 26.51 | 38.11 | 34.66 | W02 | G |
| 5C7.17 (7CRS) | 0.936 | 26.50 | 37.88 | 35.25 | W03 | G |
| TOOT00_1267 | 0.968 | 26.30 | 37.81 | 34.66 | V09 | G? |
| TOOT00_1140 | 0.911 | 26.21 | 36.85 | 33.92 | V09 | G |
| TOOT00_1066 | 0.926 | 25.50 | 37.21 | 34.69 | V09 | G |
The values were calculated from Spitzer/MIPS observations at 24 using the textbook equation (e.g. Peacock 1999):
| (1) |
where is the flux density at the observed frequency, is the luminosity density at the emitted frequency, and is the luminosity distance. Given that is very close to for this particular sample, and that at rest-frame 12 m the spectrum in is quite flat, we approximate the mid-infrared spectrum in this region to a power law with spectral index in our calculations.
The [OII] emission line flux, , values were taken from the literature and converted to luminosity (see Table 1 for references), or when only values were available, these were converted to our adopted cosmology. Despite the fact that the [OIII] narrow-emission-line may be a better tracer of the underlying continuum (Simpson 1998), at the [OII] emission-line lies in the optical part of the spectrum and is therefore available for our whole sample, whereas the [OIII] line is redshifted into the near-infrared.
4 Results
4.1 Relation between and
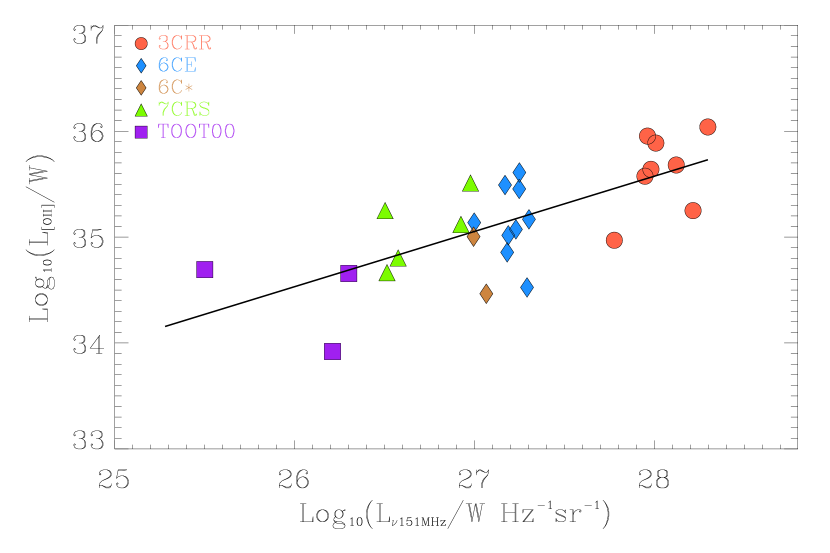
Figure 2 presents the [OII] line luminosity against low-frequency radio luminosity for the selected sample of radio galaxies. It shows that there is a positive correlation between these two quantities. The best-fitting relation is , also plotted on Figure 2. The slope and intersect of this relation and the errors associated with them were found by applying a Bayesian linear regression (e.g. Sivia 1996). The Spearman correlation coefficient is , with a 99.9% probability that the null hypothesis, i.e. that these two quantities are not correlated, can be dismissed.
This confirms previous results (Rawlings et al. 1989, Rawlings Saunders 1991, McCarthy 1993, Willott et al. 1999; Jarvis et al. 2001a) that found narrow emission-line luminosities and radio luminosities to be positively correlated. Willott et al. (1999) performed similar studies on sources from the 3CRR and 7CRS surveys that span a wide range of redshifts and found a similar relation: , with with significant uncertainties in this value as it appears to vary with the precise sub-set of objects under investigation.
The previous results typically sample objects with the highest radio luminosities at each redshift. Thus, due to volume and evolutionary effects, objects in the local Universe will have lower luminosities whereas sources at high redshifts will have higher luminosities, spreading the objects over a wide range of radio-luminosities. The complicated selection function makes it unsurprising that our sample, cleaner in the important sense that all objects have the same redshift, has a slightly different slope. In addition, in a flux limited sample, luminosity functions dictate that objects from the faint end will preferably be sampled over objects from the bright end, enforcing a steeper correlation compared to a sample that spreads over a wider range of radio luminosities.
4.2 Relation between and
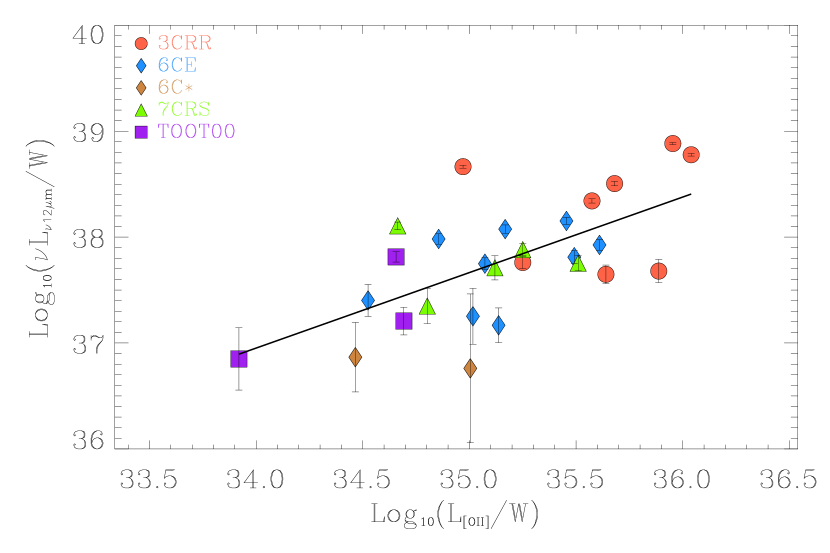
Figure 3 shows the distribution of rest-frame mid-IR (12 m) luminosity of the selected sample of galaxies with relation to [OII] luminosity. We find that these quantities are strongly correlated with the best-fitting solution for this relation . The Spearman correlation coefficient is with a Spearman rank correlation probability of 99.7%.
A previous study conducted by Dicken et al (2009), using a different sample of powerful radio sources (), also showed a tight correlation exists between the [OIII] luminosity and mid- to far-infrared (24 m and 70 m) luminosities, with the same slope value of approximately 0.71. The authors propose that since [OIII] luminositiy is a good indicator of the intrinsic AGN power (e.g. Simpson 1998), these correlations indicate that mid- to far-infrared luminosities must also be linked to the power of the active core.
Following a similar argument, our correlation between [OII] and 12 m luminosities is consistent with a view in which the central AGN is the source of radiation that excites both the NLR, ionizing its gas clouds, and the circumnuclear dust of the inner torus area, where it gets absorbed and re-emitted.
Although this correlation could naively be expected to lie closer to a proportionality, some factors are expected to cause some differences in the way 12 m and [OII] emission trace the central emission. For instance, while emission at 12 m is powered by optical-UV radiation from the accretion disc, the [OII] emission line is excited by ionizing radiation from the disc, and therefore variations of the ionization parameter with luminosity might induce a trend in the relationship. In addition, the 12 m emission is radiated from a region closer to the nucleus and thus it might not be as isotropic as [OII] emission (see e.g. Cleary et al. 2007). Also, in light of the receding torus model, the proportion between mid-IR and [OII] luminosities might vary with luminosity (as previously suggested by Dicken et al. 2009). That is, in more powerful AGN, the maximum radius at which dust sublimates is further away from the central engine, enlarging the opening angle of the ionizing cone and thus increasing the [OII] emission [e.g. Lawrence, 1991].
4.3 Relation between and
The left panel of Figure 4 shows the correlation of the mid-IR (12 m) rest-frame luminosity density against low-frequency radio luminosity density for the selected sample of radio galaxies. It is clear that more powerful radio galaxies exhibit more luminous mid-IR emission than less powerful ones. The best-fitting model for this relation is . The Spearman correlation coefficient is with a Spearman rank correlation probability of 98.8%.
Cleary et al. (2007) found a similarly strong correlation between 15 m luminosity and 178 MHz total radio luminosity for the 3CRR sample, further confirmed by Hardcastle et al. (2009) for the sources of the same survey (see also Ogle et al. 2006). By further narrowing the redshift range we show that the correlation for radio-loud AGN is still significant and it is therefore not due to an underlying correlation between redshift and luminosity.
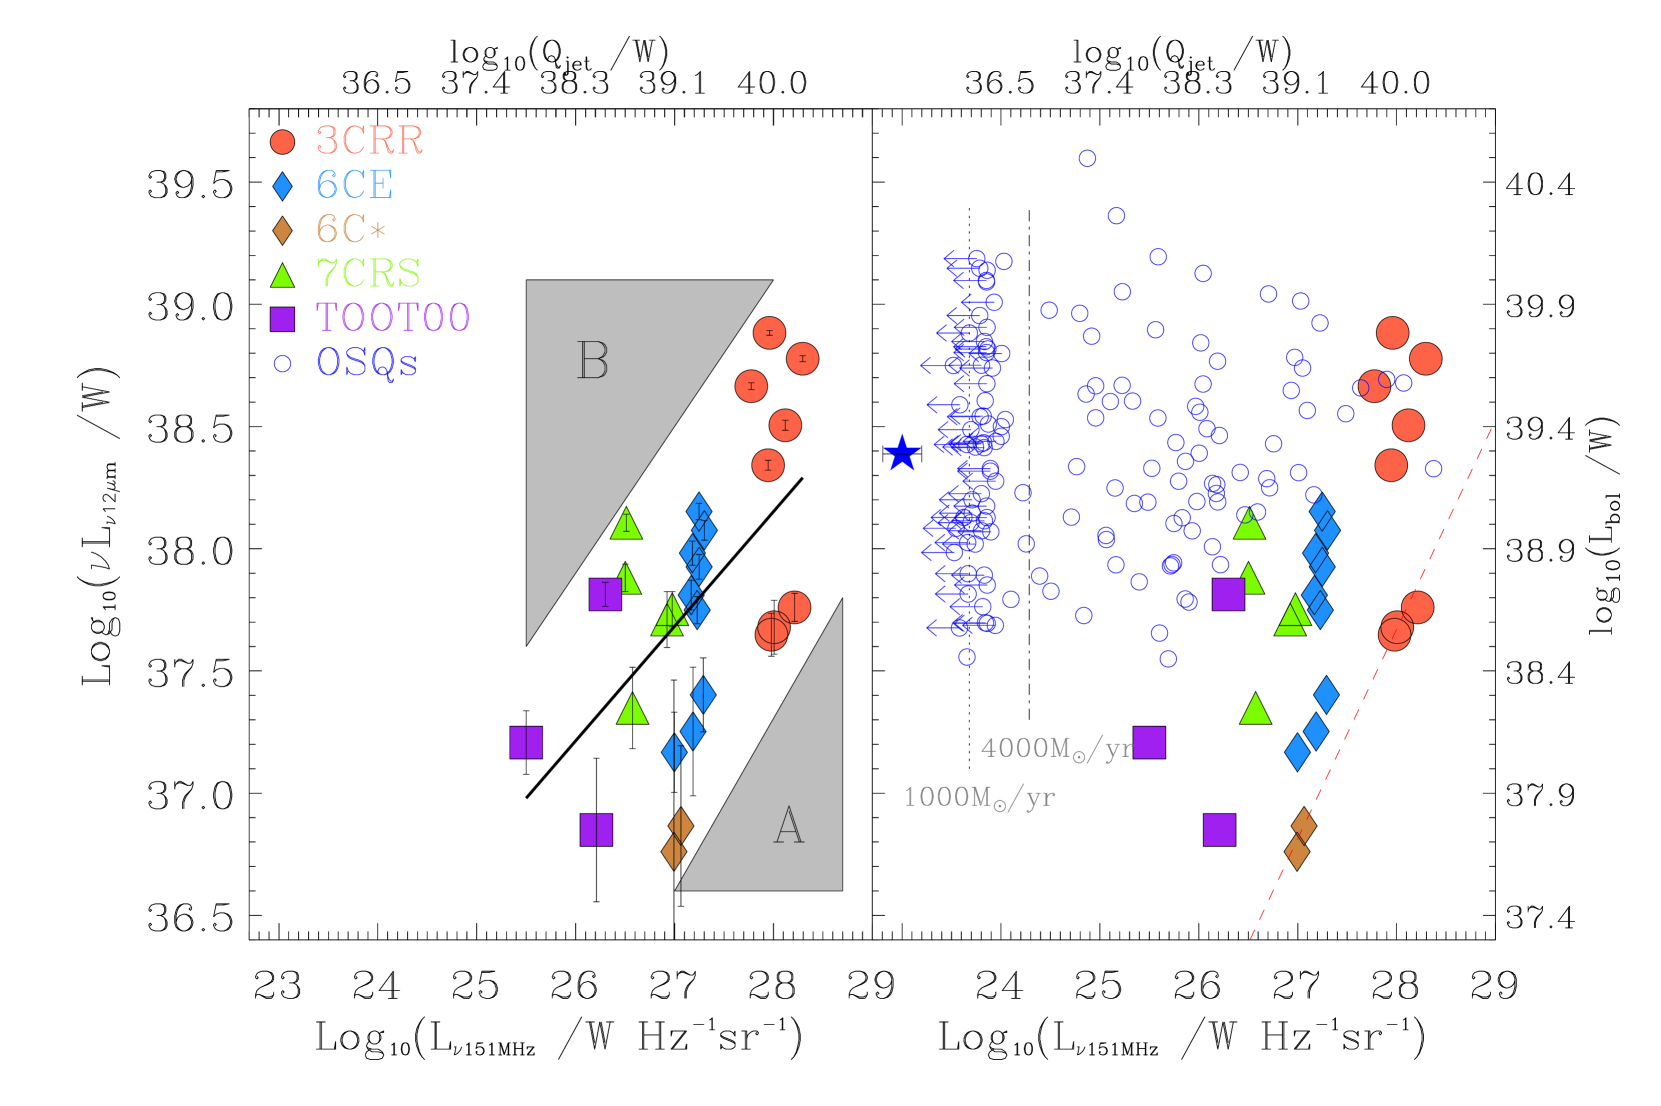
Figure 4 shows that there are two ‘gaps’ of objects in our sample: objects with high and low , and objects with high and low , respectively represented as regions “A” and “B” on the plot. We believe that region A is not an artifact of selection but a real gap. The justification for this lies on the following points: (1) The luminosity function of galaxies at all wavelengths shows that fainter objects always outnumber brighter objects and therefore we can always expect to observe more fainter objects for a given wavelength range. (2) Spitzer MIPS 24 m is sensitive enough to detect objects in that range of rest-frame 12 m luminosities but finds only objects much brighter than the 24 m flux limit. (3) 3CRR, for instance, is a full sky survey and therefore the lack of objects with lower values of is not due to insufficient area surveyed. (4) Similarly, it cannot be due to cosmic volume, as the volume surveyed is enough to detect bright objects at rest-frame 12 m. We note that Bl Lac objects could effectively populate region A, however the relativistic beaming thought to occur in Bl Lacs means that their inferred radio luminosity is not a fair indicator of the total radio emission of the object and upon accounting for this the flux would lie to the left of region A.
The situation with region B is fundamentally different. Our sample is radio selected as opposed to infrared selected so we expect objects with fainter 12 m luminosities to outnumber those with high (see point (1) above). The surveys deeper than 3CRR cover decreasingly smaller sky areas as their flux density limit decreases, thus reducing the likelihood of detecting objects with high (see points (3) and (4) above). For these reasons, the gap B of objects could be the result of selection effects.
It is therefore useful to include objects that lie outside the regime of high--selected samples, as well as objects known to be brighter in IR. For this purpose, we added a sample of bright optically selected quasars at with both radio quiet (RQQs) and radio loud quasars (RLQs), shown on the right panel of Figure 4. The optically bright quasar sample was selected from the Sloan Digital Sky Survey (SDSS) following the QSO selection criteria of Richards et al. [2004]. To pick up RQQs and RLQs, they were cross-referenced with the Very Large Array (VLA) Faint Images of the Radio Sky at Twenty-cm (FIRST) survey [Becker et al., 1995] and the Westerbork Northern Sky Survey (WENSS; Rengelink et al. 1997). The RQQs were required to be undetected by the FIRST survey at the 5 level, whereas the RLQs were hand-picked to have a low-frequency WENSS (325 MHz) flux density greater than 5 the limit of the survey. More details about the sample selection can be found in Jarvis et al. (in prep.) and Falder et al. [2010].
The full sample of objects scatter on top and to the left of our initial sample of radio galaxies. However, gap A is still present, with the radio galaxies from the original sample delimiting a lower envelope to the rest of the sample. The objects fill up gap B, indeed showing it is the result of selection effects.
Some of the objects were not detected with the FIRST survey at a level and these are represented as limits. To determine where approximately these non-detections lie, we have used a stacking analysis (yielding statistical detections) to determine that they do not lie more than about an order of magnitude away from the FIRST flux density limit. We stacked together the radio images from FIRST of all the non-detections at their known position and obtained a detection at a level. The blue filled star represents the average luminosities of the stack of all the quasars with limits.
4.4 Physical Interpretation
Radio luminosity traces the jet power and, in particular for FRIIs, Willott et al (1999) has shown that the jet power, , scales with through the relation , where represents several uncertainties associated with estimating from . We chose as this is the expectation value of a flat prior in natural space.
At the same time, the re-radiated mid-IR emission, probes the radiation emitted by the accretion disc and hence the bolometric luminosity . In turn, is directly linked to the accretion rate, , by , where is the radiative efficiency of the accretion process. Therefore, a significant correlation between and over a wide range of radio luminosities indicates that there is physical relationship between jet power and accretion rate [Rawlings & Saunders, 1991].
Indeed, if we assume the radiative efficiency to be approximately constant, with a value of (consistent with theoretical simulations, such as Beckwith et al. 2008, and observational constrains, for example Martínez-Sansigre & Taylor 2009), then the bolometric luminosity is proportional to the accretion rate, .
The fact that there is a genuine gap (gap A) of objects with high and low reveals that to achieve a given jet power, there is a minimum necessary accretion rate. If the jet power can be parameterised as a function of accretion rate by , with a jet efficiency term , then, for these powerful radio galaxies, a minimum accretion rate implies a maximum jet efficiency.
To quantify how much this maximum efficiency would be, we can use from above and apply it to the galaxies that form the lower envelope of the data points just above gap A. This yields , which, with the canonical value of , gives (see red dashed-line in Figure 4), a rather high jet efficiency. On the same line, McNamara et al. [2010], have found that for some sources , and thus . The value found is dependent on the uncertaintes of estimating from and using bolometric corrections. Therefore, parameters like can significantly alter the value of . For instance, for to , the maximim jet efficiency can span the interval . Punsly [2006, 2007] also finds that FRIIs can exist in a state with a high time-averaged ratio of or even higher, and finds theoretical solutions with a maximum time averaged ratio of . As discussed in Punsly (2007), the value of maximum jet efficiency, or, equivalently, , has important theoretical repercussions in terms of whether the jets of FRIIs are powered by the accretion disk or the black hole itself.
There is some discussion as to what is the most appropriate value for . Cavagnolo et al. (2010) use Chandra X-ray observations to compute the energy stored in X-ray cavities and estimate the jet power. They then use radio data to investigate the scaling between jet power and radio luminosity, and find a relation that has the same slope as that of Willott et al. (1999), but where an gives a relation that is two orders of magnitude below their normalisation. An seems thus more in agreement with these studies. Similarly Martínez-Sansigre & Rawlings (2010) find that a minimum of is required to fit the local radio luminosity function of galaxies. On the other hand, some studies (e.g. Croston et al. 2003, 2004) suggest that the value of should be high for FRIs and low for FRIIs, 10-20, and low for FRIIs, 1-2.
The regime at which not all radio galaxies are powerful accretors occurs at a lower radio luminosity (), as can be seen in Figure 1 of Ogle et al. [2006].
Given that is a proxy for bolometric luminosity and hence accretion rate, and traces the jet power produced by the SMBH, the very large scatter observed in the right panel of Figure 4 indicates that galaxies with similar accretion rates can produce powerful or weaker jets. Therefore the scatter is probably due to a continuous range of efficiencies with which AGN produce jets. The factors that rule this efficiency are still unclear, but black hole spin might be a dominant mechanism (e.g. see Sikora et al. 2007 and references within). Spin is indeed an appealing mechanism for it allows nominal efficiencies , since some of the jet power originates from rotation of the black hole, rather than from the accreted mass111Note, however, that high jet efficiencies involving high spins would also increase the radiative efficiency to values as high as (Bardeen 1970, Thorne 1974). (e.g. Rees 1984).
The fact that [OII] line emission luminosity is positively correlated with rest-frame luminosity implies that both quantities trace accretion rate. As is directly linked to the radiative photoionizing power, which is itself a fraction of the bolometric luminosity, , is therefore also a tracer of accretion rate.
The relation between and has similar implications as the relation between and . In fact we expect that with the inclusion of weaker radio sources, the relation between and would become less tight and probably convert into an envelope, in a similar way to what happens with the radio-loud objects for the - relation. Some studies of weaker radio sources (e.g. Best et al. 2005b; Shabala et al. 2008) indeed suggest that there is a trend for radio-quiet sources to scatter beyond the tight correlation observed for our sample of radio loud sources. This could also be related to a different accretion mechanism for the lower power radio sources (e.g. Hardcastle et al. 2006).
Some attention should be drawn to the fact that radio luminosity is not a perfect tracer of the kinetic jet power as it also depends on environmental effects irrespective of the jet power. For instance, the characteristics of the jet environment may play a significant role in how efficiently the jet power gets converted into radio luminosity. Especially in the richer environments inhabited by the strongest radio sources, a dense environment might be responsible for boosted radio luminosities at a given jet power (e.g. Barthel Arnaud 1996, Falder et al 2010). Moreover, the low frequency radio emission is radiated over scales that are orders of magnitude larger in extent than the torus and hence slower to react to any changes in the central emission than the circumnuclear dust or the NLR.
Another caveat is that superimposed on the spectrum at 10 m there is a silicate feature due to the Si-O streching mode of amorphous silicate grains of dust (e.g. Elitzur 2008). This broad feature is generally present in absorption in radio galaxies and in emission in quasars, and the tail of the feature can affect the continuum at 12 m. In addition, due to the effects of dust extinction, for the same quasars can have up to twice as high values of than radio galaxies (e.g. Martínez-Sansigre et al. 2009, Nenkova et al. 2008). These two effects could moderately bias the inferred values of by introducing a higher offset in for quasars in relation to radio galaxies. This implies that if the radio galaxies have high extinctions, their luminosity at is underestimated, and therefore is in fact higher. This would in turn bring the radio galaxies closer to the quasars, reducing the scatter of the data points on the right panel of Figure 4. Haas et al. [2008] quantify how much extinction and the silicate feature can cause the luminosity of quasars and radio galaxies to deviate from each other for wavelengths up to . They show that at these wavelengths radio galaxies can be on average 4 times less luminous than quasars due to extinction. Therefore, if the radio loud galaxies in the sample suffer high extinction (), for the whole bottom envelope would shift upwards, resulting in jet efficiency values of with . Further work on this issue will be presented in Fernandes et al. (in prep.)
One other matter of caution is the possibility of nonthermal contamination of the mid-IR emission due to synchrotron emission from the radio lobes or a core/jet component. Even though this is not a major concern for our sample as nearly all sources are FRIIs and the non-thermal contamination is in general a negligible fraction of the emitted flux density at mid-IR frequencies, when Doppler-boosted or in the case of steep-spectrum lobes lying within the Spitzer beam, synchrotron emission from contaminant components can represent a small fraction of the thermal emission (e.g. Shi et al. 2005, Cleary et al. 2007, Dicken et al. 2008). However, given the brightness and radio spectral indices of the sources in our sample this is a minimal effect.
It is an open question whether there is also a radio quiet envelope and a real gap of objects beyond this region (to the left of region B in the plot). This is difficult to infer as the contribution from stars begins to contaminate the radio emission at such low radio luminosities. For instance, a typical powerful starburst with a star formation rate of massive stars () of , equivalent to a total star formation rate of [Condon, 1992] assuming a Salpeter initial mass function, is capable of producing radio luminosity densities of the order of (vertical dotted line in Figure 4). Moreover, the most powerful starbursts observed, with a star formation rate of massive stars of the order of equivalent to a total star formation rate of , produce star-related radio luminosity densities of , of the same order as luminosities produced by weaker radio galaxies (vertical dot-dashed line in Figure 4). Deep high-resolution multi-frequency radio observations are required to cleanly distinguish AGN from purely star-forming galaxies.
5 Summary
We have studied the relations between , and for a sample of 27 radio-selected galaxies (at ), independent of evolutionary effects due to redshift, and conclude that these are positively correlated.
- A positive correlation between and confirms the previously known relation for larger samples, supporting the idea that a link exists between the origin of the radio jets and the source of the narrow lines.
- A positive correlation between and suggests that there is a common emission source that excites the gas clouds in the NLR and the circumnuclear dust. This is consistent with accretion onto the central black hole being responsible for both forms of excitation.
- A positive correlation between and indicates that radio loud AGN have a high mid-IR emission. Mid-IR emission in AGNs have a thermal component due to dust that absorbs radiation from the accretion disc and re-radiates it at these wavelengths. Assuming that the non-thermal contamination is not relevant in our sample (see discussion in Section 4.4), this correlation translates into a relationship between jet power and accretion rate, which implies a common mechanism linking these two physical properties (e.g. Rawlings & Saunders 1991).
In addition, by adding a sample of bright optically selected quasars we populated the vs plot and found that the objects span a diagonal region parallel to the correlation found for the RGs. Thus, although the strength and slope of the correlation seen in radio-selected samples is affected by selection effects, there is a real gap of objects with bright and low , which shows that for a given jet power there is a minimum accretion rate. This implies that there is a maximum efficiency with which accreted energy can be converted into jet power, and that this efficiency is of order unity.
6 Acknowledgements
We thank the anonymous referee for comments and suggestions that have greatly improved this paper. CACF is supported by the Foundation for Science and Technology (FCT-Portugal) through grant SFRH/BD/30486/2006. MJJ is supported by an RCUK fellowship. AMS is supported by an STFC post-doctoral fellowship. This work is based (in part) on observations made with the Spitzer Space Telescope, which is operated by the Jet Propulsion Laboratory, California Institute of Technology under a contract with NASA. This research has made use of the NASA/IPAC Extragalactic Database (NED) which is operated by the Jet Propulsion Laboratory, California Institute of Technology, under contract with the National Aeronautics and Space Administration.
References
- Antonucci & Miller [1985] Antonucci, R. R. J., & Miller, J. S. 1985, ApJ, 297, 621
- Antonucci [1993] Antonucci, R. 1993, ARA&A, 31, 473
- Bardeen [1970] Bardeen, J. M. 1970, Nature, 226, 64
- Barthel & Arnaud [1996] Barthel, P. D., & Arnaud, K. A. 1996, MNRAS, 283, L45
- Becker et al. [1995] Becker, R. H., White, R. L., & Helfand, D. J. 1995, ApJ, 450, 559
- Beckwith et al. [2008] Beckwith, K., Hawley, J. F., & Krolik, J. H. 2008, MNRAS, 390, 21
- Best et al. [2000] Best, P. N., Röttgering, H. J. A., & Longair, M. S. 2000, MNRAS, 311, 23
- Best et al. [2005] Best, P. N., Kauffmann, G., Heckman, T. M., Brinchmann, J., Charlot, S., Ivezić, Ž., & White, S. D. M. 2005, MNRAS, 362, 25
- Blanco et al. [1990] Blanco, P. R., Ward, M. J., & Wright, G. S. 1990, MNRAS, 242, 4P
- Blandford & Konigl [1979] Blandford, R. D., & Konigl, A. 1979, ApJ, 232, 34
- Blundell et al. [1998] Blundell, K. M., Rawlings, S., Eales, S. A., Taylor, G. B., & Bradley, A. D. 1998, MNRAS, 295, 265
- Cavagnolo et al. [2010] Cavagnolo, K. W., McNamara, B. R., Nulsen, P. E. J., Carilli, C. L., Jones, C., & Bîrzan, L. 2010, ApJ, 720, 1066
- Cleary et al. [2007] Cleary, K., Lawrence, C. R., Marshall, J. A., Hao, L., & Meier, D. 2007, ApJ, 660, 117
- Condon [1992] Condon, J. J. 1992, ARA&A, 30, 575
- Croston et al. [2003] Croston, J. H., Hardcastle, M. J., Birkinshaw, M., & Worrall, D. M. 2003, MNRAS, 346, 1041
- Croston et al. [2004] Croston, J. H., Birkinshaw, M., Hardcastle, M. J., & Worrall, D. M. 2004, MNRAS, 353, 879
- Dicken et al. [2008] Dicken, D., Tadhunter, C., Morganti, R., Buchanan, C., Oosterloo, T., & Axon, D. 2008, ApJ, 678, 712
- Dicken et al. [2009] Dicken, D., Tadhunter, C., Axon, D., Morganti, R., Inskip, K. J., Holt, J., González Delgado, R., & Groves, B. 2009, ApJ, 694, 268
- Dopita et al. [1998] Dopita, M. A., Heisler, C., Lumsden, S., & Bailey, J. 1998, ApJ, 498, 570
- Eales et al. [1997] Eales, S., Rawlings, S., Law-Green, D., Cotter, G., & Lacy, M. 1997, MNRAS, 291, 593
- Elitzur [2008] Elitzur, M. 2008, New Astronomy Review, 52, 274
- Falder et al. [2010] Falder, J. T., et al. 2010, MNRAS, 405, 347
- Haas et al. [2008] Haas, M., Willner, S. P., Heymann, F., Ashby, M. L. N., Fazio, G. G., Wilkes, B. J., Chini, R., & Siebenmorgen, R. 2008, ApJ, 688, 122
- Hardcastle et al. [2006] Hardcastle, M. J., Evans, D. A., & Croston, J. H. 2006, MNRAS, 370, 1893
- Hardcastle et al. [2009] Hardcastle, M. J., Evans, D. A., & Croston, J. H. 2009, MNRAS, 396, 1929
- Hes et al. [1993] Hes, R., Barthel, P. D., & Fosbury, R. A. E. 1993, Nature, 362, 326
- Hes et al. [1995] Hes, R., Barthel, P. D., & Hoekstra, H. 1995, A&A, 303, 8
- Hill & Rawlings [2003] Hill, G. J., & Rawlings, S. 2003, New Astronomy Review, 47, 373
- Inskip et al. [2002] Inskip, K. J., Best, P. N., Rawlings, S., Longair, M. S., Cotter, G., Röttgering, H. J. A., & Eales, S. 2002, MNRAS, 337, 1381
- Jarvis et al. [2001] Jarvis, M. J., et al. 2001, MNRAS, 326, 1563
- Jarvis et al. [2001] Jarvis, M. J., Rawlings, S., Eales, S., Blundell, K. M., Bunker, A. J., Croft, S., McLure, R. J., & Willott, C. J. 2001, MNRAS, 326, 1585
- Jones et al. [1974] Jones, T. W., O’dell, S. L., & Stein, W. A. 1974, ApJ, 192, 261
- Lacy et al. [1999] Lacy, M., Rawlings, S., Hill, G. J., Bunker, A. J., Ridgway, S. E., & Stern, D. 1999, MNRAS, 308, 1096
- Laing et al. [1983] Laing, R. A., Riley, J. M., & Longair, M. S. 1983, MNRAS, 204, 151
- Lawrence [1991] Lawrence, A. 1991, MNRAS, 252, 586
- Lawrence et al. [1996] Lawrence, C. R., Zucker, J. R., Readhead, A. C. S., Unwin, S. C., Pearson, T. J., & Xu, W. 1996, ApJS, 107, 541
- Longair et al. [1973] Longair, M. S., Ryle, M., & Scheuer, P. A. G. 1973, MNRAS, 164, 243
- Martínez-Sansigre et al. [2009] Martínez-Sansigre, A., et al. 2009, ApJ, 706, 184
- Martínez-Sansigre & Taylor [2009] Martínez-Sansigre, A., & Taylor, A. M. 2009, ApJ, 692, 964
- Martínez-Sansigre & Rawlings [2010] Martínez-Sansigre, A., & Rawlings, S. 2010, MNRAS, submitted
- McCarthy [1988] McCarthy, P. J. 1988, Ph.D. Thesis,
- McCarthy et al. [1995] McCarthy, P. J., Spinrad, H., & van Breugel, W. 1995, ApJS, 99, 27
- McCarthy [1993] McCarthy, P. J. 1993, ARA&A, 31, 639
- McLure et al. [2004] McLure, R. J., Willott, C. J., Jarvis, M. J., Rawlings, S., Hill, G. J., Mitchell, E., Dunlop, J. S., & Wold, M. 2004, MNRAS, 351, 347
- McNamara et al. [2010] McNamara, B. R., Rohanizadegan, M., & Nulsen, P. E. J. 2010, arXiv:1007.1227
- Meier et al. [2001] Meier, D. L., Koide, S., & Uchida, Y. 2001, Science, 291, 84
- Nenkova et al. [2008] Nenkova, M., Sirocky, M. M., Nikutta, R., Ivezić, Ž., & Elitzur, M. 2008, ApJ, 685, 160
- Ogle et al. [2006] Ogle, P., Whysong, D., & Antonucci, R. 2006, ApJ, 647, 161
- Peacock [1999] Peacock, J. A. 1999, Cosmological Physics, pp. 704. Cambridge, UK: Cambridge University Press, January 1999.,
- Punsly [2006] Punsly, B. 2006, ApJL, 651, L17
- Punsly [2007] Punsly, B. 2007, MNRAS, 374, L10
- Rawlings et al. [1989] Rawlings, S., Saunders, R., Eales, S. A., & Mackay, C. D. 1989, MNRAS, 240, 701
- Rawlings & Saunders [1991] Rawlings, S., & Saunders, R. 1991, Nature, 349, 138
- Rawlings et al. [2001] Rawlings, S., Eales, S., & Lacy, M. 2001, MNRAS, 322, 523
- Rees [1984] Rees, M. J. 1984, ARA&A, 22, 471
- Rengelink et al. [1997] Rengelink, R. B., Tang, Y., de Bruyn, A. G., Miley, G. K., Bremer, M. N., Roettgering, H. J. A., & Bremer, M. A. R. 1997, A&AS, 124, 259
- Richards et al. [2004] Richards, G. T., et al. 2004, ApJS, 155, 257
- Richards et al. [2006] Richards, G. T., et al. 2006, ApJS, 166, 470
- Simpson [1998] Simpson, C. 1998, MNRAS, 297, L39
- Sikora et al. [2007] Sikora, M., Stawarz, Ł., & Lasota, J.-P. 2007, ApJ, 658, 815
- Sivia [1996] Sivia, D. S. Skilling, J., Data Analysis: A Bayesian Tutorial, 2nd edn. (Oxford University Press, USA, 2006)
- Shabala et al. [2008] Shabala, S. S., Ash, S., Alexander, P., & Riley, J. M. 2008, MNRAS, 388, 625
- Shi et al. [2005] Shi, Y., et al. 2005, ApJ, 629, 88
- Thorne [1974] Thorne, K. S. 1974, ApJ, 191, 507
- Tristram et al. [2007] Tristram, K. R. W., et al. 2007, A&A, 474, 837
- Urry & Padovani [1995] Urry, C. M., & Padovani, P. 1995, PASP, 107, 803
- Willott et al. [1999] Willott, C. J., Rawlings, S., Blundell, K. M., & Lacy, M. 1999, MNRAS, 309, 1017
- Willott et al. [2002] Willott, C. J., Rawlings, S., Blundell, K. M., Lacy, M., Hill, G. J., & Scott, S. E. 2002, MNRAS, 335, 1120
- Willott et al. [2003] Willott, C. J., Rawlings, S., Jarvis, M. J., & Blundell, K. M. 2003, MNRAS, 339, 173
- Vardoulaki et al. [2009] Vardoulaki, E., Rawlings, S., Hill, G. J., Mauch, T., Inskip. K., Riley, J., Brand, K., Croft, S., Willott, C. J., 2009, MNRAS, 401, 1709