Discrete Source Survey of 6 GHz OH emission from PNe & pPNe and first 6 GHz images of K 3–35.
Abstract
Aims. The aim of this study is to investigate the physical properties of molecular envelopes of planetary nebulae in their earliest stages of evolution.
Methods. Using the 100m telescope at Effelsberg, we have undertaken a high sensitivity discrete source survey for the first excited state of OH maser emission (, at 6 GHz) in the direction of planetary and proto-planetary nebulae exhibiting 18 cm OH emission (main and/or satellite lines), and we further validate our detections using the Nançay radio telescope at 1.6–1.7 GHz and MERLIN interferometer at 1.6–1.7 and 6 GHz.
Results. Two sources have been detected at 6035 MHz (5 cm), both of them are young (or very young) planetary nebulae. The first one is a confirmation of the detection of a weak 6035 MHz line in Vy 2–2. The second one is a new detection, in K 3–35, which was already known to be an exceptional late type star because it exhibits 1720 MHz OH emission. The detection of 6035 MHz OH maser emission is confirmed by subsequent observations made with the MERLIN interferometer. These lines are very rarely found in evolved stars. The 1612 MHz masers surround but are offset from the 1720 and 6035 MHz masers which in turn lie close to a compact 22 GHz continuum source embedded in the optical nebula.
Key Words.:
radio lines: stars – masers – technique: interferometric – stars : circumstellar matter – stars : post AGB1 Introduction
Late-type stellar objects on the post-asymptotic giant branch (AGB) are expected to evolve through a phase, where the inner part of the stellar envelope is becoming ionized while the outer regions are still neutral. If the envelope is oxygen rich, such objects could exhibit OH emission from the neutral region. Planetary nebulae (PNe) evolve from the envelopes of AGB stars, through the very short ( 1000 yr) transition phase of proto-planetary nebulae (pPNe). During this phase, the nebular morphology and kinematics are dramatically altered: the initially spherical, slowly expanding AGB envelope becomes a PN with, usually, axial symmetry and high axial velocities. More generally, such objects may be classified as post-AGB stars. Until recently, very few pPNe were known, Vy 2–2 being one of them. The ground-state hyperfine transitions of OH have been observed towards hundreds of late-type stars and some planetary nebulae. Theoretical studies of possible pumping mechanisms of the 18 cm OH lines successfully explain both the strong 1612 MHz satellite line (see e.g. Elitzur et al. 1976), and, more recently, the 1665 and 1667 MHz main lines (see e.g. Collison & Nedoluha 1994; Pavlakis & Kylafis 1996a, b; Cragg et al. 2002). Nevertheless, theory is still uncertain because calculations of the OH populations in an expanding shell are a complex task with several competing processes which include: FIR (far infra red) pumping via the and ladders, NIR (near infra red) pumping from the radiation of the underlying star and circumstellar dust, line overlaps of FIR lines and collisional excitation through the ladders.
Excited-OH hyperfine transitions have been detected up to and in the and the ladders in the direction of several star-forming regions (for an OH level diagram, see figure 1 in Desmurs et al. 2002). In contrast, although the 1.6 GHz OH lines are easily detected towards late-type stars, the 1720 MHz line and the first excited state ( ) are either undetected or extremely rare and weak.
A couple of excited OH detections in evolved objects have previously been reported, NML Cyg at 6 GHz (, ) (Zuckerman et al. 1972) and AU Gem at 4.7 GHz () (Claussen & Fix 1981). However, neither detection has been confirmed by more recent observations(see for example the recent excited OH observations in NML Cyg by Sjouwerman et al. 2007).
During our previous observations of excited OH made with the Effelsberg telescope at 6 GHz of a sample of 65 stellar objects tracing different stages of stellar evolution, only one source (a post-AGB star) was detected, Vy 2–2 (see figure 2 from Desmurs et al. 2002). Zijlstra et al. (1989) conducted a discrete source survey for OH ground state maser emission at 1.6–1.7 GHz (18 cm) in the direction of several IRAS111Infrared astronomical satellite sources. They reported the detection of 21 possible post-AGB objects. In the meantime, more such sources in the critical transition phase between the AGB and the PN stage of evolution may have been identified.
We performed with Effelsberg sensitive observations of pPNe and PNe in the 6 GHz lines of OH. These observations probe highly excited inner layers of the circumstellar envelope (CSE) and they can provide important information on the local physical conditions and on the pumping routes leading to the OH maser phenomenon. We followed up our new detection of 6 GHz OH emission with sensitive single dish observations performed at 18 cm with the Nançay telescope and with imaging at 5 and 18 cm using MERLIN222MERLIN is the UK radio interferometer operated by the University of Manchester on behalf of STFC..
In Sect. 2., we describe the selection criteria for the input source sample. The observations are reported in Sect. 3 The results are given and discussed in Sects. 4 and 5., respectively. Finally the conclusions are presented in Sect. 6.
2 Source sample
In this work, we have undertaken a discrete survey of the first excited state of OH emission (, , 6 GHz (or 5 cm)) from post-AGB stars with previous detections of ground-state OH maser emission. Our sample is based on previous surveys of proto-planetary nebulae and very young PNe (Zijlstra et al. 1989, 2001; Te Lintel Hekkert & Chapman 1996; Hu et al. 1994; Engels 2002) from which we selected all sources north of declination –20 degrees exhibiting 1612 MHz emission alongside the 1665 and/or 1667 line. In Table 1, we give a complete list of the 48 sources searched by us : 47 are post–AGB objects and one is the red Supergiant star NML Cyg that had been suspected to show 6 GHz emission (Zuckerman et al. 1972). With respect to our previous survey on OH stars (Desmurs et al. 2002), we have repeated observations of those eight sources that are, or are suspected to be, post-AGB sources.
| IRAS Source | Other Name | Coordinates | LSR Vel. | |
|---|---|---|---|---|
| RA(2000) | DEC(2000) | (km s-1) | ||
| 042156000 | M 418 | 04:25:50.200 | 60:07:11.00 | 38.0 |
| 043953601 | 04:42:53.600 | 36:06:53.60 | 00.0 | |
| 052511244 | IC 418 | 05:27:28.204 | 12:41:50.26 | 00.0 |
| 061761036 | AFGL 915 | 06:19:58.216 | 10:38:14.69 | 01.0 |
| 073961805 | NGC 2440 | 07:41:55.400 | 18:12:33.00 | 42.0 |
| 073991435 | OH 231.84.2 | 07:42:16.737 | 14:42:14.04 | 35.0 |
| 093711212 | 09:39:53.600 | 11:58:54.00 | 00.0 | |
| 174231755 | 17:45:14.200 | 17:56:47.00 | 50.0 | |
| 174331750 | 17:46:15.900 | 17:51:49.00 | 120.0 | |
| 180911815 | 18:12:03.400 | 18:14:25.00 | 44.0 | |
| 181051935 | 18:13:32.200 | 19:35:03.00 | 15.0 | |
| 181351456 | OH 15.70.8 | 18:16:25.400 | 14:55:05.00 | 00.6 |
| OH 12.8.9 | 18:16:49.231 | 18:15:01.80 | 61.0 | |
| 182461032 | 18:27:24.000 | 10:30:24.00 | 27.0 | |
| 182761431 | OH 17.72.0 | 18:30:30.690 | 14:28:57.00 | 60.0 |
| OH 24.0.2 | 18:35:43.100 | 08:01:33.00 | 108.0 | |
| 183480526 | 18:37:32.520 | 05:23:59.40 | 00.0 | |
| 183491023 | 18:37:19.570 | 10:25:33.10 | 21.5 | |
| 183760846 | 18:40:24.120 | 08:43:57.80 | 114.0 | |
| 184910207 | 18:51:46.900 | 02:04:09.00 | 75.0 | |
| 185850900 | 19:00:53.700 | 09:05:01.00 | 64.0 | |
| 185960315 | OH 37.10.8 | 19:02:06.280 | 03:20:16.30 | 88.5 |
| OH 42.3.1 | 19:09:08.200 | 08:16:41.00 | 59.0 | |
| 190521431 | 19:07:33.900 | 14:36:45.00 | 27.0 | |
| 191140002 | 19:13:58.609 | 00:07:31.93 | 100.0 | |
| 192001035 | 19:22:26.800 | 10:41:24.00 | 40.0 | |
| 192040124 | 19:22:56.980 | 01:30:46.90 | 102.0 | |
| OH 53.6.2 | 19:31:22.500 | 18:13:20.00 | 11.0 | |
| 192131424 | 19:29:37.336 | 22:27:16.54 | 40.0 | |
| 192190947 | VY 2–2 | 19:24:22.141 | 09:53:55.84 | 62.0 |
| 192441115 | IRC10420 | 19:26:48.030 | 11:21:16.70 | 78.0 |
| 192552123 | K 3–35 | 19:27:44.000 | 21:30:05.00 | 09.0 |
| 192962227 | 19:31:45.590 | 22:33:42.80 | 40.0 | |
| 193432926 | M192 | 19:36:16.767 | 29:32:15.80 | 09.0 |
| 193522030 | OH 56.4.3 | 19:37:24.000 | 20:36:57.80 | 05.0 |
| 194372410 | 19:45:52.200 | 24:17:41.00 | 02.0 | |
| 194672213 | 19:48:51.900 | 22:21:15.00 | 44.5 | |
| 195001709 | 19:52:52.701 | 17:01:50.30 | 25.0 | |
| 195663423 | 19:58:32.280 | 34:31:33.70 | 45.0 | |
| 201781634 | 20:20:08.800 | 16:43:52.00 | 66.0 | |
| 202754001 | 20:29:24.900 | 40:11:21.00 | 00.3 | |
| 204062953 | 20:42:45.900 | 30:04:05.00 | 15.0 | |
| NML Cyg | 20:46:25.457 | 40:06:59.60 | 18.0 | |
| CRL 2688 | 21:02:18.803 | 36:41:38.00 | 40.0 | |
| 213064422 | IC 511 7 | 21:32:31.000 | 44:35:48.00 | 10.0 |
| 220365306 | 22:05:30.280 | 53:21:33.00 | 45.0 | |
| 234166130 | 23:44:03.282 | 61:47:22.18 | 38.5 | |
| 235417031 | 23:56:36.380 | 70:48:17.90 | 30.0 | |
3 Observations
3.1 The Effelsberg survey
With the 100m MPIfR radio-telescope at Effelsberg (Bonn, Germany), we have undertaken sensitive 6 GHz OH observations in May and June 2003. The half-power beam-width of the telescope at 6 GHz is 130”. We used a cooled HEMT dual-channel receiver connected to only one sense of polarization, left circular polarization (LCP). The system temperature was 60 K () including ground pick up and sky noise. We used a frequency switching observing mode with a frequency throw of 244.14 kHz. The auto-correlator AK90 was split into four bands of 10 MHz allowing us to simultaneously observe the two main lines (at 6030.747 and 6035.092 MHz) and the two satellite lines (at 6016.746 and 6049.084 MHz) of the OH state. There were 2048 channels per band giving a channel separation of 4.9 kHz and thus an effective channel separation of 0.24 km s-1. Proper functioning of the system was checked by observations of the strong 6 GHz OH emission from the two well known compact HII regions, W3(OH) and ON1.
Calibration of the data followed the procedure used in the 6 GHz survey of star-forming regions made by Baudry et al. (1997). OH spectra were calibrated by observations of NGC 7027 (Ott et al. 1994). The signal from the noise diode was calibrated in Jy assuming a flux density of 5.9 Jy for NGC 7027. We estimate that the flux density scale uncertainty is within 10%. For possible 6 GHz radio interference, we proceeded as in Baudry et al. (1997) and we simply discarded all corrupted scans. We reached an average 3 noise value of about 30 mJy for each 4.9 kHz channel.
3.2 Nançay observations
We performed observations of the ground-state 18 cm OH transitions in K 3–35 just a couple of months after the 6 GHz survey, in July 2003. We used the Nançay radio-telescope333The station de radioastronomie de Nançay, France, is operated in cooperation with the the Observatoire de Paris and the CNRS/INSU. Additional support is provided by the Région Centre. with its FORT upgrade 444Acronym for optimized focus for the radio telescope, see http://www.obs-nancay.fr/nrt/a_index.htm for detailed information.. The half-power beam-width at 1.6–1.7 GHz is 3.5 arcmin (EW) 19 arcmin (NS) (at zero declination). The 8192 channel digital auto-correlator was split into 8 banks of 1024 channels each, allowing simultaneous observations of the four ground-state transitions at 1612.231, 1665.402, 1667.359 and 1720.530 MHz in two complementary polarizations. Because Nançay is a transit instrument, the tracking time was limited to 1 hour providing typical 3 sensitivities of 0.10 Jy per channel.
We performed three runs, alternatively monitoring circular and linear polarization. We used two frequency-switching modes, favoring either maximum sensitivity, or double spectral coverage, for a similar velocity resolution of 0.07 km s-1. Unfortunately, the data were severely affected by radio frequency interference (RFI). The short time sampling used in the system allowed us to selectively remove most of the affected data, yielding reliable spectra. However, data editing resulted in less accurate flux and polarization calibrations. The absorption source W12 which we observed as a calibrator was also randomly affected. We estimate the uncertainty of the unpolarized flux densities to be about 20% after data editing.


3.3 MERLIN observations


| Frequency | R.A. | Dec | Pos. | LSR Vel. |
| (MHz) | (J2000) | (J2000) | Error | (km s-1) |
| H:m:s | ∘:′:′′ | (mas) | ||
| 6035 | 19:27:44.0213 | 21:30:03.415 | 3.2 | 21.1 |
| 1720 | 19:27:44.0209 | 21:30:03.395 | 13 | 21.5 |
| 1612 | 19:27:44.0229 | 21:30:03.309 | 5.6 | 9.1 |
| Component | Position Offset | flux | LSR Vel. | Width | |
| RA(mas) | DEC(mas) | mJy | (km s-1) | (km s-1) | |
| 1612 MHz | |||||
| 1 | 70.0 | 10.0 | 484 | 21.2 | 0.25 |
| 2 | 87.0 | 49.0 | 395 | 18.7 | 0.5 |
| 3 | 4.0 | 113.0 | 2152 | 9.1 | 0.5 |
| 4 | 47.0 | 33.0 | 212 | 2.0 | 0.3 |
| 1720 MHz | |||||
| 5 | 29.0 | 45.0 | 163 | 21.5 | 0.2 |
| 6035 MHz | |||||
| 6 | 5.0 | 52.0 | 105 | 21.7 | 0.2 |
| 7 | 24.0 | 25.0 | 950 | 21.1 | 0.4 |
| 8 | 29.0 | 26.0 | 184 | 19.8 | 0.3 |
Taking advantage of the new capabilities of MERLIN, we observed K 3–35 in dual circular polarization in the ground state (, , 1.6–1.7 GHz (or 18 cm)) and the first excited level (, ). All 6 antennas of MERLIN were available and all line observations were adjusted to a central of 12 km s-1. The 1612.231, 1665.402, 1667.359 and 1720.530 MHz lines were observed in April and May 2005, followed by 6035.092 and 6030.747 MHz line observations in December 2005. The 6 GHz observations used a bandwidth of 0.5 MHz giving a useful velocity coverage of 22 km s-1 at a resolution of 0.1 km s-1. The 1.6–1.7 GHz observations used 0.25 MHz, providing a velocity coverage of 42 km s-1 at a resolution of 0.18 km s-1. The half-power beam-widths at 1.6, 1.7 and 6 GHz were 226150 mas, 177130 mas and 5138 mas, respectively. The 3 sensitivity of an individual channel was a few tens of mJy (see Figures 3, 4 for precise values.)
The phase reference sources used at 6 and 1.6–1.7 GHz were B1923+210 and B1932+204A respectively. 3C84 was used to calibrate the bandpass. Data reduction and maser component fitting followed the procedures described in Diamond et al. (2003), and e.g. Green et al. (2007).
Maser components with close positions in successive channels are grouped in features, given in Table 2, 3. The relative position accuracy (derived from the beam size divided by the signal to noise ratio) is a few milli-arcsec for the 6 GHz features and the brightest 1.6–1.7 GHz features, up to 12 mas for the faintest. The uncertainties in comparing MERLIN observations in different frequency bands are better than 20 mas, dominated by errors in transferring phase solutions from the calibration source to the maser target (see Green et al. 2007, and references therein for a fuller description).
4 Results
4.1 Single dish results
From our survey of the first excited state of OH with Effelsberg, two sources were detected. We confirm the detection of Vy 2–2 (see also Desmurs et al. 2002) and we detected one new source, the young PN K 3–35, which exhibits a single feature around = 21 km s-1 in the 6035 MHz line; the line width at half intensity is around 0.8 km s-1. This OH line is the strongest ever detected at 6 GHz toward a late type star. Figure 1 shows the single dish spectra for our two detections. The left panel shows the spectrum for Vy 2–2. This spectrum corresponds to 2h20 min integration on-source (5 mJy noise level, channel width 0.24 km s-1). The right panel, shows our new detection in K 3–35. This spectrum was obtained after 50 minutes on-source integration (14 mJy noise level, channel width 0.24 km s-1). We did not detect the other main line at 6031 MHz, nor the satellite lines at 6017 and 6049 MHz, in Vy 2–2, K 3–35 or any other object555It is interesting to note that CRL 2688, classified as a young pPN on the basis of its strong mm-wave emission, was also observed in this work (see Table 1) but was not detected in excited OH.. Similar results were obtained for all other 6 GHz OH sources observed in ultra compact HII regions where the 6035 MHz emission is the dominant line (see Baudry et al. 1997).
The LTE ratio of 6035:6031 MHz emission is 20:14. The non-detection of K 3–35 at 6031 MHz (above a limit of 30 mJy) corresponds to a ratio , indicating a highly non-thermal excitation process at 6035 MHz. The observed single dish linewidth (Fig. 1) is similar to the thermal linewidth at 200–300 K, which could indicate that the maser is approaching saturation or is broadened by blending of more than one velocity component. This and other evidence for the maser nature of this line is discussed in Section 4.2.
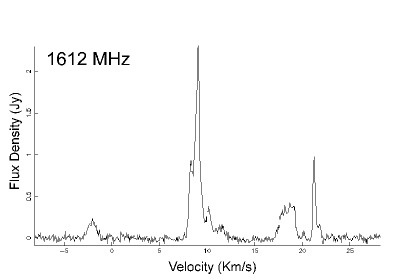
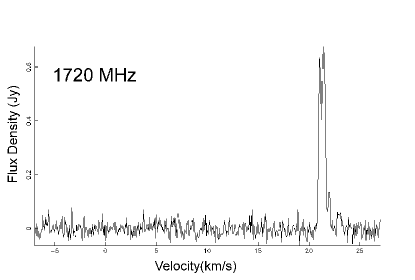
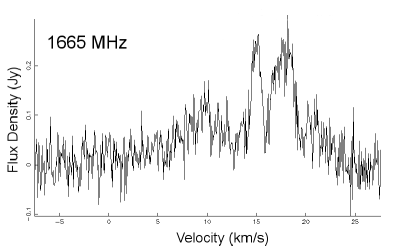
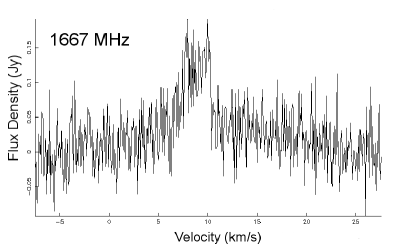
In Figure 2, we show the sum of the two circular polarization (RCP and LCP) obtained with Nançay at 18 cm toward K 3–35. Both satellite lines are showing strong narrow emission complexes. At 1720 MHz narrow features are observed close to the velocity of the 6035 MHz feature whereas at 1612 MHz, peaks are irregularly spread over 25 km s-1, also extending and even peaking at more blue shifted velocities (see also color image in Fig. 5). In both cases, the 18 cm features appearing at velocities above 20 km s-1 are strongly polarized (left-hand at 1612 MHz, right-hand at 1720 MHz). At velocities lower than 20 km s-1, polarization remains marginal. The main lines at 1665 and 1667 were also detected within this velocity range with a lower signal-to-noise ratio.
4.2 Imaging
The relatively strong 6035 MHz emission from K 3–35, and its strong 1.6–1.7 GHz maser emission (see Fig. 2), prompted us to examine whether they are genuinely associated. We therefore performed interferometric observations of K 3–35 with MERLIN.
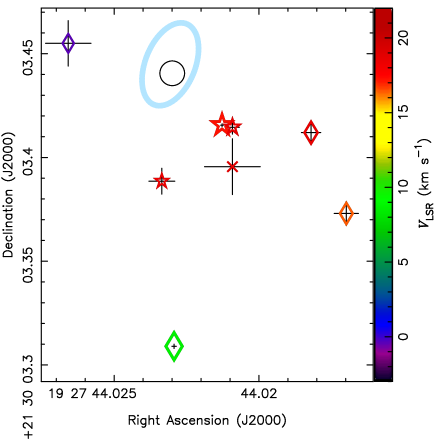
Our 1612 MHz channel maps are shown in Figure 3 and our 1720 and 6035 MHz channel maps are presented in Figure 4. The absolute positions of the strongest 6035, 1720 and 1612 MHz features are given in Table 2. The relative positions of the 6035, 1612 and 1720 MHz maser features are presented in Table 3 and are plotted in Figure 5. The 6035 MHz features, covering a velocity span of 19–22 km s-1, lie within about 40 mas of each other; this is an order of magnitude larger than the relative position uncertainty achieved with MERLIN. The 1720 MHz emission, at 21–22 km s-1, falls within 20 to 30 mas of the 6035 MHz masers, but is spatially unresolved within the larger position errors at the lower frequency. The 1612 MHz masers at similar velocities lie up to 60 mas west of the 6035 MHz emission but the more blue-shifted emission is extended over a much larger area of mas. The brightest 1612 MHz emission, at around 9 km s-1, is 100 to 140 mas south of the 6035 MHz masers and the emission at –2 km s-1 is displaced by almost as far to the NE.
The brightest 6035 MHz masers are less extended than the restoring beam; this provides a lower limit to their brightness temperature of K, confirming, in addition to the non LTE main line intensity ratio, the non-thermal nature of the emission. Maser amplification is further suggested by the observed 6035 MHz circular polarization (see analysis below and Fig. 6).
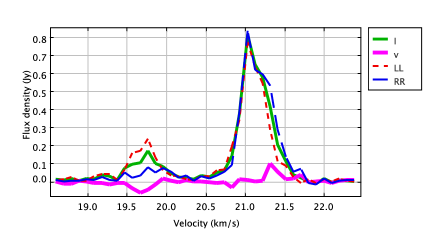
Observations at 6035 MHz were made in dual polarization only, so it was not possible to carry out a full polarization calibration nor to measure linear polarization. The ground state lines were observed in full polarization, which will be analyzed by Bains et al. (in prep). The 6035 MHz data show up to 25% circular polarization (Stokes V as a percentage of Stokes I) at 21.3 km s-1, far in excess of the MERLIN polarization leakage of 1–2%. Fig. 6 shows the flux densities averaged over the 4 pixels covering the two brightest features. (Because of our visibility spectra averaging only two 6035 MHz features are visible in Fig. 6 whereas three are given in Table 3.)
Stokes I and V are shown as thinner and thicker solid lines and the left- and right-hand circularly polarized (LCP, RCP) spectra are shown as lines with short dashes and long dashes, respectively. The feature at 19.8 km s-1 is dominated by LCP, possibly due to the interplay of velocity and magnetic field gradients (Cook 1975). Producing the RCP and LCP maps for the brightest 6035 MHz features observed at 21.1 km/s, we find that the two circularly polarized components are spatially coincident. If we interpret the frequency shift that we were able to measure in terms of Zeeman pair (about 0.1 km s-1, our spectral resolution), this suggests a line of sight magnetic field of mG, although a more sophisticated analysis is required for an accurate estimate (Bains et al. in prep). Our upper limit is consistent with the 0.9 mG field strength reported by Gómez et al. (2009) from their 1665 MHz maser spots found within about 150 AU from the 22 GHz continuum peak (open circle in Fig. 5). However, we cannot exclude that our field is stronger than that reported by Gómez et al. (2009), possibly due to the location of the 6035 MHz emission closer to the main exciting source than the 1665 MHz features measured by Gómez et al. (2009), or to beam averaging leading to depolarization in the larger VLA 18 cm beam.
5 Discussion
5.1 Vy 2–2
Vy 2–2 (G045.4–02.7) is a very young Planetary Nebula with a kinematic age around 200 yr (see Christianto & Seaquist 1998). Its most recent distance estimate (Bensby & Lundström 2001) is 3.8 kpc (see the discussion in Desmurs et al. 2002). The VLA maps show a slightly elongated continuum source at 4.885 GHz (Seaquist & Davis 1983). The continuum emission originates from a compact (diameter0.5”) and narrow (thickness 0.12”) shell of ionized gas. Seaquist & Davis (1983) located the 1612 MHz OH maser at the front edge of the ionized shell, coincident with a shock front and an ionization front, placing it on the near side of the expanding shell and thus providing an explanation for it being blue-shifted. This suggests that the 1612 MHz OH comes from the remnant AGB wind, and the atypical 6035 MHz excited state emission is probably caused by the impact of the shock front or the internal ionization. The 6035 MHz OH emission detected in this source with a peak flux of about 20 mJy may not be thermally excited, but interferometric observations would be needed to prove it definitely. This detection is consistent with that obtained by Jewell et al. (1985), and by Desmurs et al. (2002) and no significant variation was observed over a time span of 20 years.
5.2 K 3–35
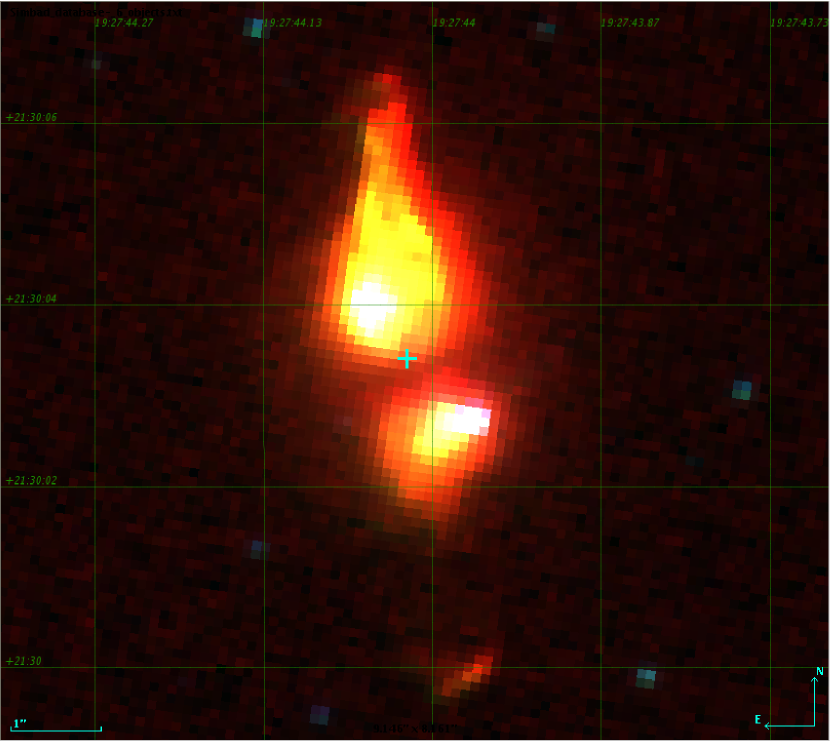
K 3–35, located at an estimated distance of 5 kpc (Zhang 1995), is considered to be a very young PN (Zijlstra et al. 1989) situated in the constellation Vulpecula and is one of the three PNe where water maser (Engels et al. 1985) emission at 22 GHz has been reported 666the two others are IRAS 17347–3139, de Gregorio-Monsalvo et al. (2004), and IRAS 18061–2505, Gómez et al. (2008). The presence of strong HeII emission and observed intensity ratios of optical emission lines, i.e. forbidden lines vs. hydrogen lines, are typical for PNe. VLA observations by Miranda et al. (2001) at 22 GHz of H2O emission led to the detection of three emitting regions associated with the source, two at the ends of the outflows (to the North and to the South) and the third one close to the center. They also reveal the shape of a clear bipolar structure typical of proto-Planetary Nebulae (see Figure 7) which allow the authors to conclude that this object has just begun its transformation into a Planetary Nebula. Recently, Velázquez et al. (2007) have modeled the morphology of this PN by considering a precessing jet evolving in a dense AGB circumstellar medium. Uscanga et al. (2008) re-analyzed the 22 GHz VLA data, and modeled the kinematics of the water maser emission from the central region. They claim the detection of a circular ring with a radius of 100 AU with an inclination to the line of sight of 55o, almost perpendicular to the observed outflows. In addition to the above works, emission in the 1612, 1667 and 1720 MHz lines of OH was reported by various authors (Engels et al. 1985; Te Lintel Hekkert 1990; Gómez et al. 2006, this work). Recently, Gómez et al. (2009) mapped with the VLA all four ground state lines of OH maser emission. They find that the 1665 and 1720 MHz emission is spatially coincident with the core of the nebula while the 1612 and 1667 MHz lines originate mainly from the extended southern lobe. This is consistent with our 18 cm OH maps (see e.g. Fig. 5).
Since 6 GHz OH lines are more commonly found in the direction of compact HII regions (Baudry et al. 1997), it is worth investigating whether our 6 GHz detection could be due to source contamination within the 2 arc min beam of the Effelsberg telescope at 6 GHz. We first used the IPAC data base to search for nearby objects within a radius of 2 to 3 arc min centered on IRAS 19255+2123 (K 3–35). In the most sensitive band of the MSX survey there is one source lying well outside the Effelsberg beam, while in the 2MASS survey there is no bright source in the immediate vicinity of the central object. There is, however, roughly 15 arc sec south of K 3–35, a 34 mJy radio source listed in the 4.85 GHz Green Bank GB6 catalog of Gregory et al. (1996); (see also Gregory & Condon 1991). This faint source with about 20 arc sec position uncertainty is most probably an extragalactic object nearly coinciding with K 3–35. Finally, our interferometric observations of K 3–35 show that all the OH masers lie close to the centre of the optical nebula. We are therefore confident that the 1612, 1720, and 6035 MHz maser emission is associated with K 3–35 and that the physical conditions in the neutral gas near the nebula center resemble those found in star forming regions thus giving rise to 6035 and 1720 MHz line excitation.
The 1612 MHz components detected with the Nançay radio telescope between -5 and +20 km s-1 do not show any 6 GHz counterpart whereas the emission observed around 21 km s-1 is detected at 1612, 1720 and 6035 MHz. We note that the 6035- and 1720- MHz masers lie close to the 22 GHz continuum source detected by Miranda et al. (2001)(Fig. 5). The bulk of the 1612 MHz emission is spread between 8 to 22 km s-1 and appears offset with respect to the 6035- and 1720- MHz emission. Our 1612 MHz maser results confirm the earlier VLA observations made by Gómez et al. (2009) showing that all features appear to be projected to the southwest of the radio continuum peak with the exception of the –2 km s-1 features lying to the northeast. The 1612, 1720 and 6035 MHz emission is spread out across an area of about 150 mas diameter, corresponding to about 750 AU if K 3–35 is at a distance of 5 kpc. This delineates the area in which the densest pockets of gas are favourable to OH masing conditions.
It is difficult to conclude from our OH data alone whether the 6035 MHz, the 1720 MHz or the 1612 MHz hot spots observed in K 3–35 are more closely associated with the central star, or if the star lies somewhere in between these OH emitting regions. Gómez et al. (2009) located the 1720 MHz emission at the core of the nebula and suggested that the same shock could excite both H2O and 1720 MHz OH masers. Miranda et al. (2001) measured an absolute position for the center of the system from their VLA 1.35 cm continuum data. Their position matches closely our 6035 MHz source position measurement (see Table 2 and Fig. 5). It is thus tempting to propose that the 6035 MHz and 1720 MHz emission mark the center of the stellar system. We find that the 1720 and 6035 MHz emission regions have a smaller velocity spread and are spatially much more compact (confined within about 30 mas), than the 1612 MHz emission. The different velocity spreads observed for the different OH transitions most probably reflect the different physical conditions required to coherently excite these maser transitions. We note that the velocity range displayed by the 6035 MHz emission is narrow, ranging between 19.6 to 21.9 km s-1, and very close to the emission observed at 1720 MHz. On the other hand the 1612 MHz emission exhibits a wide velocity spread with maser emission across nearly 25 km s-1. Miranda et al. (2001) observed an even greater velocity spread in their VLA data of the water maser line spots, with features up to +36 km s-1 at the southern edge of the nebula. Assuming the excited 6 GHz emission indicates the velocity of the stellar system, around 21 km s-1, then, the velocity spreads observed in the other transitions and in H2O from –3 to +36 km/s reflect the complex conditions required for coherent amplification in this peculiar expanding envelope.
5.3 Remarks on OH pumping
Desmurs et al. (2002) have briefly reviewed the excitation mechanisms for the OH ground-state transitions in late-type stars and the possible role of far infrared pumping. Based on the absence of 6 GHz OH lines from late-type stars, in contrast to several HII regions exhibiting 6 GHz lines, they suggested that the absorption of 35 and 53 m photons (see their Fig. 1) might be the dominant pumping scheme.
From the ISO data and the non detection of these IR lines in neither of our two sources (Vy 2–2 or K 3–35, see He & Chen 2004; He et al. 2005), we deduce that the line to continuum ratio is, from their 3 sigma upper limits, smaller than 0.15 and 0.19 for K 3–35 and Vy 2–2, respectively.
The exact pumping efficiency is unknown but even if it would reach 25% as required by most theoretical models (see for example Elitzur et al. 1976; Thai-Q-Tung et al. 1998) or even by the model by Gray et al. (2005) who proposed an alternative route mainly using the 53 m photons to explain the 1612 MHz line in late type stars, we do not expect that IR pumping is playing a dominant role. 777Assuming that the ratio between the radio and IR solid angles is close to unity, we find that in our two sources the FIR photons exceed the emitted ’radio photons’ by a factor larger than about 40 (see discussion in Desmurs et al. 2002).
The absence of detectable excited maser emission at 6 GHz in PNe or pPNe observed here (except for the weak emission in Vy 2–2 and K 3–35) tends to argue in favor of a pumping scheme based on the absorption of 35 and 53 m photons (Desmurs et al. 2002). In that case the absorption of FIR photons at 35 and 53 m excites the OH from the ground state to the levels.
However, in the two young pPNe studied here weak 6 GHz OH emission is present. In the case of Vy 2–2 the ionization shell from where the maser emission seems to originate, may present physical conditions (shock, higher temperature and density) similar to those prevailing in HII regions. We also note that satellite line emission detected at 1720 MHz in K 3–35 is exceptionally rare in evolved stars. Despite the fact that this maser emission is essentially found in supernovae remnants, at least one other case exists where 1720 MHz maser emission was detected in a young pPN (source OH 0009.1–0.4, see Sevenster & Chapman 2001). For that source, the authors argue that a post-AGB star might show such an emission just after it evolves from the thermally pulsing phase. We further note that isolated 1720 MHz maser sources have been observed in several star forming regions (see Etoka et al. 2005; Edris et al. 2007). This suggests that a hybrid pumping model applying to both some well evolved stars and HII regions, or even a pumping scheme similar to that required for OH maser emission in massive star forming regions (see Pavlakis & Kylafis 1996a, 2000), may be successful to explain the OH properties of the two pPNe studied here. In addition, around +21 km s-1, marking the 6 GHz emission in K 3–35, strong, opposite circular polarizations were found for the 1612 and 1720 MHz components, whereas the rest of the 1612 MHz components were almost unpolarized. This fact could suggest the merging of two distinct circumstellar structures with possibly different pump mechanisms, parameter ranges, and/or distances to the star, although any large separation between sources at similar velocity remains puzzling. Consistently, Miranda et al. (2001) displayed noticeable polarization of the 1665 MHz masers, which they located near the center of the system.
In fact, the maser emission observed in Vy 2–2 and K 3–35 is atypical. Both sources show OH emission from the ground-state of OH and from the 6 GHz excited state. It is hard to deduce relevant physical parameters from existing OH excitation models. Nevertheless, we stress that the 1612 and 1720 MHz lines are observed simultaneously but at different locations. From Caswell (1999), the ground state satellite lines (1612 or 1720 MHz) appear to be most often associated with the 1665 MHz ground state main line, but nearly never at the same time. Theoretical works treat the 1612 and 1720 MHz lines as complementary with one line being commonly inverted while, in the same volume, the other one is in absorption. In Cragg et al. (2002), it is found that 1612 MHz appears in a zone of high density ( cm-1), for a high OH column density ( cm) and a high gas temperature T100K. However, we presume that such conditions do not apply well to K 3–35. Although they are clearly associated with K 3–35, the 1612 and 1720 MHz lines are well separated (see position offset in Table 3 and Fig. 5) and, contrary to models of OH in the interstellar medium, both lines are seen in emission thus suggesting that we indeed observe specific OH excitation in two distinct circumstellar structures.
6 Summary
We have detected an excited-state 6 GHz OH maser in the pPNe K 3–35, as part of an extensive survey of 47 northern (p)PNe with ground-state OH maser emission. The only other object detected at 6 GHz was the known emitter Vy 2–2. These results reveal that 6 GHz emission is exceptional from such objects and suggest that K 3–35 and Vy 2–2 exhibit a peculiar stage of structure and/or evolution. Follow-up MERLIN interferometric observations of K 3–35 show that the 6035 MHz emission is very compact and located close in angular separation and velocity to the 1720 MHz maser line, while the 1612 MHz line appears to be offset by 0.1 arcsec. We also note that the 1720 MHz line is very rarely found in post-main sequence objects. Finally, we suggest that the 1720 and 6035 MHz line emissions are closely associated with the center of the stellar system.
Acknowledgements.
The authors would like to thank Dr. M.Wang for her kind help during the observations with the Effelsberg telescope. This work makes use of EURO-VO software, tools or services. The EURO-VO has been funded by the European Commission through contract numbers RI031675 (DCA) and 011892 (VO-TECH) under the 6th Framework Programme and contract number 212104 (AIDA) under the 7th Framework Programme. We gratefully thank the anonymous referee for his useful comments.References
- Baudry et al. (1997) Baudry, A., Desmurs, J. F., Wilson, T. L., & Cohen, R. J. 1997, A&A, 325, 255
- Bensby & Lundström (2001) Bensby, T. & Lundström, I. 2001, A&A, 374, 599
- Caswell (1999) Caswell, J. L. 1999, MNRAS, 308, 683
- Christianto & Seaquist (1998) Christianto, H. & Seaquist, E. R. 1998, AJ, 115, 2466
- Claussen & Fix (1981) Claussen, M. J. & Fix, J. D. 1981, ApJ, 250, L77+
- Collison & Nedoluha (1994) Collison, A. J. & Nedoluha, G. E. 1994, ApJ, 422, 193
- Cook (1975) Cook, A. H. 1975, MNRAS, 171, 605
- Cragg et al. (2002) Cragg, D. M., Sobolev, A. M., & Godfrey, P. D. 2002, MNRAS, 331, 521
- de Gregorio-Monsalvo et al. (2004) de Gregorio-Monsalvo, I., Gómez, Y., Anglada, G., et al. 2004, ApJ, 601, 921
- Desmurs et al. (2002) Desmurs, J.-F., Baudry, A., Sivagnanam, P., & Henkel, C. 2002, A&A, 394, 975
- Diamond et al. (2003) Diamond, P. J., Garrington, S. T., Gunn, A. G., et al. 2003, MERLIN User Guide, v.3, http://www.merlin.ac.uk/user_guide/
- Edris et al. (2007) Edris, K. A., Fuller, G. A., & Cohen, R. J. 2007, A&A, 465, 865
- Elitzur et al. (1976) Elitzur, M., Goldreich, P., & Scoville, N. 1976, ApJ, 205, 384
- Engels (2002) Engels, D. 2002, A&A, 388, 252
- Engels et al. (1985) Engels, D., Schmid-Burgk, J., Walmsley, C. M., & Winnberg, A. 1985, A&A, 148, 344
- Etoka et al. (2005) Etoka, S., Cohen, R. J., & Gray, M. D. 2005, MNRAS, 360, 1162
- Gómez et al. (2008) Gómez, J. F., Suárez, O., Gómez, Y., et al. 2008, AJ, 135, 2074
- Gómez et al. (2006) Gómez, Y., Tafoya, D., Anglada, G., et al. 2006, in Revista Mexicana de Astronomia y Astrofisica Conference Series, Vol. 26, Revista Mexicana de Astronomia y Astrofisica Conference Series, 22–23
- Gómez et al. (2009) Gómez, Y., Tafoya, D., Anglada, G., et al. 2009, ApJ, 695, 930
- Gray et al. (2005) Gray, M. D., Howe, D. A., & Lewis, B. M. 2005, MNRAS, 364, 783
- Green et al. (2007) Green, J. A., Richards, A. M. S., Vlemmings, W. H. T., Diamond, P., & Cohen, R. J. 2007, MNRAS, 382, 770
- Gregory & Condon (1991) Gregory, P. C. & Condon, J. J. 1991, ApJS, 75, 1011
- Gregory et al. (1996) Gregory, P. C., Scott, W. K., Douglas, K., & Condon, J. J. 1996, ApJS, 103, 427
- He & Chen (2004) He, J. H. & Chen, P. S. 2004, New Astronomy, 9, 545
- He et al. (2005) He, J. H., Szczerba, R., Chen, P. S., & Sobolev, A. M. 2005, A&A, 434, 201
- Hu et al. (1994) Hu, J. Y., Te Lintel Hekkert, P., Slijkhuis, F., et al. 1994, A&AS, 103, 301
- Jewell et al. (1985) Jewell, P. R., Schenewerk, M. S., & Snyder, L. E. 1985, ApJ, 295, 183
- Miranda et al. (2001) Miranda, L. F., Gómez, Y., Anglada, G., & Torrelles, J. M. 2001, Nature, 414, 284
- Ott et al. (1994) Ott, M., Witzel, A., Quirrenbach, A., et al. 1994, A&A, 284, 331
- Pavlakis & Kylafis (1996a) Pavlakis, K. G. & Kylafis, N. D. 1996a, ApJ, 467, 300
- Pavlakis & Kylafis (1996b) Pavlakis, K. G. & Kylafis, N. D. 1996b, ApJ, 467, 309
- Pavlakis & Kylafis (2000) Pavlakis, K. G. & Kylafis, N. D. 2000, ApJ, 534, 770
- Seaquist & Davis (1983) Seaquist, E. R. & Davis, L. E. 1983, ApJ, 274, 659
- Sevenster & Chapman (2001) Sevenster, M. N. & Chapman, J. M. 2001, ApJ, 546, L119
- Sjouwerman et al. (2007) Sjouwerman, L. O., Fish, V. L., Claussen, M. J., Pihlström, Y. M., & Zschaechner, L. K. 2007, ApJ, 666, L101
- Te Lintel Hekkert (1990) Te Lintel Hekkert, P. 1990, PhD thesis, Leiden Observatory, Leiden University, P.O. Box 9513, 2300 RA Leiden, The Netherlands
- Te Lintel Hekkert & Chapman (1996) Te Lintel Hekkert, P. & Chapman, J. M. 1996, A&AS, 119, 459
- Thai-Q-Tung et al. (1998) Thai-Q-Tung, Dinh-v-Trung, Nguyen-Q-Rieu, et al. 1998, A&A, 331, 317
- Uscanga et al. (2008) Uscanga, L., Gómez, Y., Raga, A. C., et al. 2008, MNRAS, 390, 1127
- Velázquez et al. (2007) Velázquez, P. F., Gómez, Y., Esquivel, A., & Raga, A. C. 2007, MNRAS, 382, 1965
- Zhang (1995) Zhang, C. Y. 1995, ApJS, 98, 659
- Zijlstra et al. (2001) Zijlstra, A. A., Chapman, J. M., te Lintel Hekkert, P., et al. 2001, MNRAS, 322, 280
- Zijlstra et al. (1989) Zijlstra, A. A., Te Lintel Hekkert, P., Pottasch, S. R., et al. 1989, A&A, 217, 157
- Zuckerman et al. (1972) Zuckerman, B., Yen, J. L., Gottlieb, C. A., & Palmer, P. 1972, ApJ, 177, 59